AP Macroeconomics Exam
Unit 1.1
Scarcity
- Scarcity is the basic problem in economics in which society does not have enough resources to produce what everyone needs and wants
- Scarcity is faced by all societies and economic systems
- Economics is the study of how individuals, firms, and governments deal with scarcity
- We must make choices about how to manage our resources in the most efficient way possible. The choices we make are known as trade-offs
Macroeconomics vs. Microeconomics
Microeconomics
- Microeconomics is the study of how individuals, households, and firms make decisions and distribute resources
- Example: Whether a highschool graduate chooses to go to college or directly into the workforce
Macroeconomics
- Macroeconomics is the branch of economics that studies behavior and performance of the entire economy instead of just the smaller economic factors
- It deals with issues such as unemployment
Factors of Production
What to produce? How to produce? From whom to produce?
To produce in an economy it is required to recognize the limited supply of the 4 production factors:
Land — natural resources and raw materials used to make products.
water, vegetation, oil, minerals, and animals
Labor — the skills and abilities that individuals devote to a task for which they get paid
Capital — these types of resources can be divided into two types:
Physical capital: inanimate resources such as money, property, and inventories
Human capital: human skills and knowledge, which is more difficult to measure, but still considered very important in the economic system
Entrepreneurship — the ability of an individual to coordinate the other categories of resources to invent or produce a good or service.
Bill Gates, Steve Jobs, Henry Ford
Organization of Society
In order to decide what to produce and how, different societies have organized themselves based on these factors:
Tradition — tied to the evolution of economics, and it is related to subsistence and tribal life
Command — consists of the central planning of the economy which differed in different regions of the world depending of the political regime
Market — it is the place in the economy where buyers and sellers perform transactions. The modern market was built from the foundation of the Laissez Faire (free market) philosophy introduced in the 19th century, which emphasizes the importance of property rights and private property
Mixed — most countries today will display a mix of command and market structure. This is important because the government does play a role in organizing the economy, though to different degrees across the globe
Opportunity Costs and Trade-offs
Trade-offs — each of the alternative choices that you gave up when making a decision.
Ex: you walk into the cafeteria for lunch at school and you have the option for pizza, a cheeseburger, or chicken sandwich for lunch. If you choose to have pizza, then the cheeseburger and chicken sandwich are your trade-offs
Opportunity cost — this is the value of the next best alternative when making a choice
Ex: if you choose pizza, but get to the front of the line and the last slice of pizza was taken by the kid in front of you, you choose a cheeseburger instead. The cheeseburger is your opportunity cost because it is the next best alternative if your first choice is unavailable
Unit 1.2
Introduction to the Production Possibilities Curve (PPC)
It’s a graph that shows us all of the possible production combinations of goods, given a fixed amount of resources. In economic analysis we have to develop assumptions to be able to draw conclusions.
For the Production Possibilities Curve we assume three things when we are working with these graphs:
Only two goods can be produced
Resources are fixed
Technology is fixed
The production possibilities curve can illustrate several economic concepts including:
Efficiency
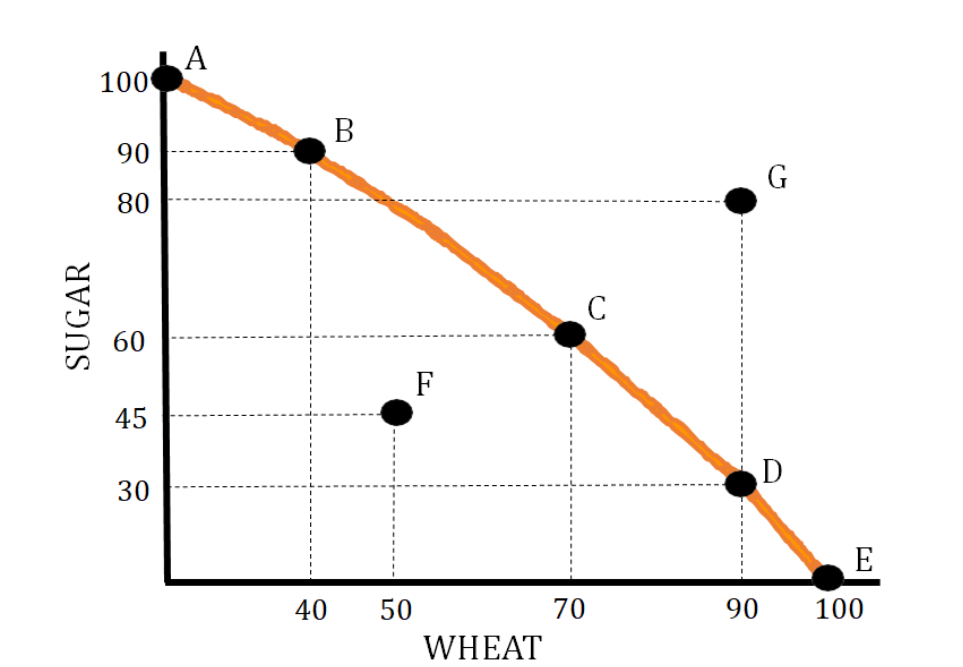
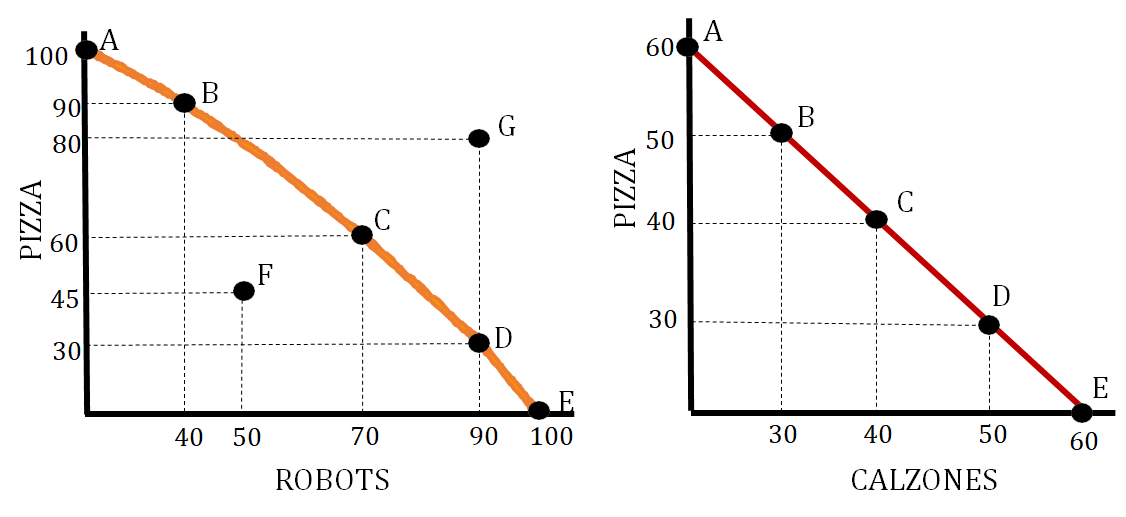
Allocative Efficiency — this efficiency means we are producing at the point that society desires. This is represented by a point on the production possibilities curve that meets the desires and needs of a particular society. If you are given the situation where a a particular society needs about an equal amount of sugar and wheat then the allocative efficient point would be C
Productive Efficiency — this efficiency means we are producing at a combination that minimizes costs. This is represented by any point on the production possibilities curve. In the below graph this is represented by points A, B, C, D, and E
Point F in the graph below represents an inefficient use of resources. You can produce at this point, but you are not using all your resources as efficiently as possible
Point G represents a production level that is unattainable. At this point, you do not have the needed amounts of resources to produce the number of goods shown
At any point below F is considered extreme inefficiency and could be an indicator of a severe recession
Scarcity
Since scarcity is a situation where there are limited resources versus unlimited wants, a production possibilities curve is used to show how we produce goods and services under this condition. This is shown in the graph above by showing how, given a fixed set of resources, we can produce either combination A, B, C, D, or E
Opportunity Cost/Per-Unit Opportunity Cost
This is the value of the next best alternative. We represent this as what we are losing when we change our production combination
Ex: moving from A to B on the graph above, the per-unit opportunity cost when moving to point A to point B is 1/7 unit of sugar (10 sugar/40 wheat).
Opportunity Cost can also be determined using a production possibilities table:
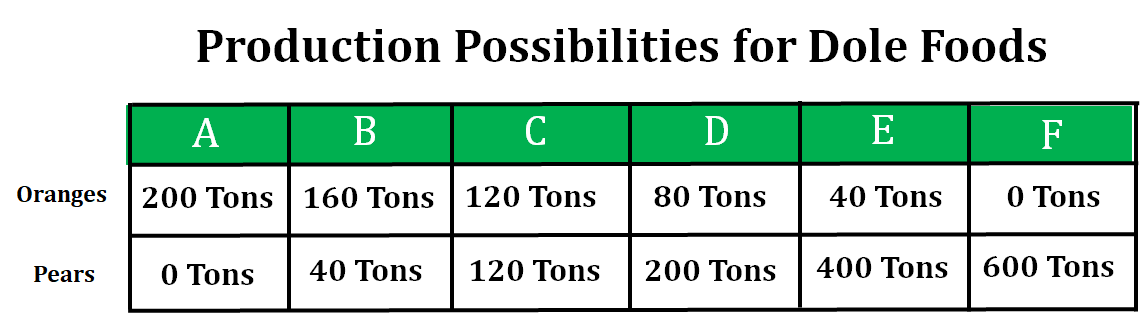 The opportunity cost of moving from point C to D is 40 tons of oranges. The per-unit opportunity cost of moving from point C to point D is ½ ton of oranges (40 tons of oranges/80 tons of pears)
Formulas to Calculate Opportunity Cost
The opportunity cost for GOOD X = Δ Good Y Production/Δ Good X Production
The opportunity cost for GOOD X = Time to Make 1 Unit of GOOD X/Time to Make 1 Unit of GOOD Y
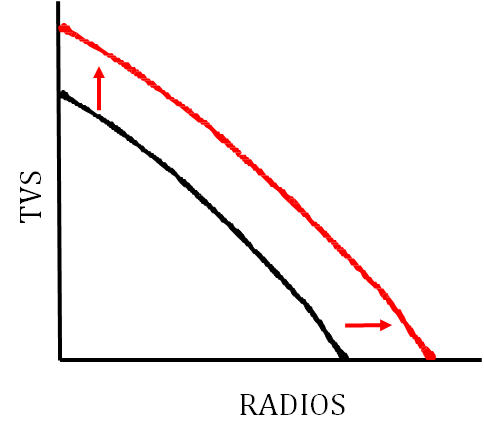
Economic Growth
Economic growth is shown by a shift to the right of the production possibilities curve
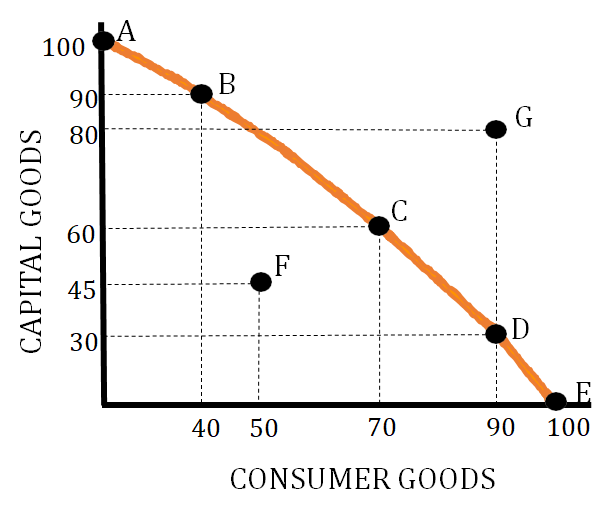
 If a country produces more capital goods than consumer goods, the country will have greater economic growth in the future. If the country illustrated below produces at point B, they will see more economic growth than if they produce at point D.
Since capital goods and tools are good for machinery, the increased production of them will lead to more production of consumer goods in the future, causing more economic growth
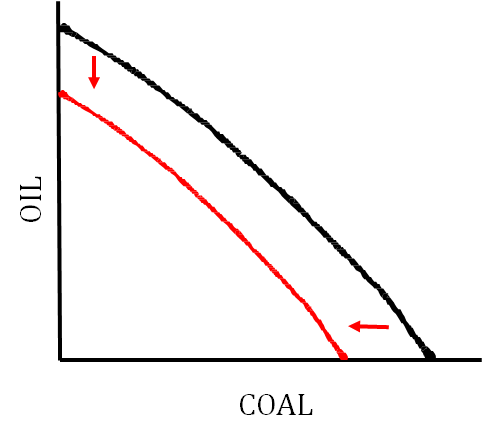
Economic Contraction
Economic contraction is show by a leftward shift of the production possibilities curve
Constant Opportunity Cost vs. Increasing Opportunity Cost
The production possibilities curve can illustrate two types of opportunity costs:
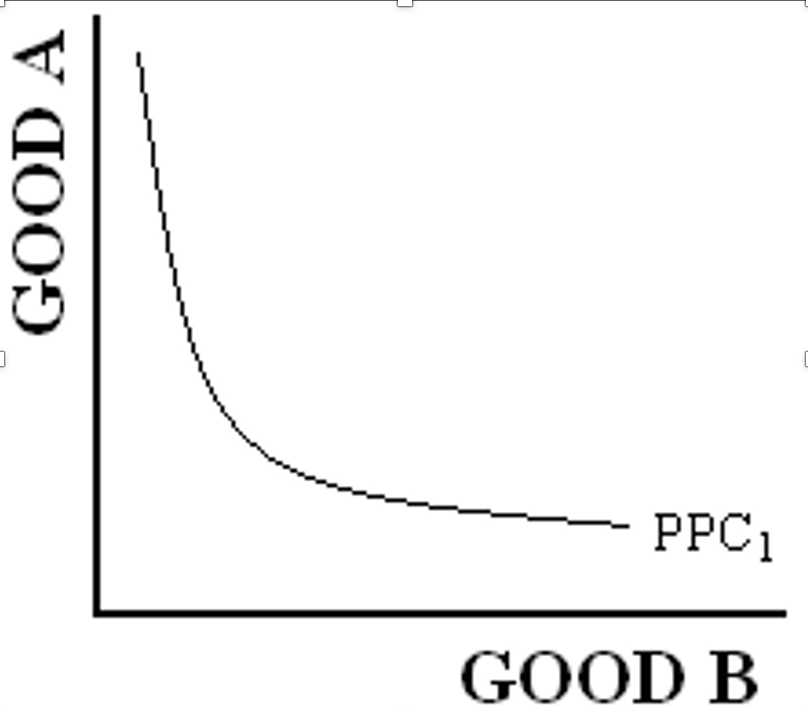
Increasing opportunity costs occurs when you produce more and more of one good and you give up more and more of another good. This occurs when resources are less adaptable when moving from the production of one good to the production of another good.
Constant opportunity cost occurs when the opportunity cost stays the same as you increase your production of one good. This indicates that the resources are easily adaptable from the production of one good to the production of another good.
 Increasing opportunity cost Constant opportunity cost
As you move from point A to B You give When you move from point A 10 pizzas, as you move from point from to point B you give up 10 pizzas point B to C you give up 300 pizzas. and when you move from point B to C you give up 10 pizzas
Decreasing opportunity cost — this curve is not possible in real life
Shifters of the Production Possibilities Curve (PPC)
Factors that can cause the PPC to shift:
Change in the quantity or quality of resources
Change in technology
Trade
The PPD can show how these changes affect it as well as illustrate a change in productive efficiency and inefficiency
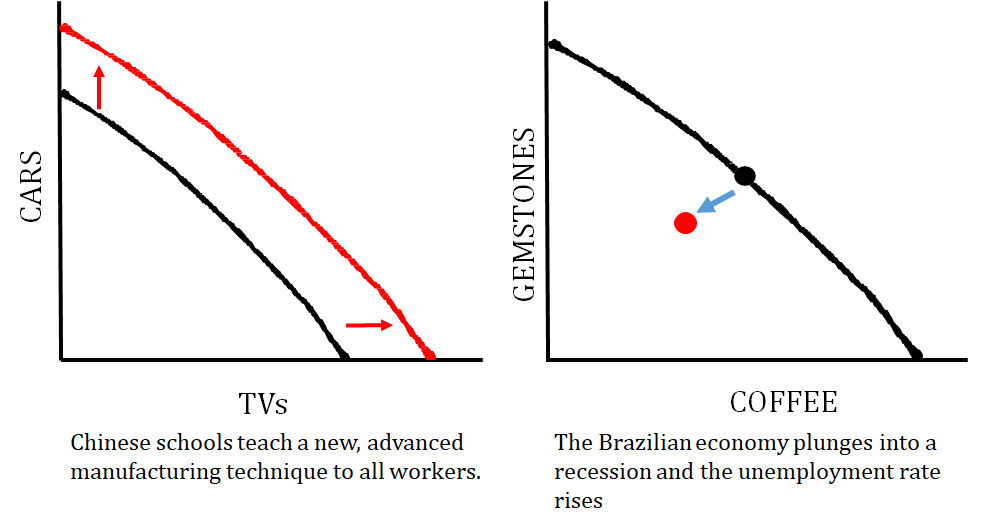 This graph shows how an improvement This graph shows what happens in the quality of resources impacts the when a country is producing at an graph. inefficient point.
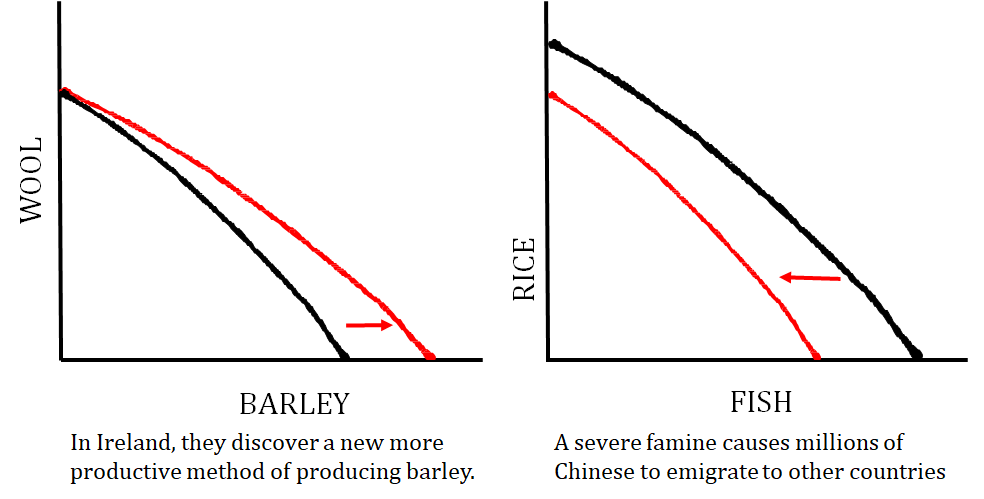 This graph shows a technology change that This graph shows what happens when just impacts one good that a when the the quantity of resources changes quantity of resource country produces
Unit 1.3
Comparative Advantage and Trade
Countries will consequently increase its productions by engaging in trade. However, there are certain conditions that may provide advantages and disadvantages to some countries over others in the production of the specific goods.
Key Terms
Absolute Advantage — The ability to produce more of a good or service with a given amount of resources than someone else. This means that they can produce a good at a lower cost, but also in less time than its competitors
Comparative advantage — the ability to produce a good at the lowest opportunity cost
Terms of Trade — the rate at which one good can be exchanged for another
Introduction
The concepts of absolute and comparative advantage are used to illustrate how individual countries or entities interact and trade with each other. These concepts also focus on how people specialize in what they are good at producing, and how they trade for goods and services that they are not as efficient in producing. Countries aim to gain competitive edge over others in the economy to gain more power in the global market.
Two types of problems within these concepts:
Output Problems
Output problems focus on data associated with what each party can produce with a given set of resources, as well as who should specialize in each good.
The rules for these problems are:
To determine the absolute advantage, you are simply looking for which country can produce a higher amount of the good or service
To determine comparative advantage, you have to calculate per unit opportunity cost using the formula given up/gain (the amount of good you are giving up divided by the amount of good you are gaining). Once you have calculated per unit opportunity cost, the country with the lowest one has a comparative advantage.
If the two countries can both make the same amount of the good, then we say neither country has an absolute advantage
Countries export what they have a comparative advantage in, and import what they don’t have a comparative advantage in
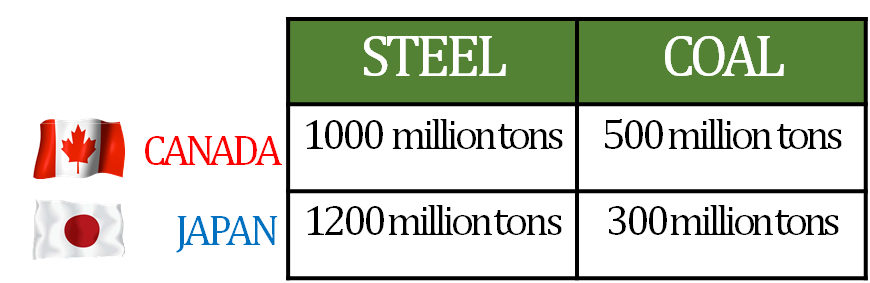
Determining Absolute Advantage
Using the table above, we could determine that Japan has an absolute advantage in steel (1200 > 1000) and Canada has an absolute advantage in coal (500 > 300)
Determining Comparative Advantage
The per unit opportunity cost for steel in Canada is ½ a unit of coal (500/1000)
The per unit opportunity cost for steel in Japan is ¼ a unit of coal (300/1200)
Since ¼ is less than ½, Japan has comparative advantage in steel
The per unit opportunity cost for coal in Canada is 2 units of steel (1000/500)
The per unit opportunity cost for coal in Japan is 4 units of steel (1200/300)
Since 2 is less than 4, Canada has comparative advantage in coal
Japan will export steel to Canada
Terms of trade
Terms of trade are determined by looking at the two opportunity costs and choosing number that falls between the opportunity costs in order for it to be beneficial to both countries
Acceptable terms of trade for this situation would be:
1 coal = 3 units of steel
1 steel = 1/3 units of coal
Input Problems
Input problems focus on how much of a resource is needed to produce one unit of a particular good or service.
The rules for these problems are:
To determine absolute advantage, you are looking for the country that uses the least amount of resources (i.e. the lower number)