Chapter 2: Descriptive Statistics (copy)
2.1 Stem-and-Leaf Graphs (Stemplots), Line Graphs, and Bar Graphs
- Stem-and-leaf graph or stemplot: easy to compute the median and other quantiles. Each data point is converted into stem and leaf, e.g., 438 (stem: 43; leaf: 8)
- Outlier: an observation that does not fit the rest of the data
- Line graph: A graph used to show changes over time
- X-axis: this is the explanatory variable
- Data values: the content that fills a space in a record
- Y-axis: the response variable
- Frequency: the number of times a value of the data occurs
- Bar graphs: used to display grouped data or categorical data; the identity of the sample points within the respective groups is lost
2.2 Histograms, Frequency Polygons, and Time Series Graphs
- Histogram: a graphical representation in the x-y form of the distribution of data in a data set; x represents the data and y represents the frequency or relative frequency. The graph consists of contiguous rectangles.
- Frequency Polygons: looks like a line graph but uses intervals to display ranges of large amounts of data
- Convenient starting point: a lower value carried out to one more decimal place than the value with the most decimal places
- Discrete data: type of data that includes whole, concrete numbers with specific and fixed data values determined by counting
- Paired data set: two data sets that have a one-to-one relationship so that:
Calculator Steps to Create a Histogram (calculator steps)
- Press Y=. Press CLEAR to delete any equations.
- Press STAT 1:EDIT. If L1 has data in it, arrow up into the name L1, press CLEAR, and then arrow down. If necessary, do the same for L2.
- Into L1, enter 1, 2, 3, 4, 5, 6.
- Into L2, enter 11, 10, 16, 6, 5, 2.
- Press WINDOW. Set Xmin = .5, Xmax = 6.5, Xscl = (6.5 – .5)/6, Ymin = –1, Ymax = 20, Yscl = 1, Xres = 1.
- Press 2nd Y=. Start by pressing 4:Plotsoff ENTER.
- Press 2nd Y=. Press 1:Plot1. Press ENTER. Arrow down to TYPE. Arrow to the 3rd picture (histogram). Press ENTER.
- Arrow down to Xlist: Enter L1 (2nd 1). Arrow down to Freq. Enter L2 (2nd 2).
- Press GRAPH.
- Use the TRACE key and the arrow keys to examine the histogram
2.3 Measures of the Location of the Data
- Quartiles:the numbers that separate the data into quarters; may or may not be part of the data
- Percentiles: a number that divides ordered data into hundredths
- First quartile: the value that is the median of the lower half of the ordered data set
- Interquartile range: is the range of the middle 50 percent of the data values; found by subtracting the first quartile from the third quartile.
- IQR = Q3 - Q1
- Smaller outlier: Q1 - IQR(1.5)
- Larger outlier: Q2 - IQR(1.5)
- k: the kth percentile. It may or may not be part of the data.
- i: the index (ranking or position of a data value)
- n: the total number of data
- kth percentile: i = (k/100)(n + 1)
- x: the number of data values counting from the bottom of the data list up to but not including the data value for which you want to find the percentile.
- y: the number of data values equal to the data value for which you want to find the percentile.
- n: the total number of data.
- Formula for percentile: x + (0.5y/n) (100)
2.4 Box Plots
- Box plots: a graph that gives a quick picture of the middle 50% of the data
Finding the minimum, maximum, and quartiles (calculator steps)
- Enter data into the list editor (Pres STAT 1:EDIT). If you need to clear the list, arrow up to the name L1, press CLEAR and then arrow down.
- Put the data values into the list L1.
- Press STAT and arrow to CALC. Press 1:1-VarStats. Enter L1.
- Press ENTER.
- Use the down and up arrow keys to scroll.
Constructing a Box Plot (calculator steps)
- Press 4:Plotsoff. Press ENTER.
- Arrow down and then use the right arrow key to go to the fifth picture, which is the box plot. Press ENTER.
- Arrow down to Xlist: Press 2nd 1 for L1
- Arrow down to Freq: Press ALPHA. Press 1.
- Press Zoom. Press 9: ZoomStat.
- Press TRACE, and use the arrow keys to examine the box plot
2.5 Measures of the Center of the Data
- Mean: a number that measures the central tendency of the data; a common name it is 'average.'
- Median: a number that separates ordered data into halves
- The sample mean: The average number of the sample
- Population mean: The average number of the population.
- Mode: The value that appears most often in a set of data.
- The Law of Large Numbers: if you take samples of larger and larger size from any population, then the mean x of the sample is very likely to get closer and closer to µ.
- Sampling distribution: a probability distribution of a statistic that comes from choosing random samples of a given population
- Relative frequency distribution: the ratio of the number of times a value of the data occurs in the set of all outcomes to the number of all outcomes
- Relative frequency table: a data representation in which grouped data is displayed along with the corresponding frequencies
- Clear list L1. Pres STAT 4:ClrList. Enter 2nd 1 for list L1. Press ENTER.
- Enter data into the list editor. Press STAT 1:EDIT.
- Put the data values into list L1.
- Press STAT and arrow to CALC. Press 1:1-VarStats. Press 2nd 1 for L1 and then ENTER.
- Press the down and up arrow keys to scroll.
- Symmetrical: a figure or shape that can be divided into two equal parts by a line
- Skewed to the left: the graph is pulled out to the left.
- Skewed to the right: the graph is pulled out to the right.
2.7 Measures of the Spread of the Data
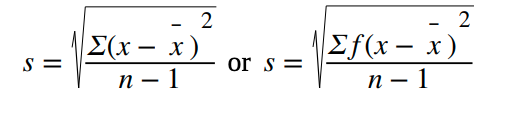
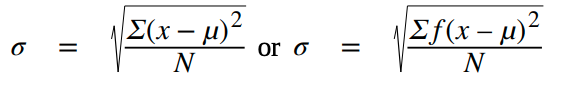
- Standard deviation: a number that is equal to the square root of the variance and measures how far data values are from their mean
- Variance: average of the squares of the deviation
Sampling Variability of Statistic
- Sampling variability: the observed value of a statistic depending on the particular sample selected from the population and it will vary from sample to sample
- Standard error of the mean: indicates how different the population means is likely to be from a sample mean.
- The central limit theorem: states that the distribution of sample means approximates a normal distribution as the sample size gets larger.