Chapter1
Chapter 1: Statistics for Managers Using Microsoft Excel
Introduces the importance of statistics in management and decision-making.
Highlights the relevance of Microsoft Excel in analyzing data for managerial purposes.
Understand definitions and issues when defining variables.
Learn how to define variables and understand different measurement scales.
Learn data collection methods and sampling techniques.
Understand data preparation issues and survey errors.
Why Use Statistics?
Historical Context
Theatrical promotion example in the 1900s:
Basic marketing strategies: flyers and local advertisements.
Pricing strategies based on past experiences of ticket sales.
Modern Application
Use of technology:
Online ticketing systems to automate inventory updates.
Dynamic pricing techniques based on demand.
Insights derived from sales data influence advertising strategies.
How effective is the modern approach to advertising
Disney's success with 'The Lion King “
Increased sales through data analytics and customer insights.
Disney followed the plan of action presented in this chapter.They:
Collected and summarised daily&weekly data
Performed tests and experiments on data to analyze it
Using results the insights were used to develop new interactive seating map that allowed customers to buy tickets for specific sears and permitted disney to adjust ticket pricing for each seat and their performance
What is Statistics?
The collection of methods that allow one to work with data effectively.
It is a TOOL to obtain INFORMATION from DATA
It provides us with a formal basis to
summarize & visualize data
Reach conclusions about data
Make reliable predictions about business activities
Improve the business process
Framework for Statistics
To minimise errors , we use the DCOVA framework that organises a set of tasks to apply statistics correctly
Define the data to meet an objective
Collect data from appropriate sources
Organise the data collected through tables
Visualise data through charts
Analyse data collected , reach conclusions and present results
(Note Define and Collect steps must be done first , the rest are done in varying orders)
Importance of Data in Business Analytics
Business Analytics: Combine statistical methods with information systems for decision-making.This includes
Statistical methods to uncover relationships in data.
Information systems methods to collect and process large datasets using technology.
Management science method to develop optimization models that support all levels of management , from strategic planning to daily operations
Data Science: Extract meaningful insights from data.
Involves programming, math, and statistics.
Extract insights from data using predictive analytics and AI
Write applications to automate data processing & calculations
Clearly convey the meaning of results and how they can be used to solve business problems
Big Data: Describes large volumes of fast, diverse data.
This data refers to
Structured data stored in files or worksheets
Unstructured data that has an irregular pattern and contains values that are nor comprehensible without further interpretation like text , pictures , videos or audio.
Definitions and Terminology
Variable: Characteristic of an item that can vary.
Data: Values linked to variables
Statistics: Methods that analyze data
Descriptive vs Inferential Statistics:
Descriptive: Organizes and presents data.
Inferential: Draws conclusions about characteristics if a population from samples.
DCOVA Framework - Define
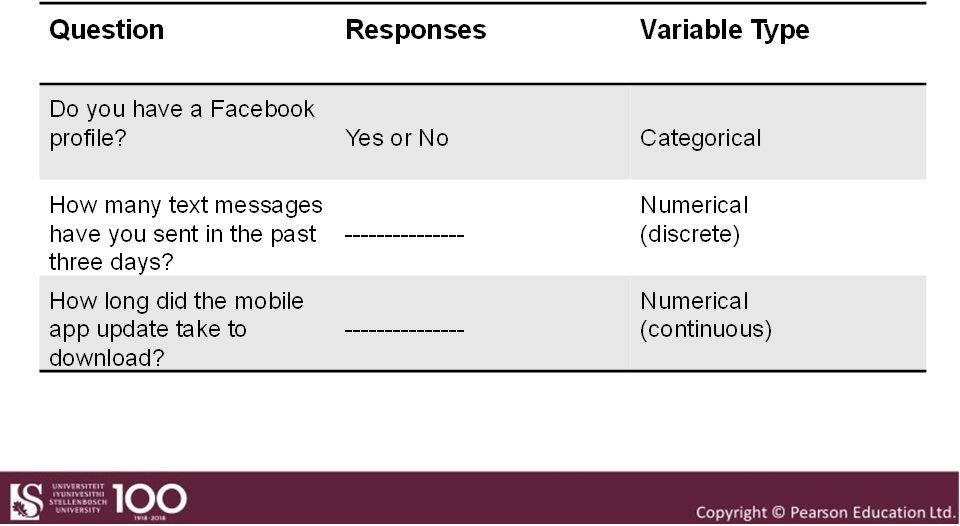
Types of variables
Categorical (qualitative) Variables
Defined categories (e.g., yes/no, colors).
Numerical ( quantitative ) Variables
Represented by counted / measured quantities:
Discrete: Countable items over a finite range.
Continuous: Measured quantities over a finite range.
Examples of types of variables

Measurement scales
Nominal Scale: Classifies categorical data.No ranking (e.g., Yes/No responses, gender, or colors).
Ordinal Scale: Classifies categorical data . Implies ranking (e.g., survey satisfaction ratings).
Interval Scale: Classifies numerical data.Difference is meaningful, no true zero (e.g., temperature).
True Zero (Ratio Scale):
A true zero point means that a value of zero signifies the complete absence of the variable being measured.
Examples of ratio scales with true zeros include:
Length (0 cm means no length)
Weight (0 kg means no weight)
Temperature in Kelvin (0 K is absolute zero, the absence of thermal energy)
With a true zero, ratios between values are meaningful (e.g., 20 meters is twice as long as 10 meters).
Ratio Scale: Classifies numerical data.Difference and true zero present (e.g., weight).
No True Zero (Interval Scale):
An interval scale has equal intervals between values, but the zero point is arbitrary, meaning it doesn't represent the absence of the variable.
Examples of interval scales without true zeros include:
Temperature in Celsius or Fahrenheit (0°C or 0°F doesn't mean the absence of temperature).
Calendar dates (0 doesn't mean the absence of time).
Ratios between values are not meaningful in interval scales (e.g., 20°C is not twice as hot as 10°C).
DCOVA Framework - Collection Methods
Data is either collected from a population or a sample
Population and Sample
Population: Entire set of items of interest.
Sample: A smaller portion of the population.
Why use Sampling?
Time and cost efficiency.
More practical
Population parameter vs Sample statistics
Population parameter summarises the value of a specific variable for a population
Sample Statistic summarises the value of a specific variable for sample data
Sample statistics are used to estimate population parameters
Activities Sources of Data arise from
Capturing data generated by business activities
A bank studies years of financial trasnactions to help identify fraud patterns
Economists use data on searches done via Google to help forecast future economic conditions
Marketing companies use tracking data to evaluate the effectiveness of their website
Distributing data compiled by an organization or individual
Financial data on a company provided by investment services
Industry/market data from market research firms
Stock prices , weather conditions and sports statistics in daily newspaper
Compiling responses from a survey. Examples of Survey data:
Asking which laundry detergent had the best stain removing abilities
Political polls of registered voters
Surveying customer satisfaction on P/S
Conducting experiments and recording the outcome
Consumer testing different versions of a product to help determine which one should be pursued further
Material testing to determine right choice
Market testing on product promotions to determine which one to use more broadly
Conducting and observational study and recording the results
Market researchers using focus groups to get unstructured responses to open ended questions
Measuring the time it takes for customers to be served in a fast food establishment
Measuring the volume of traffic through an intersection to determine if some form of advertising at the intersection is justified.
Observational Studies & Designed Experiments Have A Common Objective
Both are attempting to quantify the effect that a process change (called a treatment) has on a variable of interest.
In an observational study, there is no direct control over which items receive the treatment.
In a designed experiment, there is direct control over which items receive the treatment.
Sources of Data
Primary Sources: The data collector is the one using the data for analysis
Data from political surevys
Data collected from experiment
Observed data
Secondary Sources: The person performing data analysis is not the data collector
Analyzing census data ( survey of the population )
Examining data from data on the internet
A Sampling process begins with a SAMPLING FRAME
A sampling frame is a listing of items that make up the population
Frames are the data sources such as population lists , directories or maps.
Population Lists: A comprehensive list of individuals within a target population, such as a list of registered voters. For example, if a political analyst wants to conduct a survey about voter preferences, they may use the list of registered voters in a state as their sampling frame. This ensures they are surveying individuals who have the right to vote.
Directories: These are organized collections of names and contact information. For instance, a marketing researcher might use a business directory to compile a list of local businesses to survey about their advertising needs. However, if the directory is outdated, it may miss new businesses, leading to incomplete or biased results.
Maps: Researchers may use geographic maps to outline areas for conducting surveys. For instance, in a study assessing transportation usage, city planners might use maps to define neighborhoods where they will survey residents about their commuting patterns. Inaccuracies in the maps could lead to some neighborhoods being excluded, skewing the results.
Inaccurate or biased results can result if a frame excludes certain groups or portions of the population
Using different frames to generate data can lead to dissimilar conclusions
Types of Samples
Nonprobability Samples:
Convenience: Easy , inexpensive and convenient to obtain.
Judgment: Expert opinion selected.
Probability Samples:
Simple Random: Equal chance of selection.
Stratified: Proportional representation from subgroups.
Cluster: Representatives from each cluster of population.
Data Preprocessing
Data Cleaning: Adjusting data for inaccuracies and inconsistencies.
Importance: Prepares data for analysis and correctness.
Techniques: Identify and fix coding errors, unify formats, and manage missing values.
Survey Errors
Coverage Error: Excludes groups from the selection process.
Nonresponse Error: Differences between respondents and non-respondents.
Sampling Error: Differences that arise due to using a sample instead of the entire population.
Measurement Error: Errors from poorly designed questions.
Summary of Learning Points
Address issues in defining variables.
Utilize appropriate measurement scales.
Employ effective data collection and cleaning methods.
Recognize types of errors in survey methodologies.