Unit 3.6 ~ Age Structure Diagrams
Age cohorts & growth = groups of similarly aged individuals
- 0-14 = prereproductive;
- 15 - 44 = reproductive age;
- 45 + = post reproductive
- Size difference between 0-14 & 15-44 indicates growth rate * Larger 0-14 cohort = current & future growth * Roughly equal 0-14 & 15-44 = slight growth/stable * Larger 15-44 = pop. decline
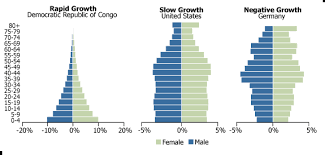
- Extreme Pyramid shape = rapid growth
- Less extreme pyramid = slow, stable growth
- House = stable, little to no growth
- Narrowest @ base = declining pop.
\