Tectonic Processes and Hazards
}}STRUCTURE OF THE EARTH}}
The Earth’s crust is between 5 and 40 km thick
- Oceanic crust is thin and dense. It varies from 6-10km thick
- Continental crust is older, thicker and less dense. it varies from 45-50km thick
The lithosphere is 100km thick
The mantle is 2900 km thick
- The mantle surrounds the core * The upper mantle is solid, the lower mantle is semi-molten
The outer core is 2250km thick
- Semi-molten, liquid Ni and Fe (nickel and iron) 4500-6000ºC
The inner core is 1200km thick
- Hottest part of the Earth’s structure: 6000ºC. Solid, Fe (iron)
}}PLATE TECTONIC THEORY}}
The lithosphere is broken into 7 major tectonic plates, and more minor plates which move over the asthenosphere.
%%MANTLE CONVECTION%%: heat produced by decay of radioactive elements in the Earth’s core which heats the lower mantle and creates convection currents. Hot magma is believed to move in circles in the asthenosphere, causing plates to move
%%SLAB PULL%%: newly formed oceanic crust at mid-ocean ridges becomes denser and thicker as it cools, and sinks into the mantle, pulling the rest of the plate with it
%%SUBDUCTION%%: if seafloor spreading occurs, the earth should be expanding, but as new crust forms, crust is also being destroyed by subduction (one plate slides beneath another and melts)
%%SEAFLOOR SPREADING%%: mid-ocean ridges form when magma is forced up and hardens and pushes plates apart
In the 1950’s, the study of paleomagnetism confirmed seafloor spreading, by showing that every 400 000 years, the magnetic field of Earth changes direction.
- When magma cools, magnetic materials line up with the direction of the Earth’s magnetic field
}}PLATE BOUNDARIES}}
}}CONVERGENT/DESTRUCTIVE: where two plates collide}}
- %%OCEANIC-CONTINENTAL%% * Oceanic plate which is denser gets subducted beneath continental plate into the mantle and melts. Deep ocean trenches and fold mountains are formed. * Friction causes intermediate and deep earthquakes in the Benioff zone * Volcanic eruptions occur as magma pushes through faults in the continental crust to the surface
- %%OCEANIC-OCEANIC%% * Denser or faster of the two plates is subducted. Deep ocean trenches and underwater volcanoes form (which can rise above the water and form an island arc) * Shallow to deep focus earthquakes * The 2004 Boxing Day tsunami
- %%CONTINENTAL-CONTINENTAL%% * Also known as a collision margin. Both plates are the same density, so neither are subducted, but they collide and crumple forming fold mountains * Shallow focus earthquakes occur here * No volcanoes form as there are no gaps for magma to pass through
}}DIVERGENT/CONSTRUCTIVE: where two plates move apart}}
- %%OCEANIC-OCEANIC%% * Mid ocean ridges form where new land is built. Underwater mountains also form (they cover over 60000km of ocean floor). Transform faults are found cutting across ridges. * Shallow focus earthquakes occur, but are less dangerous as they are underwater * Submarine volcanoes can form which grow to form islands e.g. Iceland
- %%CONTINENTAL-CONTINENTAL%% * Rift valleys form where the crust is stretched and breaks into faults which collapse, forming steep sided valleys * Earthquakes occur here
}}CONSERVATIVE/TRANSFORM: where two plates slide past each other}}
- Where two plates slide past each other, causing a fault. No crust is made or destroyed * No volcanic activity * Earthquakes occur when plates stick and pressure builds up, later being released as shallow focus earthquakes
}}NEPAL 2015}}
7.8 magnitude
25TH April 2015
Indian and Eurasian plate boundary
Epicentre 80km north-west of Kathmandu
Initial quake and aftershocks killed 8633, injured 21000 and left 3 million homeless
The effects of the earthquake were weakened as it occurred at midday, meaning that many people were at work, so collapse of residential property had a lesser effect.
Nepal has low rural population density, and most of the effects were rural
Nepal ranks 197th of 229 in GDP
Weak infrastructure was damaged or destroyed
Very few buildings were aseismic in design
There were over 100 aftershocks which contributed to death tolls
Landslides and avalanches happened in the Himalayas cutting off some rural areas
Emergency services were not prepared to manage with the scale of destruction
Tourism economy collapsed: US$5 billion was lost which roughly equates to 25% of GDP
US$6.6 billion needed for rebuilding
- Nepal is believed to be at risk of another strong earthquake as its possible not all the pressure was released
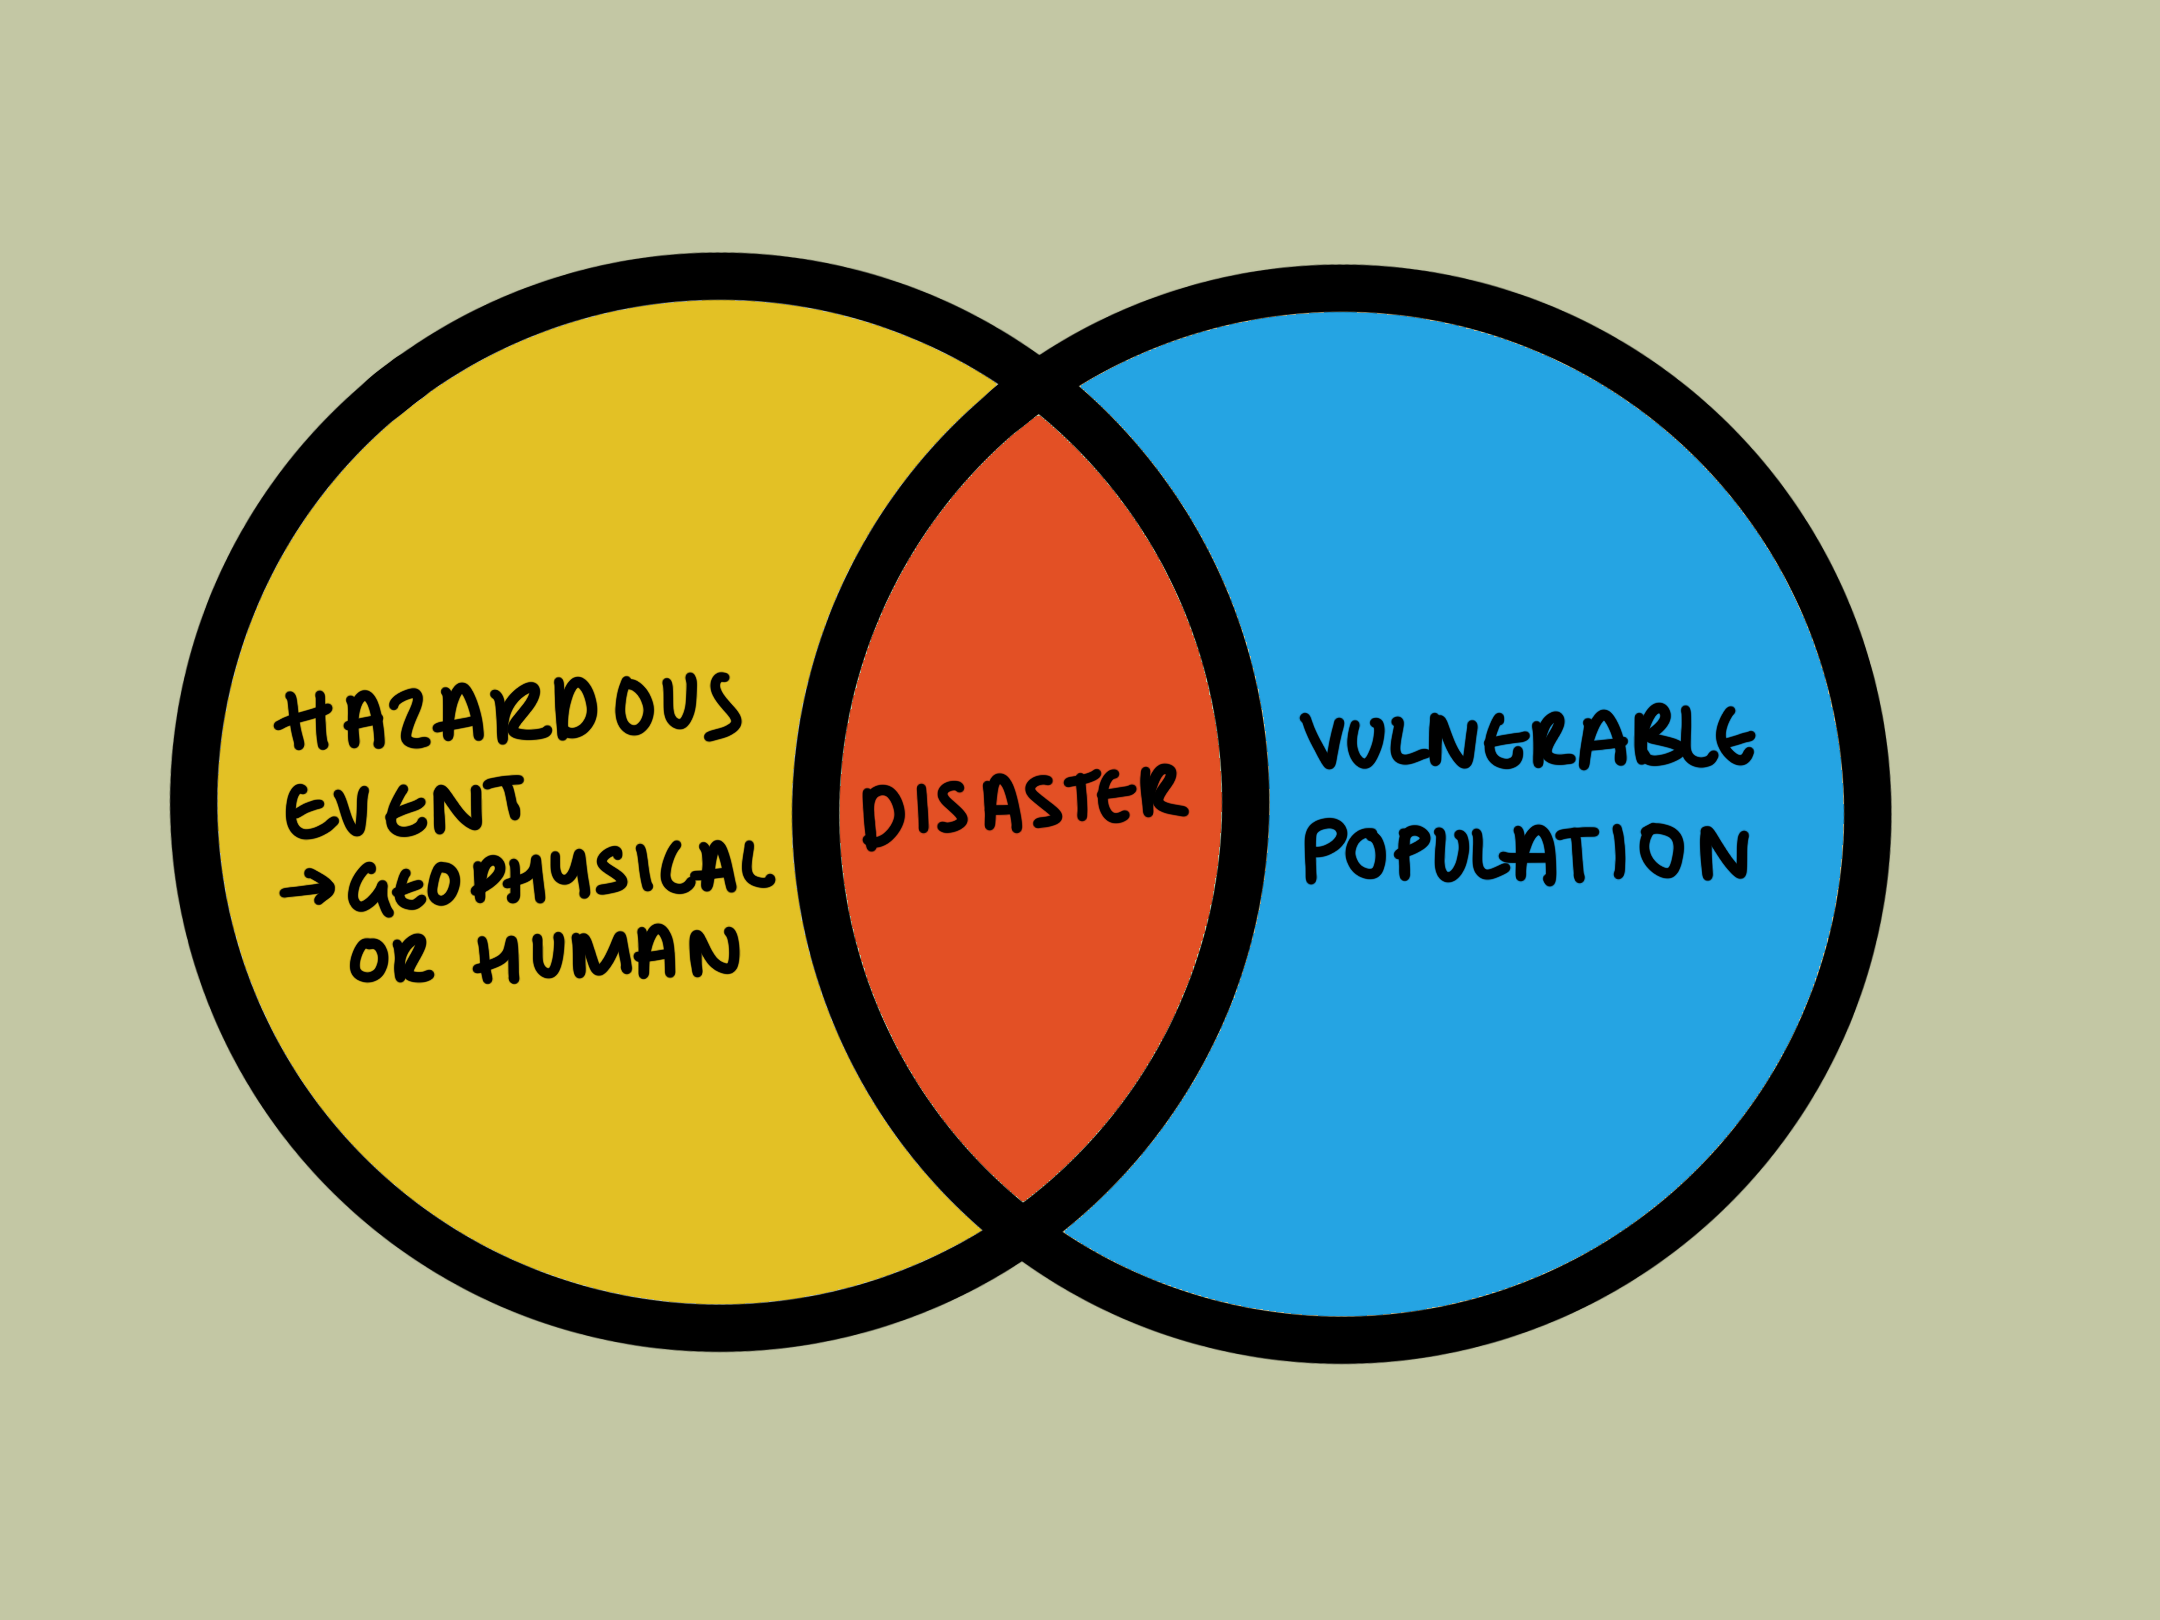
%%NATURAL HAZARDS%%: A natural process becomes a natural hazard when it affects people
%%DISASTERS%%: A natural hazard can become a disaster under specific conditions (which are hard to define) but is usually when a hazard affects a vulnerable population which cannot cope with its own resources
%%EARTHQUAKES%%
10.000 people per year die due to earthquakes
95% of earthquakes occur on tectonic boundaries
Earthquakes occur when pressure between two plates becomes too high and the rock fractures, releasing energy in the form of seismic waves
- The point where the pressure is released: FOCUS
- The point on the surface directly above the focus: EPICENTRE
%%SEISMIC WAVES%%
Primary and secondary waves = body waves: they travel through Earth’s body
Love waves = surface waves: they travel across the Earth’s surface
- P waves: primary/pressure * Fastest * First to reach the surface * Travel through both solids and liquids * Only cause damage in powerful earthquakes
- S waves: secondary/shear * 60% of the speed of P waves * Travel through solids * More damaging than P waves
- L waves: surface love waves * Slowest * Most damaging * Larger * All energy is focussed on the Earth’s surface
Seismic waves are measured with a seismometer which detects movement of the ground
%%MEASURING EARTHQUAKES%%
Magnitude is measured using the Moment Magnitude Scale which measures:
- Size of the seismic waves
- The amount of slippage
- The area of the fault surface which is broken
- The resistance of the affected rock
The scale is from 1 (smallest) to infinity, however it usually stops at 10 as the largest recorded earthquake measured 9.5. The scale is logarithmic, meaning each number is 10x more powerful than the previous
Intensity is measured using the Modified Mercalli Intensity Scale which observes the experience of those who were present when the earthquake occurred. It measures form I to XII (hardly noticed - catastrophic)
%%EFFECTS OF EARTHQUAKES%%
Effects of earthquakes depend on physical and human factors such as development, population and preparedness
%%PRIMARY EFFECTS%%: effects which occur as a direct result of the earthquake
- Groundshaking: buildings, bridges, roads and infrastructure are damaged. Can cause death/injury
- Crustal fracturing: when the surface of the earth physically cracks
%%SECONDARY EFFECTS%%: effects which occur after the earthquake
- Liquefaction: when surface rocks and earth lose strength and become somewhat liquid. Subsoil can no longer support foundations causing building collapse. This makes rescue difficult, and disrupts underground infrastructure
- Landslides/avalanches: shaking stresses slopes, causing a loss of structural integrity and collapse
- Tsunami: underwater earthquakes displace water columns causing a tsunami wave to form
}}1989 LOMA PRIETA EARTHQUAKE}}
17th october 1989
6.9 magnitude
Near San Fransisco
The marina district was hit the worst, as it was built on man-made land made up of soft, sandy soil.
- Groundshaking was amplified, and liquefaction occurred
The Cyprus freeway collapsed in the marina district causing 42 of 67 deaths when drivers on the lower level were crushed - the bridge was built on soft mud, but the rest stood on sand and gravel, so didn’t experience as severe damage
%%AFTERSHOCKS%%
In the weeks and months after an earthquake, smaller earthquakes occur as the land in the area where the first earthquake occurred settles again
- Aftershocks often cause further damage, and can be high magnitude * Following the Christchurch earthquake, there was a 6.3 magnitude aftershock which caused more damage and deaths than the initial earthquake as it had a shallower focus closer to the city
%%PREDICTION%%
Earthquakes cannot be accurately predicted
Risk zones can be identified; such as plate boundaries, and areas previously exposed to large scale earthquakes
Research on precursors (warning signs) is improving, but is yet to be reliable enough for accurate predictions
%%INTRA PLATE EARTHQUAKES%%
Intra-plate earthquakes occur in the middle of plates away from margins. Their cause is unclear, but is possibly build up of pressure on ancient faults
}}EYJAFJALLAJOKULL}}
2010
100.000 commercial flights cancelled globally
10 million passengers stranded/unable to board flights in Europe
US$1.7 billion airline revenue lost globally
30% of global airline capacity cut, 75% of European airline capacity
US$5 billion lost from European economy
Kenya lost US$1.3 million per day due to inability to trade goods (20% of the economy is based on export of green vegetables and flowers to Europe)
%%VOLCANOES%%: openings in the Earth’s crust from which lava, ash and gas erupt
When tectonic plates move, pressure builds up and magma and gas move to the surface. Magma reaches the surface (and is called lava) where it cools, and turns to rock. This means volcanoes grow as they erupt
Over 500 million people are at risk from volcanoes
In the last 300 years, 260.000 people have died from volcanic eruptions
1900 volcanoes are currently considered active
%%PRIMARY HAZARDS%%
- LAVA FLOWS: streams of erupted lava from a volcano * Very hot: reach 1170ºC. They can take many years to cool * Not a huge threat to humans as they are slow enough for evacuation * Threat to property, land and infrastructure as they destroy anything in their path
- PYROCLASTIC FLOWS: mixtures of dense hot rock, lava, ash and gas ejected by a volcano * Travel up to 100km/hr * Destroy anything in their paths * Reach up to 700ºC
- TEPHRA AND ASH FALLS: volcanic ash and rock that enter the air during an eruption * Larger pieces fall near the volcano; this can cause death/injury * Smaller piece can travel many thousands of kilometres * Ash is very heavy so can cause roofs to collapse * Ash can clog up engines, meaning air travel has to be closed
- GAS ERUPTIONS: dissolved gases in magma are released into the atmosphere * Water vapour (80%), Carbon dioxide, Sulphur dioxide
%%SECONDARY HAZARDS%%
- LAHARS: masses of rock, mud and water which travel down a volcano * Can be hundreds of metres wide, travel very quickly * Caused when ice or snow are melted by lava, or heavy rain erodes rock and soil
- JOKULHLAUP: sudden heavy floods * Snow and ice from glaciers is melted by the heat of the volcano, releasing vast amounts of water. This water collects rock, gravel, mud and ice and can cause huge floods which damage land and infrastructure, and cause death/injury
%%HOTSPOTS%%
A volcanic hotspot is where volcanoes form in the middle of plates, where plumes of magma rise up and erupt onto the sea floor. The plate moves above the plume which stays in the same place, meaning new volcanoes form, creating a volcanic chain.
}}SOCIAL AND ECONOMIC IMPACTS}}
%%MONTSERRAT%%
Part of an island arc in the Caribbean
16km long, 10km wide, entirely volcanic
18th July 1995, Soufriere Hills Volcano in the south of the island began to erupt
The eruption lasted 5 years
- Dozens lost their lives
- Over 7000 people moved from the island (over half the original population)
- The capital; Plymouth; was destroyed
- 2/3 of all houses and 3/4 of all infrastructure was destroyed
- Unemployment rose as there was no tourism industry left
- Farmland was destroyed or abandoned
- A top heavy population pyramid formed as older people could not move away from the island
The volcano is still active, 2/3 of the island is uninhabitable, and a volcanic observatory has been built. New infrastructure has also been build and there are plans to rebuild the tourism industry
%%MEASURING VOLCANIC ERUPTIONS%%
VOLCANIC EXPLOSIVITY INDEX (VEI) is used to compare the magnitude of volcanic eruptions. The scale is from 1-8 and each number increases the magnitude by a power of 10. The VEI measures:
- Amount and height of volcanic material ejected
- How long the eruption lasts
- Qualitative descriptive terms
%%PREDICTING ERUPTIONS%%
Equipment can be placed on volcanoes for monitoring, and remote equipment can also be used
- Small earthquakes (Seismometer) provide evidence of magma rising to the surface
- Changes in the surface of the volcano (tiltmeters) suggest volcanic swelling
- Changes in the tilt of the volcano (tiltmeters) suggest magma moving upwards
- Thermal imaging
- Gas collection/monitoring
Volcanic monitoring is not 100% accurate, and not all volcanoes are being monitored
}}%%TSUNAMI%%}}
%%FORMATION:%%
Most tsunami form due to underwater earthquakes (though they can also form from meteors, land collapse and volcanic eruptions). Displacement of the seafloor moves the water column above and causes tsunami waves to form. The waves range from 1 to 30m high
- Waves can travel up to 805km/hr
- The wave crest creates a vacuum effect at the shore, sucking out water and exposing the sea bed
TSUNAMI: a series of larger-than-normal waves which ted to be caused by tectonic events
%%IMPACTS%%
- Inland travel of many miles
- Washing away of soil, undermining of foundations for bridges, buildings and roads
- Changed landscapes e.g. destruction of small islands
- Most deaths from drowning, but some also caused by building collapse or collision with debris
- Water and food supplies can be contaminated with salt, sewage and bodies which can lead to spread of disease
%%PREDICTION%%
- As tsunami are caused by earthquakes they can’t be predicted, but early warning systems have been created to warn before a tsunami hits the coast
- DART systems are used to monitor changes in sea level and pressure via seabed sensors and surface buoys: DEEP OCEAN ASSESSMENT AND REPORTING OF TSUNAMI * A potential tsunami is detected and a message is sent to a a satellite * The satellite sends a message to a tsunami warning station where the data is modelled * The data shows the potential size and direction of the tsunami, allowing procedures to be assessed * The data can be used to provide an early warning to residents * There was no early warning system in 2004, it is likely there would have been fewer deaths if there had been. As a consequence, there was an Indian Ocean monitoring system operational by 2006 * Japan has the best earthquake and tsunami warning systems, but in 2011, the warning system underestimated the tsunami, so not everyone was evacuated or prepared
}}2004 BOXING DAY INDIAN OCEAN TSUNAMI}}
9.0-9.3 magnitude earthquake
Ocean floor moved by 15m
Waves at Banda Aceh hit 15 minutes after the earthquake and were 17m high
The Maldives experiences a 4m ocean swell
Nearly 300.000 died and 1.7 million were left homeless
The tsunami affected countries as far away as Africa directly, and countries as far away as Sweden indirectly due to the high number of tourist deaths due to it occurring during a holiday season
The effects of the earthquake were amplified as:
- The earthquake was very large
- The epicentre was close to dense coastal communities
- Low lying coastlines were at risk
- No early warning system was in place
- LIC’s with no tsunami protection resources were worst hit
- Mangrove forests in some areas (Sri Lanka) had been removed for tourist benefit, reducing the protection of the land
%%IMPACTS OF THE 2004 TSUNAMI%%
- Coastal settlements were damaged * 70% of villagers died in some areas * 1500 villages in Sumatra were destroyed
- Infrastructure was destroyed: Andaman and Nicobar islands were cut off
- Economies were devastated: fishing, tourism, agriculture * 60% of the Sri Lankan fishing fleet was lost * Thai tourism industry lost US$25 million per month, and 120.000 workers were unemployed
- Environmental damage * Ecosystems severely damaged * Vegetation and topsoil were removed up to 800m inland * Freshwater and agricultural soil were contaminated by salt
- US$10 billion economic costs
}}NATURAL HAZARD → DISASTER}}
disasters do not just happen - they result from failures of development , which increase vulnerability to hazard events
RISK (R) = HAZARD (H) x VULNERABILITY (V) / CAPACITY TO COPE (C)
}}HUMAN FACTORS, VULNERABILITY, RESILIENCE}}
Individuals and government affect how a county is prepared and able to cope with a hazard, through many methods, such as cost analysis and infrastructure investment
Level of development also affects vulnerability and resilience as in Haiti
}}Vulnerability and development}}
%%GOVERNANCE AND POLITICAL CONDITIONS%%
- Building codes and regulations
- Infrastructure
- Preparedness plans
- Emergency services
- Communication systems
- Public education and preparedness
- Corruption
%%ECONOMIC AND SOCIAL CONDITIONS%%
- Wealth
- Access to education
- Housing
- Healthcare
- Income opportunities
%%PHYSICAL AND ENVIRONMENT CONDITIONS%%
- Population density
- Urbanisation
%%CASE STUDIES%%
}}CONTEXT}}
%%GOVERNMENTS:%%
- Decide on planning laws
- Decide on disaster preparedness and planning investment
- Decide on financial management
Japan, China and Haiti all lie in tectonically active regions, making them vulnerable to earthquakes
HAITI: 7.0 magnitude, 316.000 deaths, developing country, 1.3 million homeless
CHINA: 7.9 magnitude, 87.150 deaths, emerging country, 5 million homeless
JAPAN: 9.0 magnitude 19.848 deaths, developed country, 130.927 homeless
}}HAITI: 12th January 2010}}
- North American and Caribbean plates
- Shallow focus: 13km
- Liquefaction
- Epicentre 24km from Port-au-Prince (the capital)
- Developing country: poor, resources spent on immediate issues such as disease
- High levels of corruption = no commitment to infrastructure and living improvements
- No building controls = slum housing which collapsed following the earthquake
- Dense urban environment made rescue efforts difficult
- Lack of disaster preparedness meant officials/emergency services didn’t know how to react
- Many people were living in poverty without resources to cope
%%IMPACTS%%
- One airport, several ports, few main roads: all became damaged, this stopped aid supplies from arriving and being fairly distributed
- 1/4 of government officials died and government buildings were destroyed/collapsed meaning paper records were lost
- An outbreak of cholera (still ongoing in 2016) killed over 9000 and affected over 720.000
%%RECOVERY%%
- US$13 billion of donated aid
- Concerns over corruption caused many international organisations to attempt to intervene, restricting Haiti’s future self sufficiency
- By 2015, 80.000 Haitians were still in temporary housing
- New buildings, roads and schools have been built
- Government attention to natural hazards is increasing
}}PRESSURE AND RELEASE MODEL}}
- PROCESSES THAT CREATE VULNERABILITY → HAZARD EVENT
- ASSESSMENT OF ROOT CAUSES, DYNAMIC PRESSURES AND UNSAFE CONDITIONS * PROGRESSION OF VULNERABILITY
}}CHINA: 12th may 2008}}
- Sichuan province
- 7.9 magnitude
- 45.5 million affected
- Over 5 million homeless
- 1/4 of deaths caused by landslides
- Corruption in government lead to ignorance of building codes and building collapse * 5335 children were killed when schools which didn’t follow building regulations collapsed
%%IMPACTS%%
- Damage concentrated in rural areas / small towns
- Wealthier than Haiti = rescue and aid efforts could be afforded
- Strong central government responded quickly to the disaster
- Over 130.000 soldiers and relief workers sent to the area * Troops parachuted or hiked into mountainous areas
- Medical services restored to avoid disease
- US$10 billion paid in rebuilding funds by governments
- Chinese banks cancelled the debt of survivors who didn’t hold insurance
- Temporary homes, roads and bridges were build within 2 weeks
%%RECOVERY%%
- A new city Yongchang moved 40.000 people * Cracks appeared in new homes meaning local officials were arrested
- Two years after: * 97% of planned 29.704 reconstruction projects had begun * 99% of 196.000 farmhouses had been rebuilt * 216 transport projects were under construction
}}JAPAN: 11th march 2011}}
- 9.0 magnitude
- Occurred in the Pacific Ocean 100km east of Sendai (Honshu island)
- Tsunami waves of up to 10 metres travelled up to 10km inland
- Fukushima Daiichi nuclear power plant was damaged and a 20km exclusion zone still exists
%%PREPARATION%%
- Good building construction * Strict building regulations: 75% of buildings constructed with aseismic / earthquake resilient engineering * Low level corruption = strict law / policy enforcement
- Well developed disaster plans * Vulnerable areas had 10m high walls, evacuation shelters and evacuation routes * Offices and homes had earthquake kits * Early warning system gave 1 minute notice
- Education and preparedness in schools and businesses
- Failure to assess impacts of tsunami on nuclear power plant
%%RESPONSE%%
- 111.000 defence troops mobilised in 24 hours
- All radio and TV stations switched to earthquake coverage
- US$183 billion offered by The Bank of Japan to Japanese banks so they could operate
- Help and rescue teams from 20 countries were quickly accepted and sent aid
%%JAPANESE ENERGY POLICY%%
- 27% of all energy came from nuclear energy, but after the tsunami all 44 nuclear reactors were shut down * This increased reliance on fossil fuels * Energy became 20% more expensive * Debt increased * Greenhouse gas emissions increased
- The government promised to reduce nuclear energy use, however performed a U-turn in 2014 when energy prices became too high. * The government announced that by 2030, 20-22% of Japan’s energy would be nuclear again * Demand for natural gas pushed up the price * The nuclear crisis caused Germany to close its nuclear power plants
}}A MORE HAZARDOUS WORLD?}}
Rate of geophysical rates have remained steady, the number of reported natural disasters has however risen, there are multiple reasons for this:
- Improvements in monitoring and recording events
- Improvements in communications technology
- Global population has risen, meaning more people live in hazardous locations
- Increase in occupied living space means more impermeable surfaces, causing flood risk to increase
%%CURRENT TRENDS%%
- HIC’s are better at coping with hazard events * Reduction in the death toll * Increase in economic cost
- The number of people being killed by natural disasters is falling as early warning systems and building codes have improved
- Between 1994 and 2013, the number of people dying in low income countries was three times higher than in high income countries
- The financial cost of disasters is rising as the world develops
%%HAZARD PROFILES%%
- A diagram to show characteristics of tectonic hazards: they can show one hazard, or multiple
- They help governments and organisations develop disaster plans
- They assess: * Magnitude * Speed of onset * Duration * Areal extent * Spatial predictability * Frequency
}}MULTIPLE HAZARD ZONES}}
- An area or country exposed to multiple hazards, including tectonic and hydrometeorological hazards
- It is important to identify areas in order to ensure regions can prepare for hazards
}}THE PHILIPPINES}}
One of the most disaster prone countries in the world
- Major convergent boundary
- North and east costs face Pacific Ocean
- Lies in South East Asia typhoon belt: affected by 15 per year, struck by 6-9
- Tropical monsoon climate = heavy rains
- 47 volcanoes, 22 of which are active
- Common landslides * 7107 islands: 25% bigger than the UK * 101 million population (2015) * GDP per capita (2014) of US$7000 * Mountainous landscape with coastal lowlands
%%VULNERABILITY%%
- Rapidly developing lower-middle income country = rapid urbanisation and high population density
- Many people in poverty live in coastal areas at risk of flooding, storm surges and tsunami
- 25% of population live in poverty
%%CHALLENGES IN MULTIPLE HAZARD ZONES%%
One hazard can increase likelihood / severity of other hazards
- 2006 * Earthquake kills 15, injures 100, destroys 800 buildings * Triggers a 3m tsunami * Triggers a landslide * Causes crater wall of a volcano to fall into a lake and wash away houses
- Different hazards happening close together can create a worse disaster: the area may not be fully recovered
}}HAZARD MANAGEMENT THEORETICAL MODELS}}
Hazard management refers to how governments and organisations work to protect people from natural hazards. The aim is to reduce or avoid loss of life and property, help those affected and aid rapid and effective recovery
HAZARD MANAGEMENT CYCLE
- Government
- International organisations
- Businesses
- Community groups
MITIGATION
- FOCUS: identifying potential natural hazards and taking steps to reduce the impact
- ACTIONS: zoning and land use: developing building codes, building resistant structures
- Occurs before and after hazards
PREPAREDNESS
- FOCUS: minimising loss of life and property, aid response and recovery
- ACTION: preparedness plans, early warning systems, evacuation routes, aid equipment and supplies, raising public awareness
- Occurs before hazards
RESPONSE
- FOCUS: coping with disaster, saving lives, protecting property
- ACTION: search and rescue, evacuation, critical infrastructure and services
- Occurs during hazards
RECOVERY
- Focus: short term and long term recovery
- Action: * SHORT-TERM: health and safety, power and water, transportation, financial assistance * LONG-TERM: rebuilding homes, rebuilding infrastructure, reopening business and school
- Occurs after hazard
%%PARK MODEL : HAZARD RESPONSE CURVE%%
A model used to show how a country or region may recover from a hazard event
- Impacts of a hazard over time depend on factors such as the size of hazard, development and aid
- All hazards have different impacts, so curves vary
- Wealthier countries have different curves to developing countries
- Hazard events that affect multiple countries: each country has it’s own curve * Relief (hours-days), rehabilitation (days-weeks), reconstruction (weeks-years)
%%MANAGING HAZARD EVENTS%%
Sudden, unpredictable onset of tectonic hazards makes hazard management important for protecting communities
- Mitigation: strategies to avoid, delay or prevent hazard events
- Adaptation: strategies to reduce impacts of hazard events
}}GOVERNMENT HAZARD MITIGATION}}
%%LAND USE ZONING%%
- Local government planners regulate how land is used. Effective for protecting people and property. Areas are divided into zones based on the likely level of damage were a hazard to occur * In areas at risk: * Settlement is limited * Certain structures/facilities are prohibited * Some communities are resettled * Development in areas which provide natural protection is limited * Common use in wealthier countries
%%DIVERTING LAVA FLOWS%%
- Historically multiple methods have been used, but have been ineffective * Path of lava is hard to predict * Terrain has to fit the method being used * Stopping lava reaching one area causes other areas to be affected
%%GIS MAPPING%%
- Can be used at all stages of management to identify evacuation routes and help rescue and recovery
- Shows locations of populations in towns and cities, areas effected by disasters, airports and airstrips to help aid agencies identify the areas most affected and provide aid
%%HAZARD-RESISTANT DESIGN AND ENGINEERING%%
- New buildings or structures are designed to resist ground shaking
- Roofs of houses near volcanoes are sloped to reduce ash build up
- Buildings at risk from tsunami are anchored or elevated
- Existing buildings are modified
- Protective structures are built * Made by engineers * Not all are expensive and high-tech * Rolling weights on roof * Panels of marble and glass flexibly anchored * Reinforced lift * Birdcage interlocking frame * Reinforced foundations * Rubber shock absorbers
}}HAZARD ADAPTATION STRATEGIES}}
%%HIGH TECH MONITORING%%
- Technology plays an important role in helping communities and individuals become less vulnerable. Tech monitoring allows scientists to learn about natural processes and advance prediction * GIS mapping: hazard maps and management of hazards * Early warning systems: use of scientific instruments to detect signs that an event is going to occur, and warn a community * Satellite-communication technology: transmission of data from monitoring equipment e.g. DART monitoring * Mobile phone technology: used to communicate rapid warnings and coordinate preparation activities
%%CRISIS MAPPING%%
- ULSHAHIDI: an online resource allowing the creation of an interactive map * In Haiti, local people provided information about where supplies or rescue efforts were needed. The locations were plotted onto maps to aid rescue efforts * Uses crowd source information as well as other mapping + statistical models to map areas struck by disasters * Modelling hazard impact * Allows scientists to predict impacts of hazards
%%PUBLIC EDUCATION%%
- Good education and public awareness can reduce vulnerability and prevent hazards from becoming disasters. It helps people understand how to protect themselves * Regular practice of emergency procedures: in Japan, children practice earthquake drills four times a year * Encouraging households and workplaces to create emergency preparedness kits * Providing education materials such as information on building construction
%%COMMUNITY PREPAREDNESS AND ADAPTATION%%
- Community based preparedness is becoming an increasingly important part of hazard management. People living in at risk areas are best placed to develop suitable preparedness plans and educate locals: this is vital in LIC’s
- Local knowledge is important in community disaster preparedness, such as the 2004 Indian Ocean tsunami, when members of a small community of fisherman noticed unusual movements in the Bay of Bengal and ordered villagers to run to the hilltop, as a result, only one villager died
- These efforts are most effective when formalised to be ongoing and coordinated * List of vulnerable people * Organising practice evacuations * Providing first-aid courses
}}KEY PLAYERS IN MANAGING LOSS}}
%%AID DONORS%%
- Most countries need some sort of aid to help recovery * EMERGENCY AID: food, clean water, shelter * SHORT-TERM AID: restoring water supplies, providing temporary shelter * LONG-TERM AID: reconstructing buildings and infrastructure, redeveloping the economy, managing programmes to reduce impact of future disasters
- Cash, personnel, services, equipment
- Distributed straight to government, or to aid agencies or foreign governments
- Many organisations provide aid, such as governments, intergovernmental organisations and NGO’s
%%NON-GOVERNMENTAL ORGANISATIONS%%
- NGO’s play a vital role in disaster management, especially where local governments are struggling to respond to a hazard or lack of resources. They provide funds, help with search and rescue, and help reconstruction plans. Many NGOs can be involved in all stages of the hazard management cycle
}}CASE STUDY: NGO’S AND THE 2005 PAKISTAN EARTHQUAKE}}
- 8th October 2005
- 7.6 magnitude
- 73.000 deaths, 17.000 children
- 128.300 injured
- 3.5 million homeless
- Roads, water facilities, communication destroyed
- Largely mountainous areas made search and rescue more difficult
%%NGO RESPONSE%%
- 500.000 tents, 6 million blankets
- Safe water for over 700.000
- Food and clothing
- Emergency medical care
- Permanent shelters
- Water supplies re-established
- Roads damaged were rebuilt * Over the following year, NGOs continued to assist giving seeds and tools so families could grow their own food again. in 2007, NGOs moved to the recovery phase, building new schools, medical centres, and homes, and developed community based disaster risk reduction schemes
%%INSURANCE%%
- Natural disasters are expensive and economic costs are rising * In 2011, worldwide losses from earthquakes were US$54 billion
- Insurance can help communities recover from disasters and provide individuals and businesses with money to repair and rebuild, however in many places, people don’t have insurance for tectonic hazards as they experience more pressing economic needs
%%COMMUNITIES%%
- Following a disaster, local people are the first people who respond * They are crucial for search and rescue efforts * Locals have to start recovery processes in remote/isolated places * Community groups can be involved in long term strategies for rebuilding and improving resilience
\