Microeconomics - Unit 2
Introduction
Understanding the basic workings of demand and supply and their role in equilibrating the market is essential in microeconomic analysis. In this module, you will explore the role of demand and supply in establishing a market clearing price and producing a socially optimal outcome in a competitive market. In addition, you will analyze the resulting inefficiencies in markets when outside forces act to impede the natural market mechanisms.
Essential Questions:
How does price act as an incentive to consumers, according to the Law of Demand?
How does price act as an incentive to suppliers, according to the Law of Supply?
What is the underlying difference between a "change in demand/change in supply" and a "change in quantity demanded/change in quantity supplied?"
What are the d
Determinants of demand and supply and how do changes impact the market equilibrium?
How is a consumer brought into equilibrium through maximizing utility given a budget constraint? How does a competitive, free market maximize total welfare to society?
What are consumer and producer surplus? What is meant by Pareto efficiency?
How is total welfare in a market impacted by operating in a position other than Pareto efficiency? How do price ceilings, price floors, and quotas impact the allocative efficiency of a market?
Demand
Demand Defined
What is Demand?
Demand is the different quantities of goods that consumers are willing and able to buy at different prices. (Ex: You are able to purchase diapers, but if you aren't willing to buy them then there is NO demand).
What is the Law of Demand?
There is an INVERSE relationship between price and quantity demanded.
The Law of Demand states that price and quantity demanded have an inverse (negative or indirect) relationship. This means price and quantity demanded move in opposite directions. As the price of a good rises (or falls), the quantity demanded will fall (or rise), ceteris paribus. Due to this relationship between price and quantity demanded, demand curves will typically be downward sloping (or negatively sloped).
Why does the Law of Demand occur?
The law of demand is the result of three separate behavior patterns that overlap:
The Substitution effect
If the price goes up for a product, consumer buy less of that product and more of another substitute product (and vice versa
The Substitution Effect of a price change: If the price of gas falls, it becomes relatively cheaper compared to other fuel sources. Consumers will substitute more gas in the place of other fuels. Please note: this is a relative change – gas is not necessarily cheaper than other fuel sources, only relatively cheaper.
The Income Effect
If the price goes down for a product, the purchasing power increases for consumer - allowing them to purchase more.
The Income Effect of a price change: If the price of gas falls, the consumer's real income (purchasing power) increases. With a given amount of income, a consumer can now buy more gas. Please note: the actual income of the consumer did not change, only its purchasing power.
The Law of Diminishing Marginal Utility
Utility = Satisfaction
We buy goods because we get utility from them
The law of diminishing marginal utility states that as you consume anything, the additional satisfaction that you will receive will eventually start to decrease.
In other words, the more you buy of ANY GOOD the less satisfaction you get from each new unit consumed.
The Demand Curve
A demand curve is a graphical representation of a demand schedule.
The demand curve is downward sloping, showing the inverse relationship between price (on the y-axis) and quantity demanded (on the x-axis).
When reading a demand curve, assume all outside factors, such as income, are held constant. (This is called ceteris paribus)
Shifts in Demand
Ceteris paribus-"all other things held constant."
When the ceteris paribus assumption is dropped, movement no longer occurs along the demand curve. Rather, the entire demand curve shifts.
A shift means that at the same prices, more people are willing and able to purchase that good.
This is a change in demand, not a change in quantity demanded!
PRICE DOESN'T SHIFT THE CURVE
Change in Demand (ΔD)
A change in demand occurs because of a change in one of the determinants of demand listed above. It is shown graphically by a shift of the entire demand curve. If demand increases, the original demand curve will be replaced by a demand curve located to the right of the original (the original curve experienced a rightward shift). If demand decreases, the original demand curve will be replaced by a demand curve located to the left of the original (the original curve experienced a leftward shift). It is appropriate to use "right" and "left" to categorize these shifts because demand is measured on the x-axis and numbers get larger as you head to the right on the x-axis and smaller as you head to the left on the x-axis.
What Causes a Shift in Demand?
The determinants of demand include all those other factors, unrelated to the price of a good or service, which influence how much of a good people buy. Below are the basic categories for the determinants of demand:
There are 5 Shifters (Determinants) of Demand:
Tastes and Preferences: This determinant explains how increases and decreases in popularity impact the demand for a good.
Number of Consumers: As the number of consumers increases, the demand for the good or service they desire increases. The opposite is also true
Price of Related Goods: Substitutes are goods and services that can be used in place of one another. A positive relationship exists between the demand for a good and the price of the good's substitute. Complements are goods and services used in conjunction with one another. A negative relationship exists between the demand for a good and the price of the good's complement.
Income: For normal goods, income and demand are positively related. That means, as income increases, the demand for the good increases. Of course, the opposite is true also. For inferior goods, income and demand are negatively related. That means, as income increases, the demand for the inferior good will decrease.
Future Expectations: If consumers believe the price will be higher in the future, they will buy more today. If consumers believe the price will be lower in the future, they will buy less today.
A change in PRICE doesn't shift the curve. It only causes movement along the curve.
Prices of Related Goods
The demand curve for one good can be affected by a
change in the price of ANOTHER related good.
Substitutes are goods used in place of one another.
Ex: If price of Pepsi falls, demand for coke will...
If the price of one increases, the demand for the other will increase (or vice versa).
Complements are two goods that are bought and used together.
Ex: If price of hot dogs falls, demand for hot dog buns will...
If the price of one increase, the demand for the other will fall (or vice versa).
Income
The incomes of consumer change the demand, but how depends on the type of good.
Normal Goods
Ex: New cars, seafood, jewelry, homes
As income increases, demand increases
As income falls, demand falls
Inferior Goods
Ex: Top Ramen, used cars, used clothes
As income increases, demand falls
As income falls, demand increases
Supply
Supply Defined
What is supply?
Supply is the different quantities of a good that sellers are willing and able to sell (produce) at different prices.
What is the Law of Supply?
There is a DIRECT (or positive) relationship between price and quantity supplied.
As price increases, the quantity producers make increases.
As price falls, the quantity producers make falls. Why? Because, at higher prices profit seeking firms have an incentive to produce more.
When shifting supply, an increase will always shift the curve right and a decrease will always shift the curve left. This applies to both supply and demand. When drawing these shifts it's best to draw arrows that point left and right rather than up and down.
5 Shifters (Determinants) of Supply
The determinants of supply include all those other factors, unrelated to the price of a good or service, which influence how much of a good suppliers will offer for sale. Below are the basic categories for the determinants of supply:
Prices/Availability of Inputs (resources): As inputs become more expensive, suppliers will offer up less of a good/service for sale. The opposite is true.
Number of Sellers: An increase in the number of suppliers will increase the supply of a good. The opposite is also true.
Technology: Improvements in technology will tend to increase supply.
Government Action - Taxes & Subsidies: Taxes, if per unit, will decrease supply. Subsidies, if per unit, will increase supply.
A subsidy is a government payment to a business or market.
Subsidies cause the supply of a good to increase.
Expectations of Future Profit: If suppliers believe the price will be higher in the future, they will supply less today. If suppliers believe the price will be lower in the future, they will supply more today
Productivity: Increases in productivity will increase supply. The opposite is also true.
Example: Some of the determinants of the supply of gas include the wages paid to workers in the industry, the cost of refineries, and government regulations (quality of fuel).
A change in PRICE doesn't shift the curve. It only causes a movement along the curve.
Law of Supply
The Law of Supply states that price and quantity supplied have a positive (or direct) relationship. This means price and quantity supplied move in the same direction. As the price of a good rises (or falls), the quantity supplied will rise (or fall), ceteris paribus. Due to this relationship between price and quantity supplied, supply curves will typically be upward sloping (positively sloped).
Quantity Supplied (QS) - The amount of a good that producers are willing to offer for sale at a particular price of the good. 
Change in Quantity Supplied (ΔQS) - This phrase denotes a change in the number of units suppliers wish to sell in response to a change in price only. It is shown graphically by a movement along the existing supply curve.
Change in Supply (ΔS)
A change in supply occurs because of a change in one of the determinants of supply listed above. It is shown graphically by a shift of the entire supply curve. If supply increases, the original supply curve will be replaced by a supply curve located to the right of the original (the original curve experienced a rightward shift). If supply decreases, the original supply curve will be replaced by a supply curve located to the left of the original (the original curve experienced a leftward shift). It is appropriate to use "right" and "left" to categorize these shifts because supply is measured on the x-axis and numbers get larger as you head to the right on the x-axis and smaller as you head to the left on the x-axis.
Example: Suppose the price of crude oil decreases. This will make it less expensive to produce a gallon of gas. Suppliers will tend to offer more gallons of gas on the market at any given price.
Elasticity
The Law of Demand says... Consumers will buy more when prices go down and less when prices go up Elasticity is about determining how much more or how much less. Elasticity is the measurement of how quantity responds to price changes.
Demand
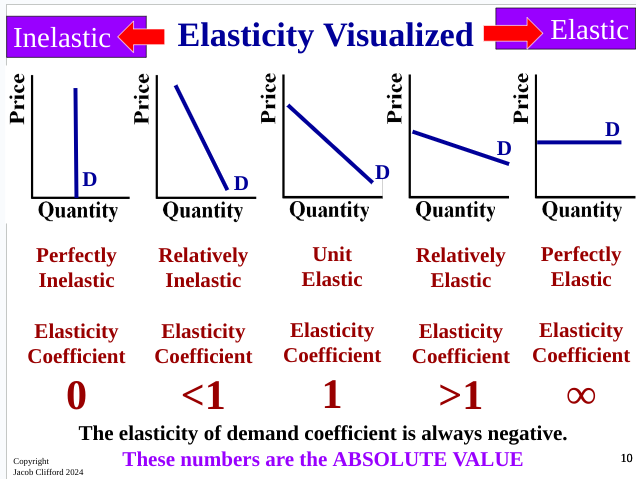
Inelastic Demand
INelastic Demand= Quantity is INsensitive to a change in price.
If price increases, quantity demanded will fall a little
If price decreases, quantity demanded increases a little.
In other words, people will continue to buy it regardless of price changes.
An INELASTIC demand curve is steep! (looks like an I)
General Characteristics of INelastic Goods:
Few Substitutes
Necessities
Small portion of income
Required now, rather than later
Elasticity coefficient less than 1
People will buy the product regardless of price so price drops result in lower total revenue
% Δin quantity / %Δin price
Elastic Demand
Elastic Demand = Quantity is sensitive to a change in price.
If price increases, quantity demanded will fall a lot
If price decreases, quantity demanded increases a lot.
In other words, the amount people buy is sensitive to price.
An ELASTIC demand curve is flat!
General Characteristics of Elastic Goods:
Many Substitutes
Luxuries
Large portion of income
Plenty of time to decide
Elasticity coefficient greater than 1
% Δin quantity / %Δin price
Total Revenue Test
Uses elasticity to show how changes in price will affect total revenue (TR).
Ex: If the demand for gas is inelastic, what will happen to total revenue for gas stations if price increases?
Inelastic Demand-
Price increase causes TR to increase
Price decrease causes TR to decrease
Elastic Demand-
Price increase causes TR to decrease
Price decrease causes TR to increase
Unit Elastic-
Price changes and TR remains unchanged