Natures chemistry flashcards
Biodiversity
Ecosystem diversity
The variation in
habitats - where organisms live
living communities - all the organisms that live there
ecological processes in an area - biochemistry (e.g. photosynthesis), interactions (e.g. decomposition)
Genetic diversity
The range of different genetic characteristics found in a population.
Species diversity
The range of different species found in an area.
species richness = the number of different species in an area
relative abundance = how common or rare a species is in comparison to other species in the area (% of the total numbers)
The area with a dominant species has a lower species diversity.
Qualitative techniques
Rules for making a key
Use visible features that are descriptions e.g. flower colour, number of petals not length of petal
Each statement gives a choice between versions of the same feature e.g. red flower v white flower not red flower v five petals
be systematic, work your way through one group with the first questions then go back to question 1 and work your way through the rest
Quantitative techniques
abundance - DAFOR scale (dominant, abundant, frequent, occasional, rare)
percentage cover - the percentage of area covered by the species
density - mean number of individuals per unit area
frequency - percentage of sample units that contain the species
Distribution patterns:
Uniform distribution - rarely found organisms competing for scarce resources e.g. lugworms on beach
Random distribution - sometimes found, caused by random arrival or organisms e.g. dandelions on a lawn

Clumped distribution - most common, caused by patchy spread of resources e.g. nettles in a woodland
 Quantitative techniques (biotic indices)
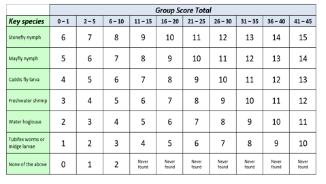
Trent Biotic Index
Used to identify the highest indicator species in the key species column
15 = diverse and clean
0 = dead river
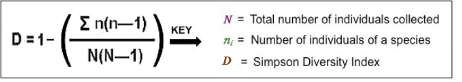
Simpson’s Biodiversity Index
Calculates a number for species diversity, formula takes account of species richness and relative abundance. Index gives values between 0 and 1 (0=no diversity, 1=infinite diversity)
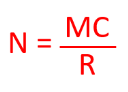
Lincoln Index - capture-mark-recapture
Sample of population is captured and marked (M), marked organisms are released again and the population is left for an interval of time. Then a second sample is captured (C) some of these individuals are recaptures (R)
 Sampling techniques
using quadrats
for abundance and percentage cover judge how much the quadrat area is filled.
for density and frequency you have to work out if the organism is in the score so that it is not counted twice in different samples. Any on the L edges get counted as being in.
 using transect lines
point transect - record what is found at regular intervals along the line e.g. every 100cm
line transect - record what the line touches and where
belt transect - use quadrats along beside the line
capture-mark-recapture features
population lives in a finite are. no immigration/emigration or births/deaths during the study
individuals captured using multiple traps that are placed randomly, individuals are then released
sufficient time between first capture to allow mixing of population
traps are repositioned in the same locations. marked and unmarked individuals found in the traps are counted
Lincoln index used to estimate population
Invasive sampling
gathering data by capturing individual animals
problem = animal could be harmed by trapping and handling however may be the only way to get data
Non-invasive sampling
data collected without contact with the animal. can use sign surveys, camera trapping or DNA extraction from scats and hair
Design and data
getting reliable results, one sample wont give the full picture so need to use many samples. reliable data sets have a small range and small standard deviation.
getting valid results, sampling needs to be unbiased and fair with no human influence, data collected randomly or systematically.
sampling strategies
simple random - each individual has an equal chance of being selected, independent of the presence of others selection by using random number tables.

systematic - starting point is randomly chose then habitat is sampled in regular pattern

stratified random - random samples taken in each area, number of samples is proportional to size of area

types of average:
mean - add them up and divide by how many there are
median - put them in order and choose the middle one
mode - the most common value
measures of spread:
lower quartile = value that is ¼ way along the rank order of data
upper quartile = value that is ¾ way along the rank order of the data
interquartile range = data between the upper and lower quartiles
standard deviation, a figure that shows how much the data spreads around the mean value.
Abiotic factors
non-living factors that affect the distribution of an organism (e.g. light intensity, soil moisture content, soil pH, soil temperature)
ecological niche = role played by a species in the ecosystem (what it eats, what eats it, where it lives)
each species can only thrive in a limited range of conditions e.g. temperature, soil pH, dissolved oxygen.
so abiotic factors will affect the distribution (nettles caused by increased phosphate in soil(pee)) of a species and its frequency in an area.
Measuring aquatic abiotic factors
Measuring terrestrial abiotic factors
Energy transfer
Energy is lost as it is used by organisms so energy input has to be constant to maintain life in the ecosystem. Energy from sunlight is the input for most ecosystems.
trophic level = feeding level in a food web, occupied by organisms with a similar feeding mode (e.g. herbivores)
autotrophs (producers) = organisms at the start of the food web, green plants able to produce their own food by photosynthesis, the process that converts light energy into chemical energy.
heterotrophs (consumers) = gain energy by ingesting material from other organisms (alive or dead)
saprotrophs = group of heterotrophs that feed on dead organisms or waste material
detritivores = type of saprotroph that gains energy by internal digestion of dead organic matter e.g. earthworm, blowfly, maggot
decomposer = type of saprotroph that gains energy by external digestion of dead organic matter e.g. bacteria and fungi
GPP/NPP
gross primary productivity = rate of production of biomass by autotrophs in a given area over a time period
net primary productivity = rate of accumulation of biomass by autotrophs after respiration in a given area over a time period
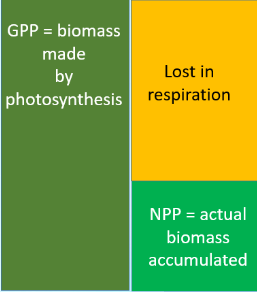 biomass accumulated = total biomass produced - losses from respiration
 measured as increase in dry biomass per unit area per unit of time (e.g. kg/ha/year)
Ecological efficiency
nutrients taken in from outside can be
1. used for growth = available for other heterotrophs in the food chain
2. used for respiration so energy is lost from ecosystem as movement and heat
3. passed out as indigestible waste = a food source for detritovores and decomposers
primary productivity = production of biomass by autotrophs
secondary productivity = production of biomass by heterotrophs
using nutrients that have been assimilated = converted into a useful form that can be used for growth of animal tissues
ecological efficiency = percentage of the total biomass available in one trophic level that is converted to new biomass in the next trophic level
ecological efficiency means that biomass reduces at each trophic level so food chains are limited to 4 or 5 levels
Endotherms and Ectotherms
Density independent factors
Density dependent factors
Competition
Population growth
Succession
Succession is a predictable series of changes to the communities of plants present in an area over a long period of time. it starts with a pioneer community and leads to a climax community, in between there are seral stages = a series of short term stable communities. the climax community is the final, long term stable community.
types of succession:
primary succession = starts on bare rock or sand and forms new soil
secondary succession = sequence that recolonises existing soil
Pioneer species colonise, these species are adapted to need few nutrients.
each community changes the edaphic soil conditions. new conditions become more suited for the next community of plants so new plants out complete the earlier ones.
Factors affecting succession
climate = different conditions (e.g. temperature, rainfall) will affect which plant species can live in the area
edaphic = different soil conditions (e.g. soil pH, soil type) affect which plant species can live in the area
biotic = grazing animals will slow (or even stop) the progress of the succession
Human influences
Habitat loss
clearing of habitats usually by anthropogenic causes (e.g. agriculture)
many species become locally extinct so huge reduction in biodiversity.
natural habitat is lost so many niches are lost and the area no longer supports the original species and community
clearing land for agriculture often leads to habitat fragmentation = reduction of a large habitat area into smaller, scattered remnants.
overall effects:
reduction in the total area of wild habitat
reduction in the average size of each patch of wild habitat
isolation of fragments
biodiversity is affected at all levels. habitat fragments have lower ecosystem diversity so this leads to lower species diversity. individuals cannot move between fragments to find mates, this leads to interbreeding in the fragment so genetic diversity decreases.
keystone species = species which other species in an ecosystem largely depend on (e.g. beaver, scots pine, wolf) loss of keystone species has a disproportionate impact on biodiversity in an ecosystem.
Rewilding
rewilding involves activities that initiate or accelerate the recovery of habitats or ecosystems aiming to restore the health, integrity and sustainability of the ecosystem.
Reintroduce native species that have become locally extinct especially important to reintroduce keystone species e.g. beaver
Create habitat corridors to link habitat fragments and to reduce interbreeding.
reforestation = plant new trees in an area using local native species
removal of non-native species e.g. Sitka spruce and removal of invasive species e.g. Rhododendron ponticum.
Reintroduction of nationally extinct species
Harvesting practices
overharvesting a resource to the point where it can no longer naturally replenish the population level.
fishing quotas = sustainable harvesting
limits on over exploitation so allows time for the population to replenish and also reduces impacts on the wider habitat and other species so helps to increase the biodiversity of the area
Types of pollution
point pollution = discharged from a single location e.g. a pipe, a chimney, car exhaust each case may be minor but can combine to form diffuse pollution and so have a significant environmental impact
examples
air - chemical plant releasing smoke from a chimney
land - fly-tipping of rubbish
water - sewage overflow pipes
diffuse pollution = pollution from land use activities spread across large areas with no specific point of discharge
examples
run-off of salts and oils from tarmac (urban areas, roads)
run-off of fertiliser or pesticides from farmland
Plagioclimax
plagioclimax is a stable plant community maintained by persistent human interference such as burning or grazing e.g. grouse moors.
the natural succession process has been restricted. this allows early and later seral communities to co-exist so local biodiversity will be increased.
heather moorland plagioclimax managed for benefit of red grouse (for game shooting). muirburn prevents climax community of pine and birch.
periodic burning of small area - heather regenerates producing new growth and is a good food source for grouse
areas of older heather leave good nest sites and are a goof cover from predators
new burnt areas opens up soil and other plants can colonise, short term this increases niches so increases biodiversity.
a plagioclimax of wildflower grazing meadows, grazing by sheep or cattle limited to a few months each year which means in maintains a large biodiversity.
Conservation
protecting wildlife sites
targeting action on priority species and habitats
embedding consideration of biodiversity in policy and government decision making
engaging people and encouraging behaviour change
Using environmental assessments
environmental monitoring = activities carried out to characterise the quality of an environment over a period of time
environmental assessment = estimating and evaluating the short term and long term effects of a project on the quality of an environment
aims of an EIA (environmental impact assessment)
to protect the environment by ensuring that a local planning authority has full knowledge of possible significant environmental effects of a proposed development and mitigation for these and takes these into account in the decision making process
Aims of an SEA (strategic environmental assessment)
aims to provide a high level of protection of the environment from development, it is mandatory for plans which relate to large-scale changes in land use
Hydrographs
surface run off is faster if the group is sloped or on non-absorbing surfaces e.g. concrete/dry soil.
groundwater and soil water faster effect on river if groundwater is at high levels so water just flows over and is not held by soil.
Scottish environmental agencies
Nature Scot
Scottish Environment protection agency (SEPA)
Forestry and Land Scotland
Scottish forestry
Marine Scotland
Roles common to all these agencies
enforcing legislation
advising a range of groups such as Scottish government ministers, local authority planners, land owners, land managers, land users, voluntary organisations
shaping national policies
educating the public
scientific research and monitoring
Implementation of government policy
policy = a plan of action that focusses on a specific target e.g. policy to increase biodiversity
strategy = methods needed to achieve the policy goals e.g. increase planting of native trees
legislation = laws passed by government to achieve policy e.g. new forestry to include 20% native trees
initiative = action to help to achieve the policy goal e.g. grants for planting native forest areas
Composition of soil
mineral particles in the soil are from weathering and disintegration of rocks. Organic matter from decomposition of plants and animals.
Water and air fill the pore spaces and gaps between solid particles. this water comes from precipitation or translocation.
Macro-organisms = worms and insects
Micro-organisms = bacteria and fungi
Formation of soil
Weathering breaks up rocks at the Earth’s surface over long period of time
physical = water erosion, freeze fracture
chemical = acidic water dissolves rock
biological = lichens break up rock surface
decomposition = microbial action breaking down organisms into smaller chemicals, adds these chemicals to the simple mineral soil
humification = process that converts the organic matter (e.g. leaves) into humus
humus = dark organic material with no recognizable parts of the plants
translocation = movement of water or materials in soil
processes-
leaching - movement of dissolved chemicals with the water as it percolates through the soil e.g. nitrates leach with water from farmland
eluviation - downwards movement of dissolved chemicals with the water as it percolates through the soil from upper to lower horizons e.g. iron eluviates down in podzols.
illuviation - depositing chemicals into lower horizons e.g. iron is illuviated in the lower horizon
capillary action - movement of water from wet areas to dry areas through pore spaces between particles, water can go up or down in the soil and can move salts upwards from groundwater to the surface
Inputs affecting soil formation
the bed rock underlying the soil breaks down to form the mineral content of soil. the limestone side of valleys form alkaline soil, the sandstone side of valleys forms acidic soil
organisms - effect of vegetation, animals and microbes form humus in soil during primary succession
relief - slopes have run-off of water so top soil is eroded away and leads to a shallow soil layer. flat plains receive water, humus and minerals from run off so soil is richer and more fertile
climate - colder temperatures slow down soil formation, microbial decomposition of dead matter slows down so humus is not produced as quickly. more rainfall increases percolation of water through the soil which causes leaching of minerals down through the soil.
time - mature soils take thousands of years to form.
Soil structure
smaller particles pack closer together so leave smaller pore spaces. particle size largest to smallest is sand —> silt —> clay.
soils with lots of sand will feel gritty, as there are large particles so pore spaces are large