W5: Positron-emission tomography (PET)
Topic 1: Introduction to positron emission tomography (PET)
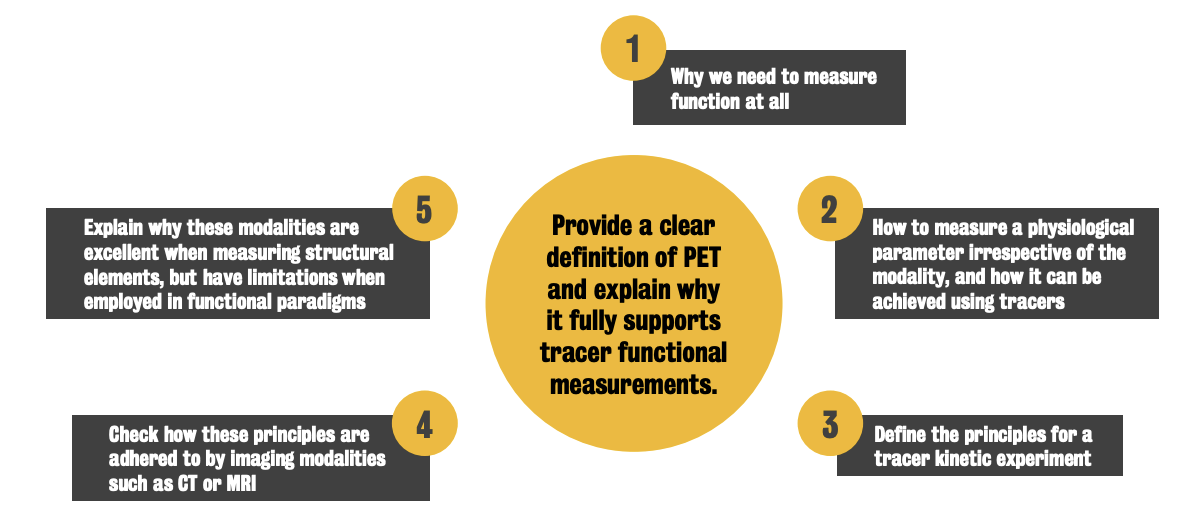
The rationale behind measuring brain function in mental health lies in:
Brain disorders may not necessarily show structural deficits
E.g., addiction does not generally demonstrate any specific structural brain changes
Timing — functional changes may precede anatomical changes
E.g., In the case of AD, ApoE4 carriers (who have an elevated risk for the disease) demonstrate changes in blood flow that proceed clinically overt symptoms by ~20 years
Functional measurements allow for the understanding of the pathological mechanisms involved in the disease & direct the development of treatments
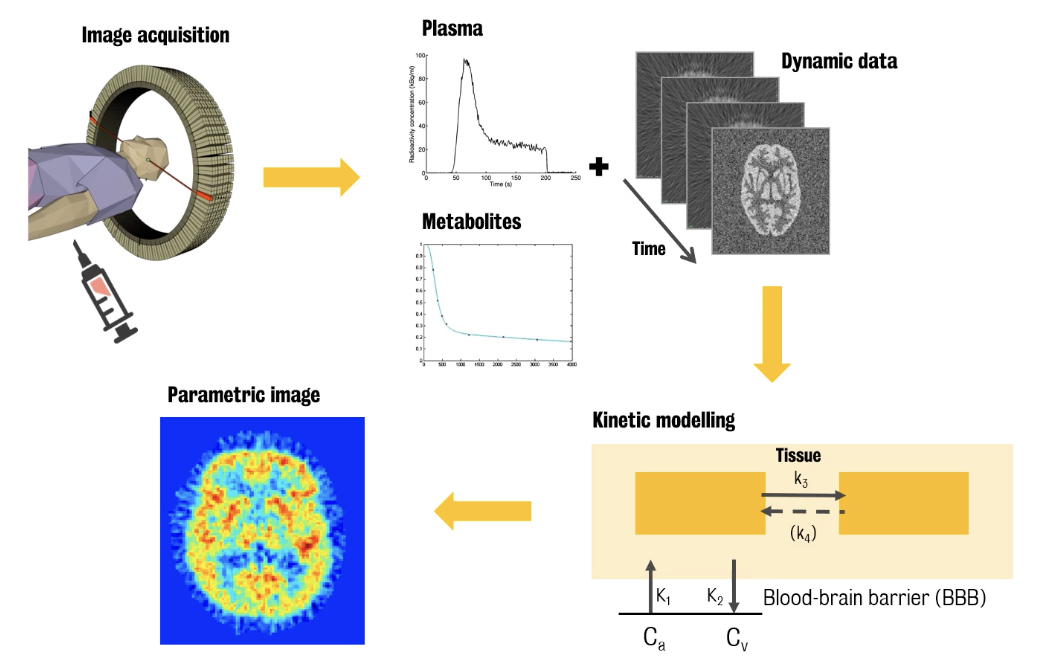
Functional measurements can be created using a tracer.
Tracer are small wet drops with biochemical properties that allows it to move around body compartments at certain rates.
Compartments can be distinct physical tissues (e.g. blood, extravascular space, cells) or distinct chemical states (e.g., original compounds, its phosphorylated metabolite)
Transfer rates across compartments = physiological parameters
Perfusion or enzymatic rates
Speed by which a tracer gets stuck on a target, the target density or affinity can be derived from these rates
Three (3) strict requirements for tracer measurements:
Must be a drop —- i.e., small mass that doesn’t affect the system
Must move between compartments in well-defined way — tracers are not used to explore systems we don't know, only to calculate rates between compartments.
Presence of instrumentation able to measure the concentration of this drop through time
A typical tracer is generally made of two (2) components:
A substrate = biological element of interest (i.e., possess biological properties being traced)
A label, which emits a signal allowing the measurement of the tracer
To use CT scanners with tracers, X-ray opaque labelled molecules — e.g., iodine — would be needed. MRI would require gadolinium.
Limitations:
Molecules like iodine and gadolinium are quite big, and change the biochemical properties of the substrates they are attached to.
These molecules do not cross the blood brain barrier.
Amount of tracer will have to be substantial to be detected over and above the water proton signal + will interfere with targeted system
MRI is not quantitative (🚫 straightforward translation of MRI images → images of tracer concentration)
:. CT and MRI do not adhere to the 1st and 3rd principles of tracer measurements.
PET uses positron emitters such as 15O, 11C, 17F, as labels
Advantages of PET:
High energetic — i.e., only tiny amounts of label are necessary
Positron emitters are natural molecules that can be directly incorporated into the substrate.
Built to allow accurate quantification of radioactivity concentration in the image & the blood
Designed to accurately fit the three (3) tracer principles
Part 2:
The production of the tracer is done in two (2) parts:
Radioisotope is produced
Radioisotope is attached to the substrate
Dirac’s prediction:
The 1st experimental verification of the positron was by Carl Anderson. Discoveries:
Positron can be emitted by proton-rich nuclei
When released by decay, the positron travels a distance and then annihilates with an electron, generating two gamma rays (511 keV) traveling in opposite directions
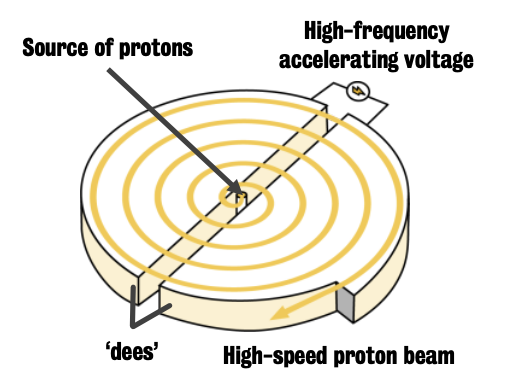
Cyclotron = particle accelerator used in PET centres
Particle (e.g., ion, positron) is injected into the central space.
Two halves of cyclotron have opposite charge, which is alternated so that the particle is accelerated and it starts rotating until it reaches the expected energy.
Particle is then shot into a target, which is a lead shielded container filled with gas
Different targets exist based on different needs.
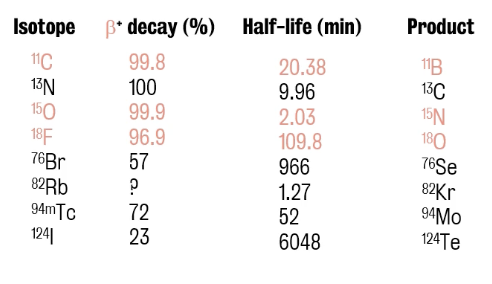
β+decay represents the percentage (%) of decay by positron emission
Note: For isotopes with short half-lives (e.g., 15O, 11C), cyclotron has to be located near the PET scanners while isotopes with longer half-lives can instead be shipped to PET scanners in other locations
⭐️ Half-life of an isotope = time it takes for half of the radioactive atoms in a sample to decay.
Radiotracers are need to be specific to the target and do not bind to anything else.
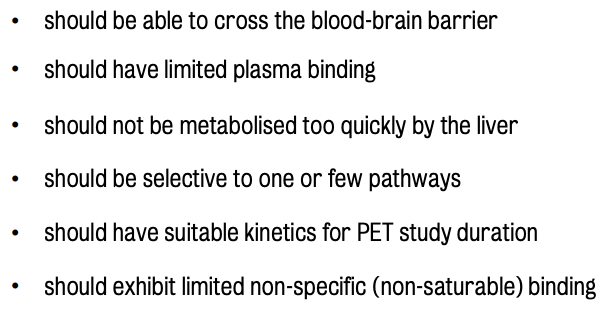
Suitable kinetics refers to radiotracer’s ability to get to the target and exit in the experimental time (max 2 hrs).
Example: 11C-Ro15-4513, a drug that can be used as an antidote to the acute impairment caused by alcohol
:. it was a bad drug (i.e., it quickly exited the brain), but an excellent PET tracer to measure GABA function, as in one hour, the tracer could track the whole path.
PET scanners use timing circuits to detect gammas coming from the same annihilation.
If two gammas are detected in less than nanoseconds, they are paired.
Three (3) problems of gamma detection that require corrections:
Attenuation: the loss of gamma photon intensity as gamma is absorbed through tissues
Corrected by building an attenuation map before tracer injection
Attenuation map can be obtained using rotating gamma sources or from CT/MRI maps
Scattering: Gammas s interact with matter and change direction, creating a false echo.
Necessitates correction to isolate true signals.
Correction made using attenuation maps to simulate scatter profile
Random events: Occur when two unrelated gammas are detected in the same time-window and erroneously coupled, which can skew results.
Correction achieved by simulation by artificially scrambling events collected during acquisition
Two (2) methods to reconstruct images from projections (i.e., detection of two gammas that originated from the same positron annihilations):
Filtered back projection (FBP)
Involves projecting back on the image the projected data, recreating original image plus stripe artefacts that are eliminated with some filtering.
Quick and very quantitative, but stripe artefacts are not entirely eliminated
Iterative reconstruction (IR)
Uses algorithms that improve the image quality by iteratively refining the estimates, resulting in fewer artefacts and enhanced detail compared to FBP.
Great visual appeal, but slow to converge (esp. small objects)
Data collection and processing:
Compartments are idealized containers of a substance that can either represent a segregated state of the tracer or a biochemical transformation.
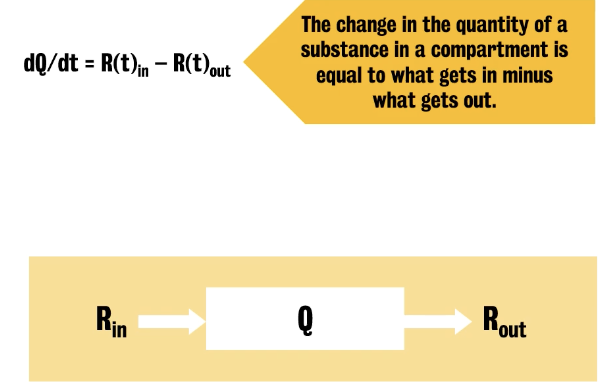
Equations used are quite simple (mass-balance equation)
:. Change in the quantity of a substance in a compartment = (what gets in) - (what gets out)
Part 3:
Cerebral blood flow (CBF)
Since the end of the 19th century, it has been known that the brain has its own local control of blood flow.
Kety-Schmidt method for CBF
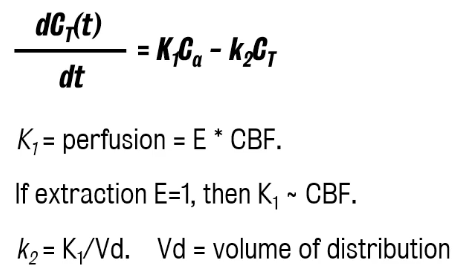
Any change in gas concentration in the brain depends on the rate of entry (K1,) and by the rate of exit, K2.
K1 (gas tissue perfusion) = E (extraction) x CBF (cerebral blood flow)
Lack of neuroimaging methods at the time lead to the use of venous concentration as a proxy for the tissue concentration.
Use of the Kety-Schmidt method led to the discovery of REM sleep
Advent of PET simplified this process.
With water labeled with 15O injected while its dynamic concentration in brain and plasma was measured, this data can be used in Kety-Schmidt equation to produce pixel by pixel images of cerebral blood flow
Paradigmatic example for enzymatic fluxes, glucose metabolism
Oxidation of glucose represents the main source of energy for the brain.
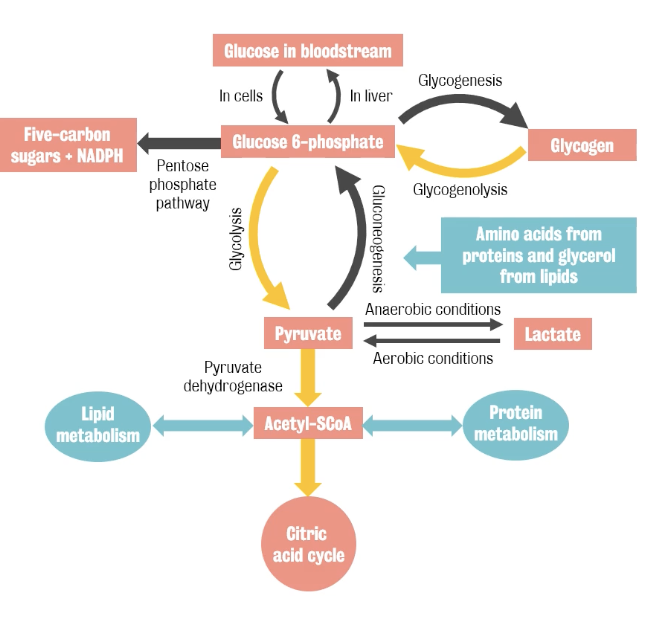
Process:
Glucose sitting in plasma is transported across the blood brain barrier
This is facilitated by glucose transported
When entering the mitochondria, glucose is phosphorylated to glucose 6P, turning molecules reactive.
From there, three (3) things can happen:
Glucose is stored as glycogen (doesn’t happen in the brain)
Or is diverted into the pentose-phosphate shunt, where it's used produce nicotinamide adenine triphosphate, which is used to fight oxidative stress
Majority of glucose is used in glycolysis to produce pyruvate, which is then used in mitochondrial respiration to produce ATP.
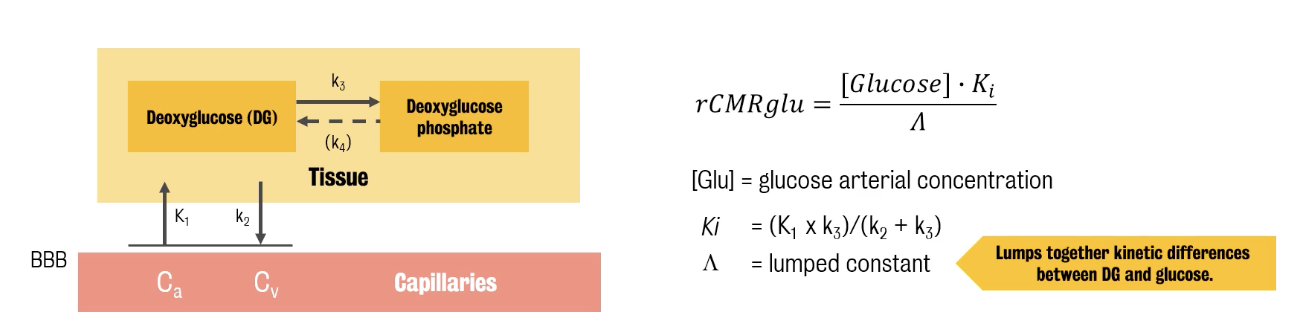
The cell controls the metabolic rate of glucose by adjusting the first step, phosphorylation. So, phosphorylation is the only process we need to trace.
Glucose analogue (deoxyglucose) can be used to trace phosphoralation
Deoxyglucose: A glucose without OH group that is transported into the cell and then is phosphorylated like glucose, but then it stops there and it accumulates in the mitochondria.
This accumulation stops glucose entry, making deoxyglucose a poison.
In the 1970s, Louis Sokoloff proposed the deoxyglucose method to estimate the metabolic rate of glucose.
Deoxyglucose is injected and measured through time both in plasma and in brain
Method only applicable to animals due to lack of neuroimaging technologies at the time
Advent of PET led to deoxyglucose was labelled with 18F, injected and radioactivity in blood and brain monitored for some time, 60 to 90 minutes.
The data were then used into Sokoloff's model to produce pixel-by-pixel maps of glucose metabolic rates.
Topic 2: Experimental designs & quantification
In experimental science, quantification indicates the process of transforming a group of experimental measures into a set of parameters that quantitatively describe the system of interest.
Behind this process is a mathematical model of the system of interest linked to the system of interest
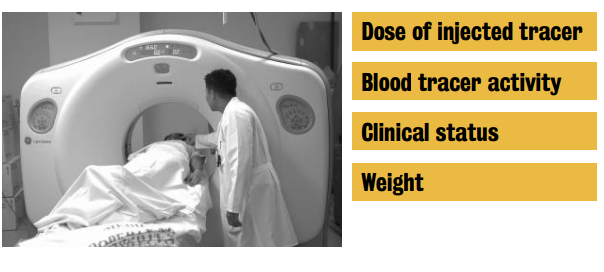
In PET quantification, the input is mainly represented by the PET measures of tracer radioactivity.
Measures can be combined with other subject information about weight or clinical status, additional experimental parameters & other experimental measures (i.e., blood tracy activity).
Blood tracer activity is important to model the tracer delivery to the target.
The output corresponds to a set of parameters describing tracer behaviour in the system of interest
Including: information of the tissue tracer uptake, the tracer accumulation rate or the radiotracer volume of distribution
The aim of quantification in PET is to obtain a set of measures that characterize trace behaviour in the biological system under investigation.
Under specific assumptions, it is possible to characterize the ongoing physiological processes of the investigated tissues providing a quantitative measure of the system functioning in vivo
:. In PET data quantification, we measure tracer behaviour as a proxy of the in vivo system functioning.
This is made possible because of the three (3) tracer kinetic principles:
Does not alter or perturb the system
Interacts with the system in a predictable, informative and reproducible fashion
Has a concentration that can be inferred quantitatively
Data quantification depends on ① the purpose of the study & ② the question the investigator is asking.
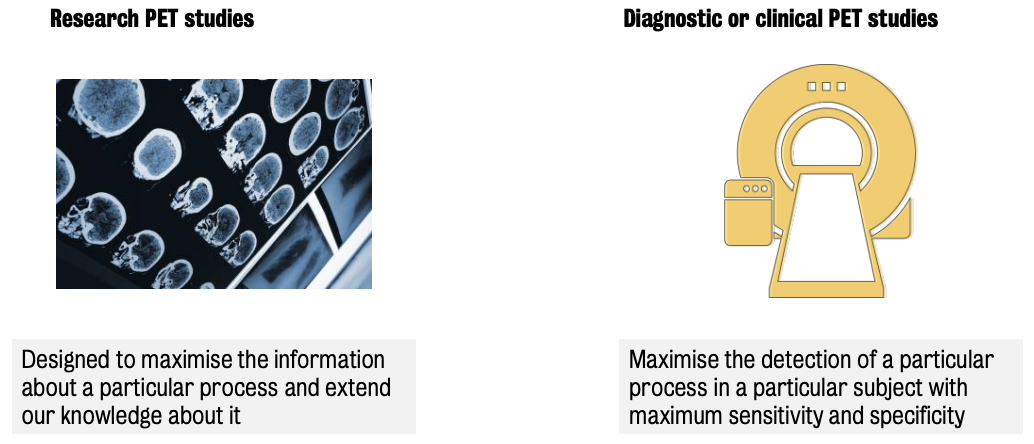
Two (2) classes of PET studies:
Research PET studies
Diagnostic (or clinical PET studies)
Constrained by the cost of scanning and the patients that need to be served per day
Static PET imaging = simplest experimental design in PET
Consists in the single acquisition of the target volume of interest performed at a time T after the tracer injection.
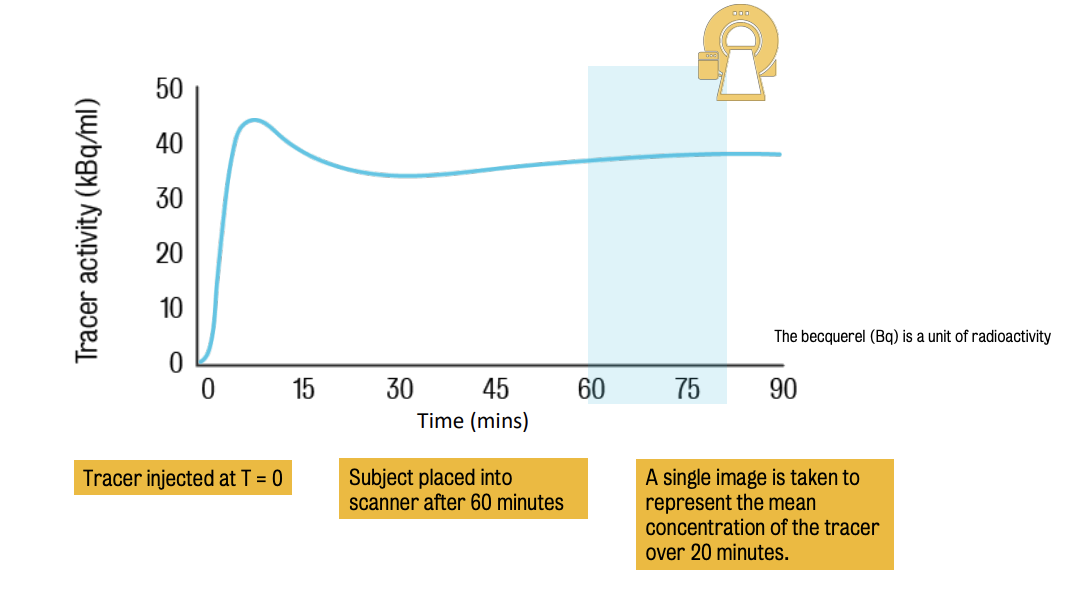
The resulting image represents the tracer activity across brain tissues :. it needs to be quantified using the standardised uptake value (SUV).
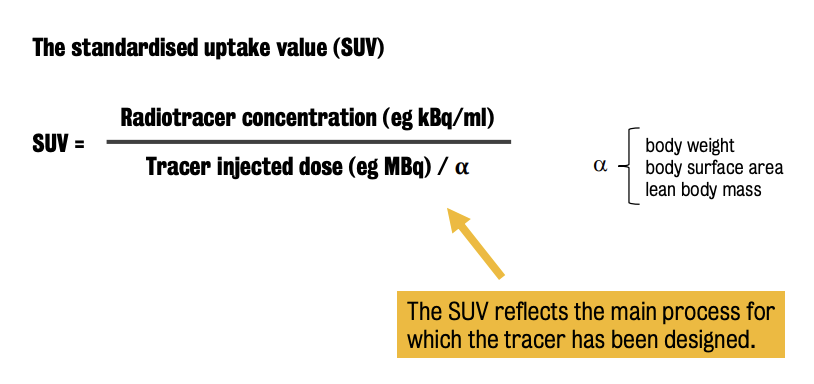
In SUV, there are different normalisation measures, depending on the application.
Most used normalization measure = subject’s (body) weight
⭐️ SUV reflects the main process for which the tracer has been designed.
E.g., In case of a [18F]FDG PET study, the SUV is proxy of tissue glucose metabolism. In case of a PET neuroreceptor system, the SUV is proxy of the receptor density
SUV is widely applied worldwide especially in clinical applications due to its simplicity and versatility.
Pros | Cons |
Suitable for clinical routine (🚫 require additional measures) | Provides an oversimplified description of the tracer kinetics |
Useful for diagnosis, staging and therapy evaluation. | Has proved to be influenced by many confounding factors, including experimental variables |
SUV use has to be a priori validated.
When SUV PET imaging serves as a biomarker for a particular disease or condition, it is important to test its capacity to differentiate between pathological and healthy tissue and return reproducible and biologically sound measures.
![Example of SUV PET image for a [18F]FDG PET/CT whole body scan](https://knowt-user-attachments.s3.amazonaws.com/c37a9c99-83c6-4471-a5d0-0583228f0422.png)
Note: SUV PET imaging is able to highlight an area representing glucose hypermetabolism due to the presence of a tumour.
Main limitation of PET imaging is time — evaluation of dynamic process using a static imaging is deprived of time (sensitive) information.
Solution? Dynamic PET imaging — approach in which we collect multiple images over time, starting for the tracer injection, in order to fully characterize the tracer kinetics
Part 2:
Dynamic PET imaging is the most complete, and most complicated, experimental design that can be performed in a PET study.
Consists of multiple acquisitions of the target volume of interest over time.
Unlike in static PET imaging, participant lies in the PET scan during the tracer injection (rather than before).
Characteristics of the acquired images change over time with the tracer tissue distribution and the tracer activity
Tracer decays over time :. sooner or later (depending on dose/type of isotope), there won’t be enough activity to get meaningful images out of the scanner.
Dynamic PET imaging can be coupled with arterial blood sampling to get the information of the radiotracer delivery to the tissue. Because of its superior experimental complexity, dynamic PET imaging data quantification requires more sophisticated ways of quantification.
Data collection process:
Dynamic PET data are collected over time, starting after tracer injection
In parallel, arterial blood is sampled from the radial artery and collected over time.
:. Parent plasma tracer uptake is separated from radiolabelled metabolites
Data is then used to identify parameters of a kinetic model representing the tracer behaviour in the brain tissues
Model usually includes tracer blood to brain exchanges and transformations or bindings that the tracer undergoes into the tissues
These processes are represented by kinetic parameters, also called kinetic rate constants
By using experimental measures, we can numerically identify these parameters and generate parametric maps of the tracer kinetics in the tissue which reflects the in vivo system functioning.
PET data preprocessing:
The PET scanner returns the measure of radioactivity in a given volume. This radioactivity is the overall result of multiple sources.
Three (3) contributions to total activity
Free tracer — i.e., trace available to get into the tissue
Radiotracer — tracer bound to blood cells or plasma proteins (🚫 available to get in tissue)
Radiolabelled metabolites — chemical species resulting from tracer body metabolism that still carry the radioisotope :. contributing to total signal activity
Total signal = all the contributions of the blood in the field of view + the contributions of tracer in the tissues.
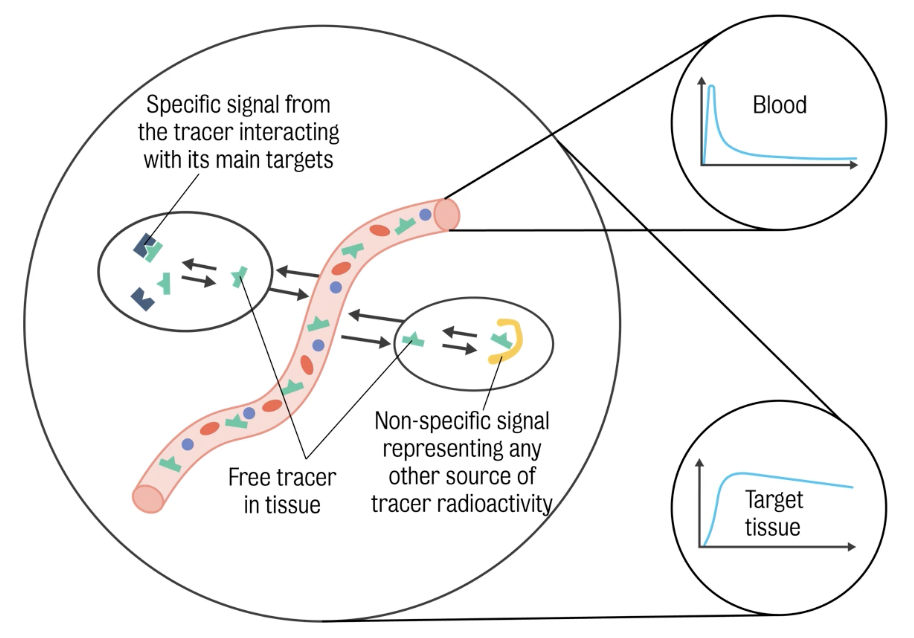
The ultimate purpose of quantification is to isolate the specific contribution by removing all the other effects from the total signal.
Blood input functions are important for the quantification of PET studies, as they represent the delivery of the tracer to the target tissues.
Factors to consider in arterial input function:
Distribution of tracer between red cells and plasma (i.e., fluid part of the blood)
Metabolites of tracer which carry the radiolabel
Binding to plasma proteins
To isolate the contribution of free tracer in plasma, two (2) types of corrections are generally performed:
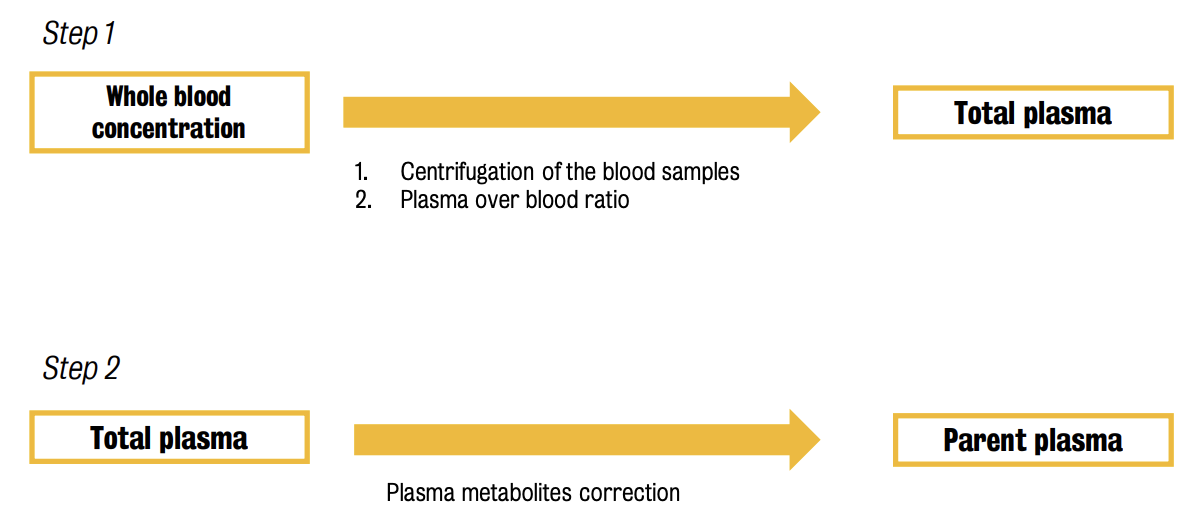
Blood processing starts with the sampling process. Two (2) ways for withdrawing blood during a PET scan: ① continuously using a pump, or ② manually.
Both methods can be combined for a better description of the blood time-activity course
Samples are then centrifuged & plasma samples are processed with a HPLC column to identify radiolabeled metabolites.
Raw blood measures are very rarely used directly in quantification.
De-noising filters or time interpolation are generally applied before the final quantification.
⚠ Important: Do not introduce artefacts during preprocessing — quantification of dynamic PET data is highly sensitive to the arterial input function shape, and small changes in parent plasma could produce large changes on final estimates
Arterial line represents significant discomfort for the patient that brings its own risk, as infection.
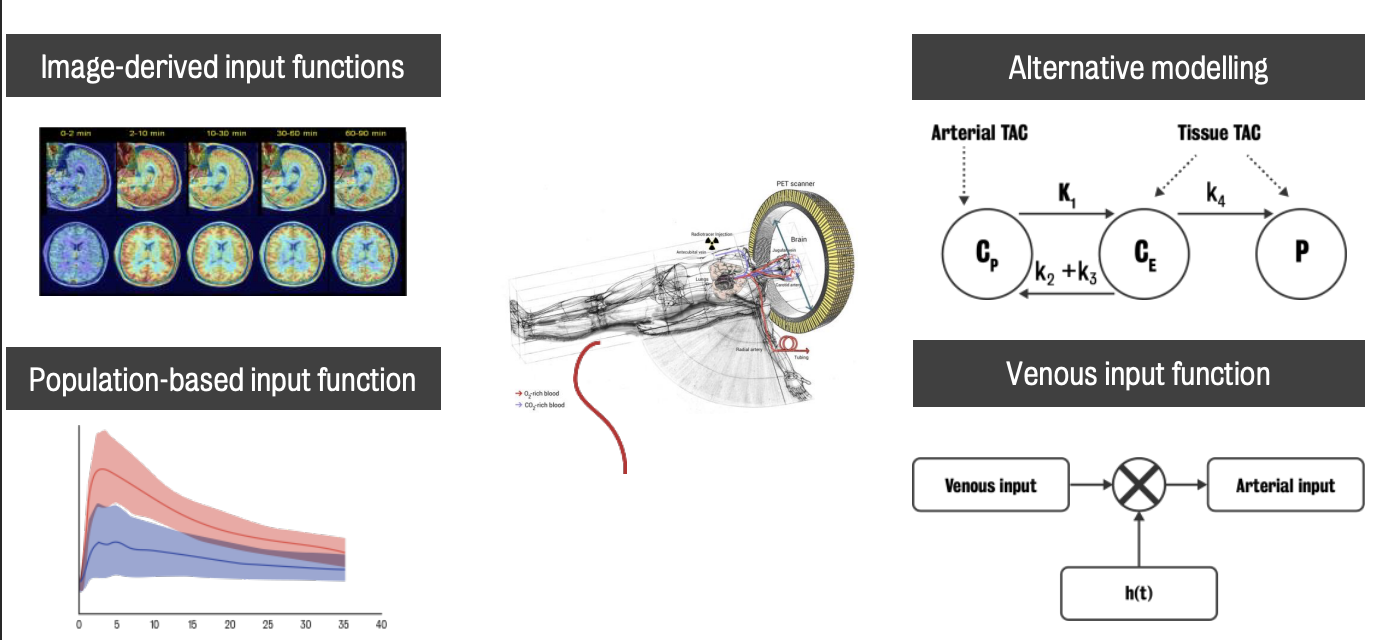
Rise in non-invasive or less invasive methods as results of efforts to produce quantification methods that could be used without an arterial line. Four (4) groups of said methods:
Image-derived input functions — use the image to derive the information of blood activity
Alternative modelling strategy —- relies on the presence of a region called reference that does not contain any specific binding
Population-based input functions — based on the combination of pre-acquired blood input functions calibrated with some individual parameters
Venous input functions
Venous blood is easier to be collected compared to arterial blood. However, it contains information on the washout of the tracer from the tissue rather than its delivery :. it needs to be individually transformed before being used in modelling.
Part 3:
PET data need to be preprocessed before any quantification step is applied
Three (3) phases of PET imaging data preprocessing:
Motion correction
Consists of the linear coregistration of the PET imaging frames
Attempts to solve motion problem within each frame
Partial volume correction
Partial volume = loss of imagery in small objects/regions caused by limited resolution
Segmentation
Allows extraction of information about tissues of interest
In PET, there are two (2) levels of analysis that can be used: regions or voxels.
① Voxel-wise analysis
Consists of the analysis of each voxel of the image within the field of view
⚠ Voxel size does not represent image resolution & can be defined as small as warranted.
Time-consuming
② Region-wise analysis
Consists of identifying groups of voxels that have some common characteristics and average their activities
Two (2) important consequences of this approach::
Less kinetic to process
Better data quality
:. Average has a great effect in noise reduction & quantification of these data will be more precise compared to the voxel wise analysis
Different types of segmentation can be performed:
Anatomical — based on system anatomy
Functional — based on system physiology
Multi-modal — based on the integration of PET data with other imaging techniques.
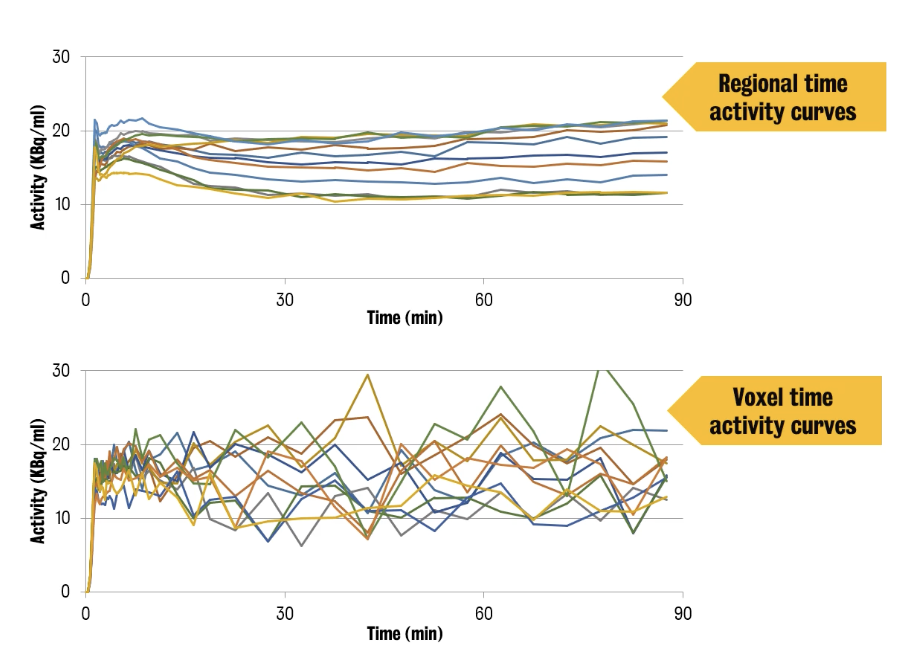
⭐ ️Voxel time activity curves (TACs) have a significantly lower SNR (signal-to-noise ratio) compared to regional TACs.
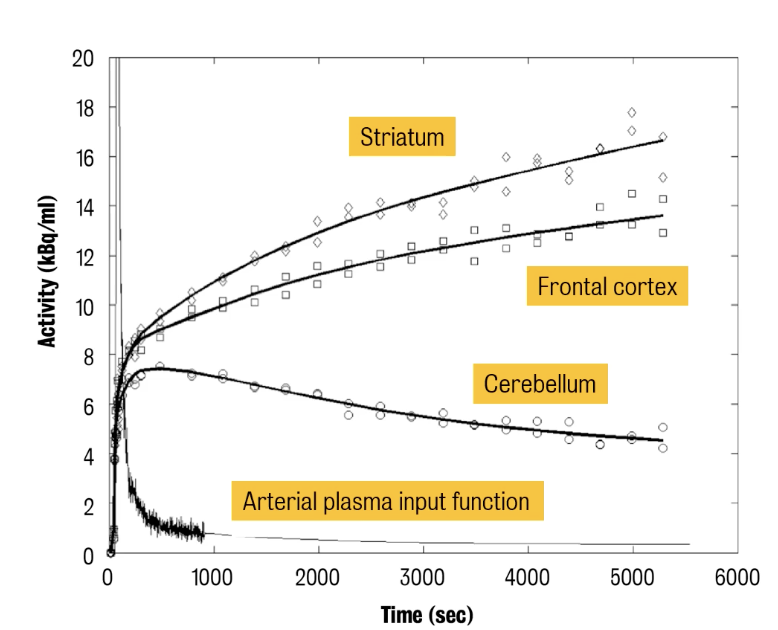
In the 2nd example, the shape of tissue TACs differs because of the different perfusion of the tissue & different biological behaviour of the tracer in the tissues
Alternatives for quantification in dynamic PET imaging:
Graphical methods
Use the concept of tracer-system equilibrium
Spectral analysis (or basis functions methods)
Perform a decomposition of the PET signal of some pre-defined functional basis
Compartment analysis method
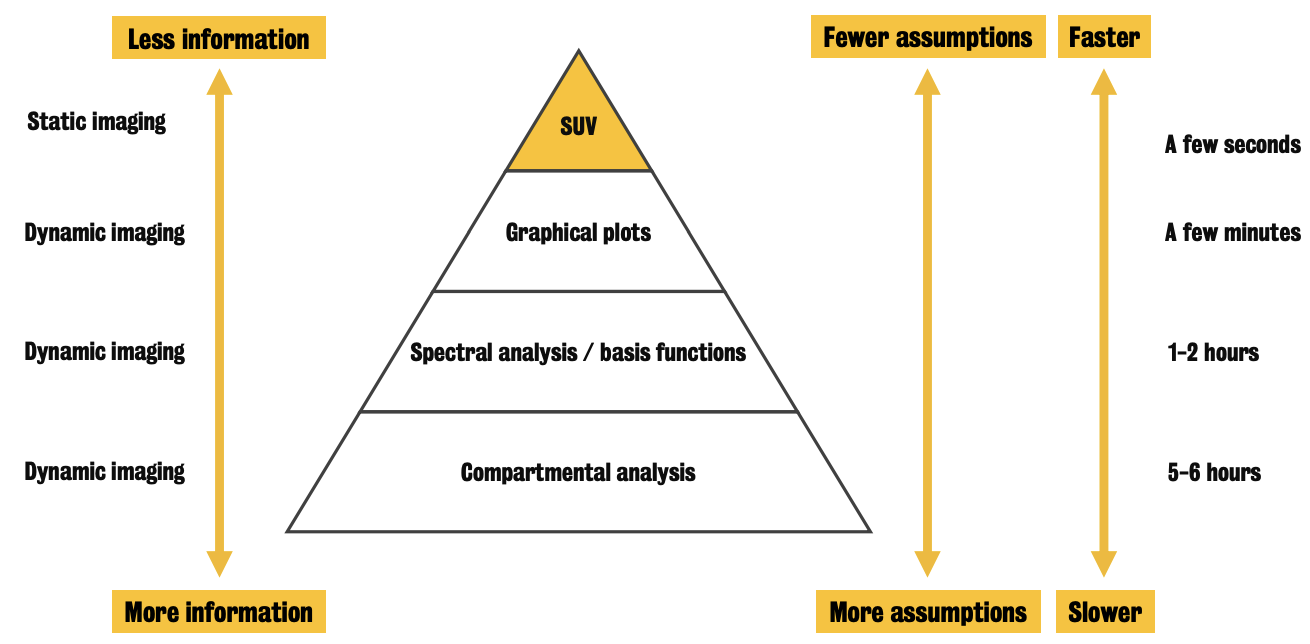
⚠ The more assumptions are needed to run the quantification, the more informative this will be.
⭐️ These quantification approaches are characterized by different computation costs.
Example: for whole brain voxel-wise analysis, graphical analysis can take a few minutes while compartmental analysis up to several hours
Computational times can be reduced using computer clusters
Among all the PET quantification methods, compartmental analysis is the most informative (b/c it returns a full description of tracer kinetics) & the most important from which all the others are derived
Based on definition of compartment
In PET, a compartment represents the tracer in a homogenous biochemical or physiological state.
Exchanges of tracer between compartments are described by the mass/balance equation, defined by drug concentrations and kinetic rates constants
A compartmental model is generally represented by a set of boxes connected by arrows.
Exploits a system of first-order differential equations, the solution of which provides the description of tracer kinetic in tissues.
Kinetics rates can be combined to calculate system macro-parameters depending on system modelling.
Not all compartmental configuration can be practically used
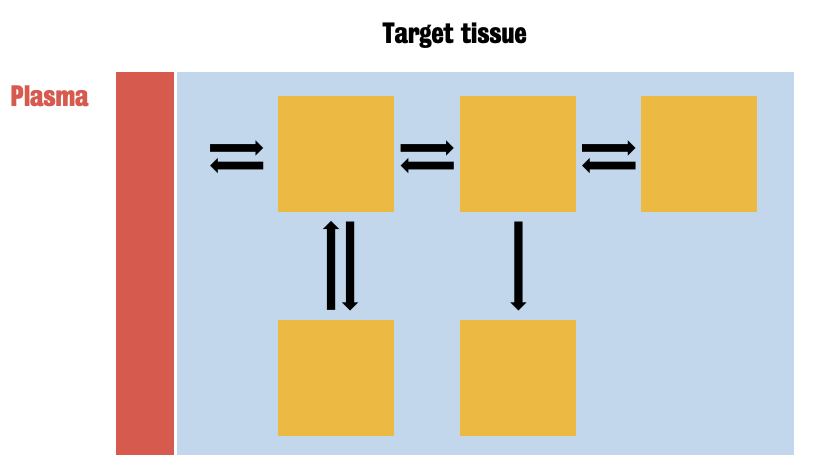
Note: Plasma = supply of trace to tissue; Blue area = total tissue signal measured by PET camera
Summary
PET data quantification returns information hidden behind the PET measurement
Tracer behaviour reflects reflects in vivo system function.
Data quantification is an integrated part of a PET study.
Data quantification depends on the desired outcomes and it is limited by the experimental design :. needs to be taken into account in the early phases of PET experimental planning.
Topic 3: Biomarkers in preclinical research
Biomarker = distinct biochemical, genetic or molecular characteristic or substance that is an indicator of a particular biological condition or process.
Indicates the extent of a biological process or condition
Can be used for diagnosis and clinical treatment monitoring
Detecting more complicated biomarkers → to quicker and more accurate diagnosis
Choosing the right biomarker means finding one that is detectable, measurable & validated.
The nature of a biomarker can be broad and versatile, however, nowadays, biomarkers are mostly molecular markers (e.g., genes, proteins)
Molecular markers exhibit discriminating potential between diseased and healthy subjects that can be used for disease diagnosis, prognosis, prediction of therapeutic responses & therapeutic development
Two (2) categories of biomarkers: bio-specimen (including molecular and genetic biomarkers) or bio-signal (imaging)
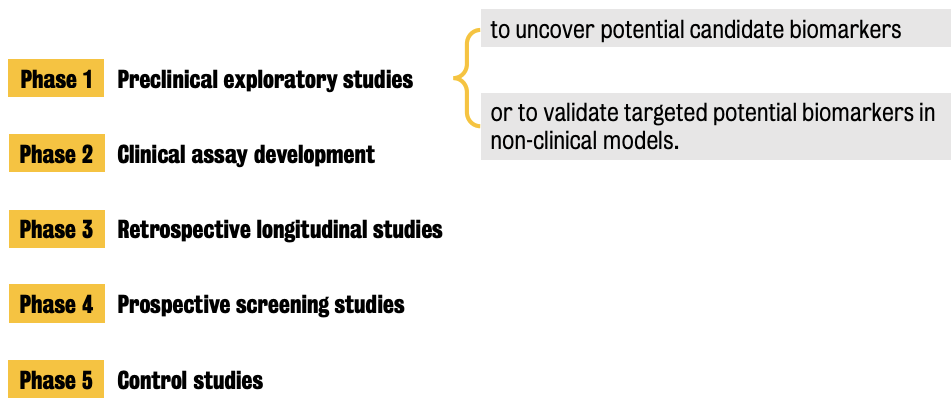
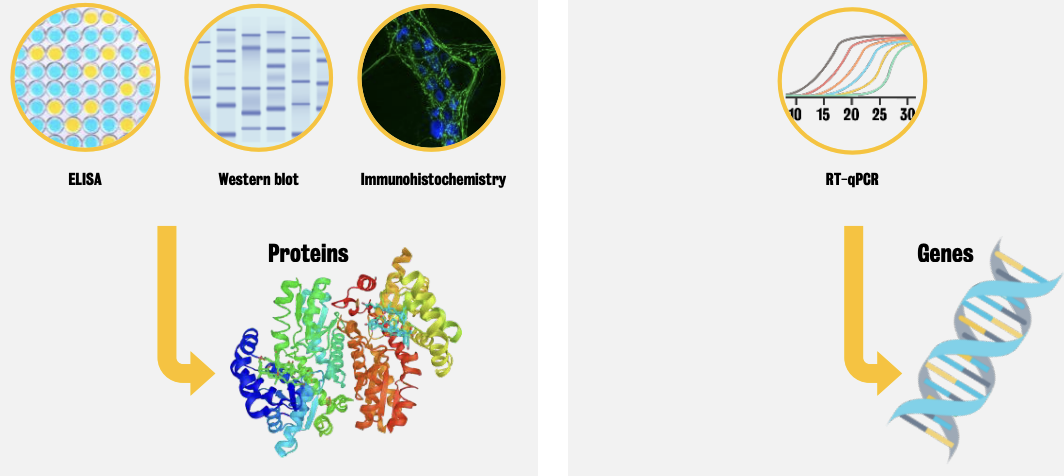
Preclinical detection techniques to discover/validate genetic and molecular biomarkers are generally molecular biology methods
E.g., western blot, ELISA, immunohistochemistry (for protein detection) and RT-qPCR (for gene detection)
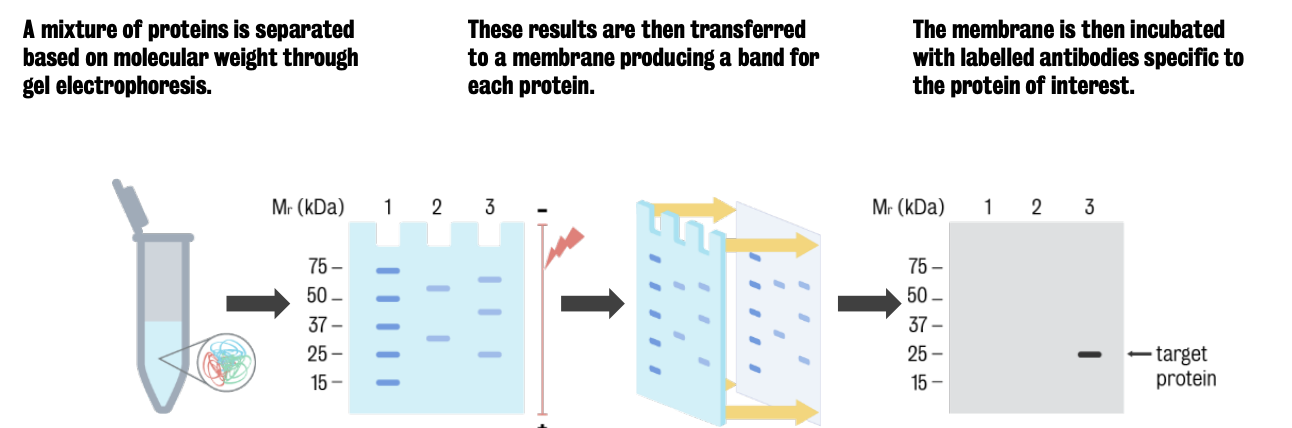
Western blot
Technique is used to separate and identify proteins and detect changes in the particular protein of interest.
Step 1 — Sample preparation in western blotting procedure:
Proteins are isolated from the rest of the cell’s components
Chemical or physical-based methods are used to disrupt cell plasma membranes and release (extract) proteins (from the cell).
Chemical-based lysis uses various types of detergents to make proteins accessible.
Following lysis, cells and their content are spun in a microcentrifuge → aqueous supernatant containing solubilized proteins and a pellet which contains membranes (organelles) nuclei acids and any remaining insolubilised proteins
Supernatant (called protein lysate) is separated from pellet to use for western blotting
Weak detergents are used to extract water soluble proteins inside the cell without disrupting intercellular membrane compartments. Strong detergents are able to solubilise or make available the proteins found within all membranes.
Step 2 — Separating proteins according to size
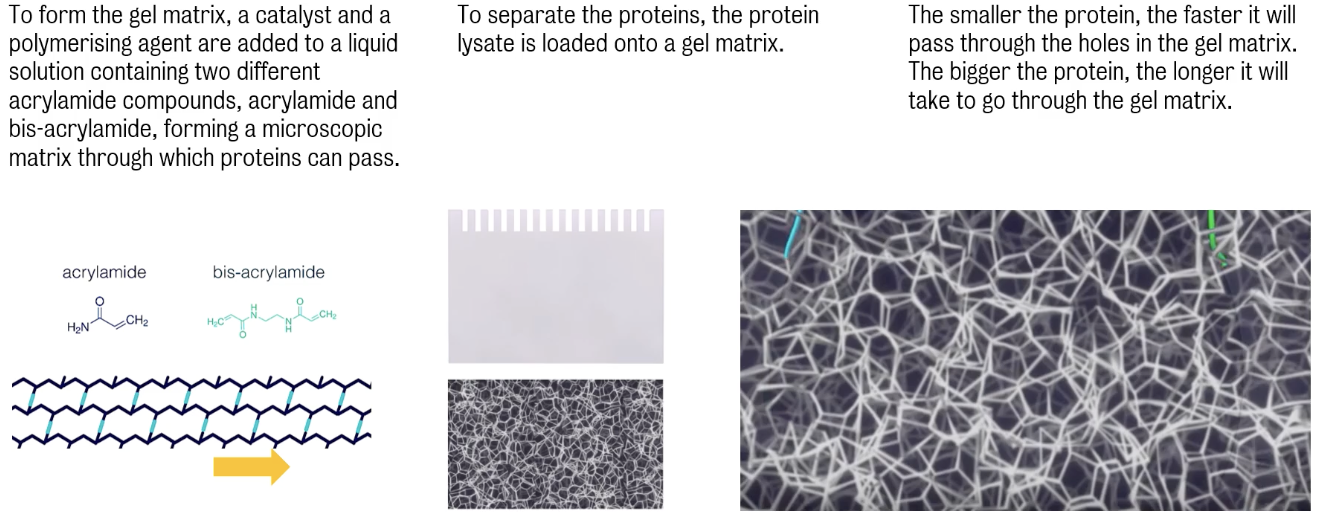
Proteins are able to pass through the gel matrix thanks to holes.
This step is referred to as Polyacrylamide Gel Electrophoresis (PAGE)
Aim of polyacrylamide gel electrophoresis is to separate proteins according size, shape or charge.
There are several forms of PAGE, two (2) most commonly used are ① non-denaturing/native PAGE and ② denaturing, or SDS-PAGE.
In SDS-Page, proteins are assed in a denatured (i.e., unfolding) state and separated in the gel matrix according to their mass only. This method uses sodium dodecyl sulfate (SDS), an anionic detergent, to denature proteins and uniformly coat them with a negative charge, allowing them to migrate at similar rates, thus ensuring that their separation is solely based on size.
Loading a sample buffer for electrophoresis allows researchers to monitor the proteins as they migrate through the gel, since proteins are mostly colourless.
This is achieved by adding a dye solution (aka sample buffer) to the protein lysate.
Sample buffer contains additive such as glycerol, which makes the sample buffer denser than the surrounding running buffer, causing the sample to sink to the bottom of the well rather than mix with the surrounding buffer
The sample buffer also contains a negatively charged dye (commonly bromophenol blue) used monitor the progress of electrophoresis.
Tracking/loading dyes have low molecular weights and migrate ahead of most proteins within the protein sample.
Once the protein lysate and sample buffer mixture are ready, the protein samples are heated in sample buffer for a short time to facilitate protein unfolding for SDS-PAGE.
Sample buffer also contains betamercaptoethanol and DTT to disrupt disulphide bonds, further assisting in protein unfolding by disrupting quaternary structure.
To assess the molecular weight of a protein after gel electrophoresis, a sample (protein ladder) containing several prestained proteins of known size, is loaded and run along with the experimental samples.
The use of protein ladders with prestained proteins increases visibility and facilitates monitoring of protein migration through the gel.
After loading the protein lysate in ladder, the gel is run by connecting the chamber to a power supply.
To process the gel further for the detection and visualisation of specific proteins and/or molecules, the proteins are transferred from the gel onto a more durable material that can be manipulated and blotted with antibodies of interest.
Transferring allows antibodies free access to proteins and necessary due to the fragility and difficult to manipulate nature of polyacrylamide gels.
Transfer method most commonly used in western blotting is electroelution, where an electric field is applied to the gel to facilitate the migration of the proteins out of the gel and onto a piece of membrane.
Transfer is accomplished by placing the polyacrylamide gel in direct contact with a membrane made of nitrocellulose or another non-reactive material that binds to proteins, and submerging both in a buffer filled chamber.
Gel membrane sandwich is placed in such a way that the negative electrode is located closest to the gel, while the positive electrode is located closest to the membrane. When the electric field is applied to the chamber, proteins in the gel migrate from the negative end to the positive end of the chamber, moving out of the gel and into the membrane, to which they become tightly attached
Use of secondary antibodies to produce light:
After washing the membrane to remove unbound primary antibody the membrane is incubated with the secondary antibody which recognizes the type of primary antibody used.
Secondary antibodies are bound to a reporter enzyme which catalyses a reaction that produces light.
The amount of light produced is directly proportional to the amount of antibody bound and the amount of protein the sample has.
The most common way to record light output is using the x-ray film that is placed directly on top of the membrane (after the addition of horseradish peroxidase substrate) .
The light signal is a transient product and will only persist while the reaction is occurring. Increased time exposure of the membrane to the film will yield stronger signals, but also increased background.
Part 2:
RT-qPRC is a technique used to study changes in gene expression by amplifying specific DNA sequences.
RT-qPCR is identical to a standard PCR, except that the progress of the reaction is monitored by a camera.
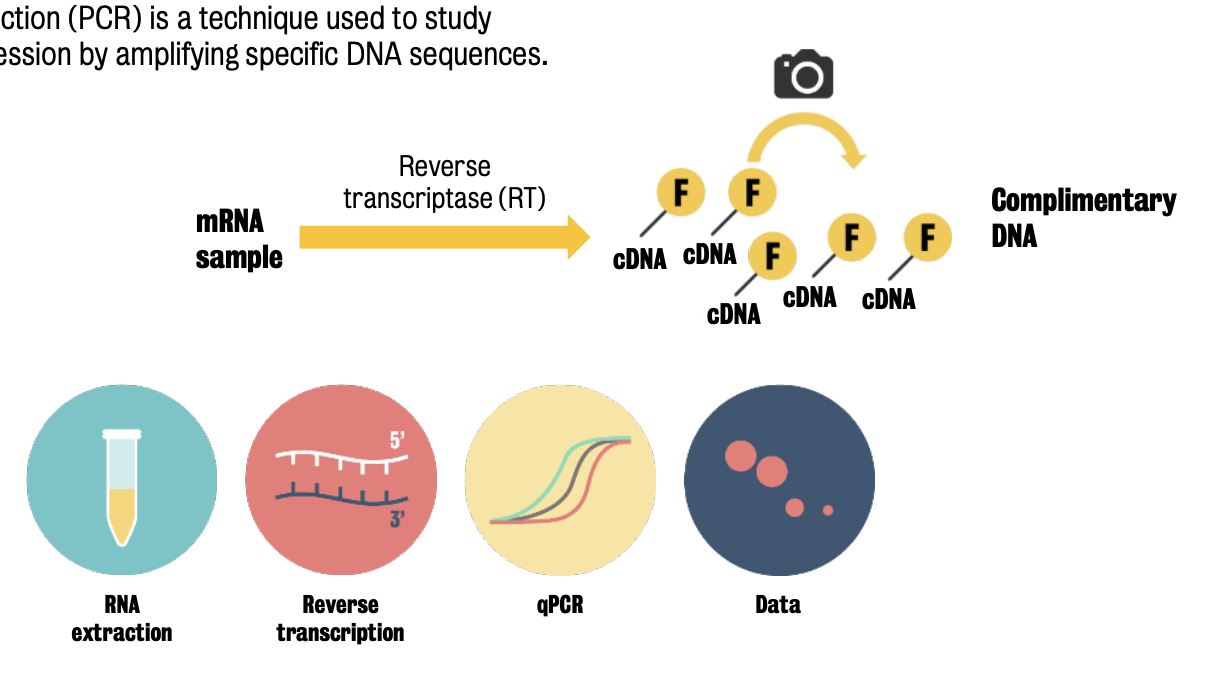
RT-qPCR steps:
RNA sample is reverse-transcribed to cDNA with an RT enzyme
Fluorescent marker binds to amplified DNA.
Quantification: Increase in fluorescence during the exponential phase of PCR.
Number of gene copies increase during the reaction → fluorescence increases
In RNA isolation, RNA is separated from DNA and proteins by chemical phases:
TRIzol method isolates RNA from tissue sample by separated RNA from DNA and proteins by chemical phases.
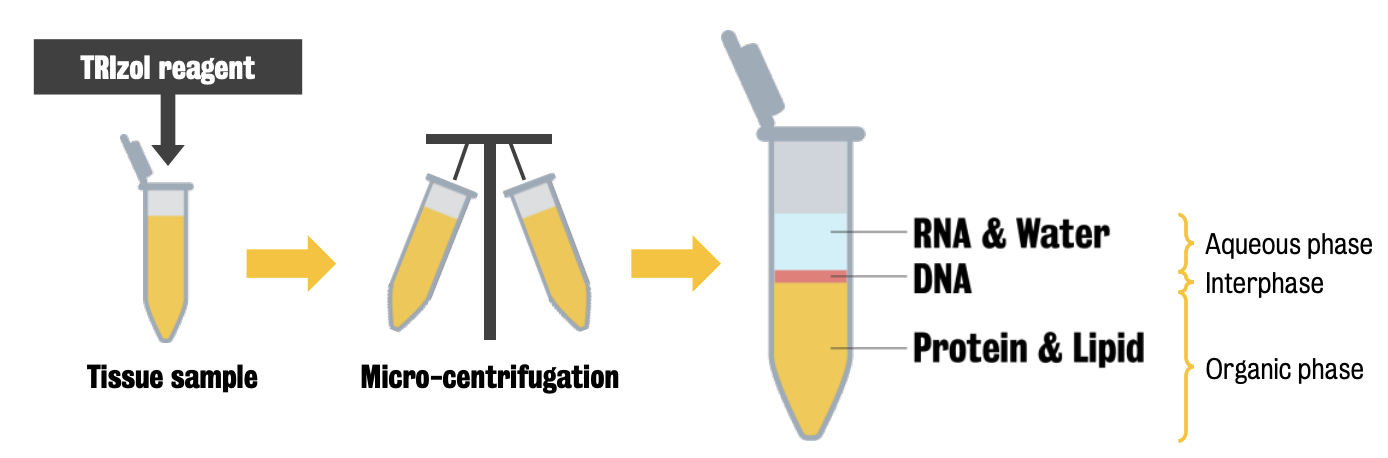
This is followed by ① alcohol precipitation → ② clean up, then RNA is ready to continue PCR process.
Reverse transcription is the process of making complementary DNA (cDNA) from single-stranded RNA
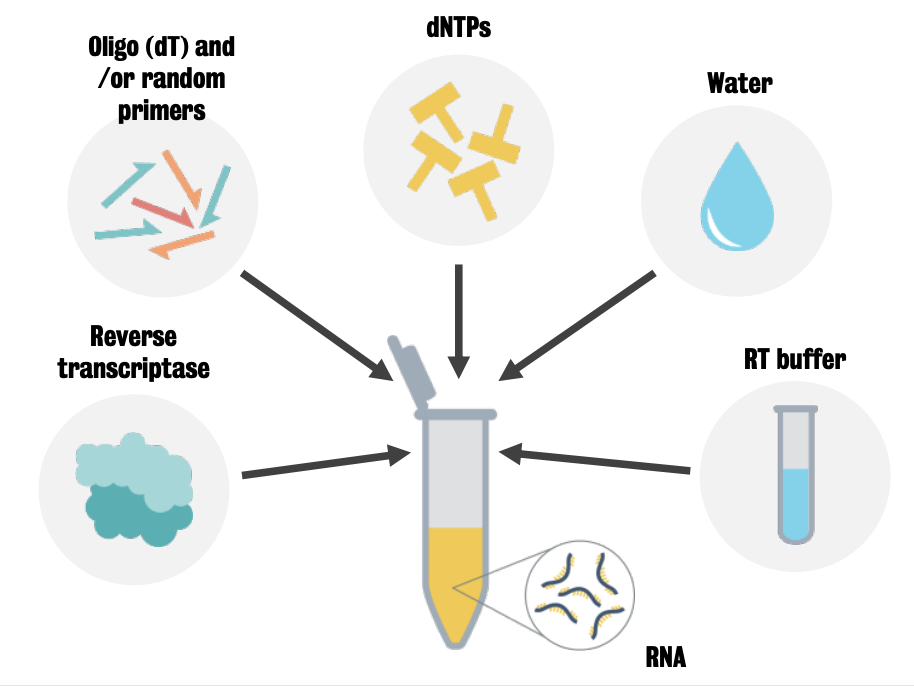
RNA is incubated with the mix of RT enzyme, primers and dNTPS at different temperatures to produce RNA denaturation, primer annealing and RNase digestion and as a result cDNA.
Primary component of PCR starts with cDNA, which includes:
Target sequence;
Short single strands of DNA sequences complimentary to specific part of target sequence;
DNTPs (building blocks for new DNA strand);
DNA polymerase (enzyme that uses single strand of DNA as a template to synthesize a complementary DNA strand
PCR is performed in a thermocycle instrument. It heats up to near boiling point (~ 95°C), allowing double helix DNA to separate and create single-stranded DNA molecules.
Once the thermal cycler has cooled down, single-stranded DNA molecules naturally attempt to pair up, however, primers bind onto targets before strands can rejoin.
I.e., primers tell DNA polymerase where to start and where to stop replication.
This is called annealing.
When DNA polymerase locates a primer attached to a single DNA strand, it begins to add complementary nucleotides onto the strand. It continues until it gets to the end on the strand and falls of.
In this phase, DNA polymerase replicates single-strand DNA molecules
This is called extension.
This process is repeated, allowing products to increase exponentially as the cycles continue. At the end of the 40 cycles, there will be > 1 Million fragments containing only the target sequence.
In RT-qPCR, the quantification of the DNA products is achieved by measuring the increase in fluorescence during the exponential phase of PCR. The number of gene copies increase during the reaction so the fluorescence increase.
ELISA (enzyme-linked immunosorbent assay)
Plate-based assay technique that uses a solid-phase enzyme immunoassay designed for detecting and quantifying substances such as peptides, proteins, antibodies and hormones.
Sandwich ELISA: type of ELISA in which the plate is pre-coated with a specific antibody to the target antigen before the sample containing the specific target antigen and other non-target antigen is added into the wells.
Target antigen will bind to the specific antibody
Secondary antibody with an enzyme or biotin linked is added which will bind again to the antigen and its retained.
Colourless substrate of the enzyme or biotin is added, development of colour indicates the presence of the antigen.
The enzyme reaction is stopped and the result is monitored spectrophotometrically.
Immunohistochemistry (IHC):
Technique that allows the localization of antigens or proteins and cells in tissue sections using the high specificity and affinity of antibodies to recognize molecules and join them.
Enables visualisation of tissue distribution of specific antigens (epitopes)
Antibody staining involves the application of a primary antibody that binds specifically to the target antigen + secondary antibody that bind to the primary antibody.
Detection system is built on the secondary and consist in a polymer of avidin biotin attached to an enzyme such as horseradish peroxidase (HRP).
3,3-diaminobenzidine is used as a substrate of the enzyme and causes a brown insoluble precipitate that can be visualised under a microscope.
Brown precipitate indicates the presence of the target antigen.
Amount of staining, the staining pattern and the location of the staining, all provide information for the diagnosis pathology
Imaging biomarker serve as indicator of ① a normal biological process, ② a disease, or ③ a response to a therapeutic intervention.
Molecular imaging is an emerging research tool and clinical discipline that aims to discover and apply novel molecules (probes) and methods to image normal and pathological biological processes on a cellular and molecular level in vivo.
Advantages:
Non-invasive
Spatially localizes physiological and molecular function in vivo.
PET is one of the most widely used neuroimaging technique to visualize biomarkers.
PET scanners track the position of tracers inside the subject revealing brain functions in three dimensions.
Steps:
Produce the radioactivity using a cyclotron — smashes high speed particles into ordinary atoms, transforming them into new radioactive atoms
Right level of radioactivity will absorb tracer & radioactive atom → tracer loses its radioactivity, giving off the subatomic particle called positron.
Positron hits (negatively charged) electron, combine and destroy each other
Energy from this reaction is released in the form of gamma rays, which are detected by the PET scanner and used to create 3D images of metabolic processes in the body.
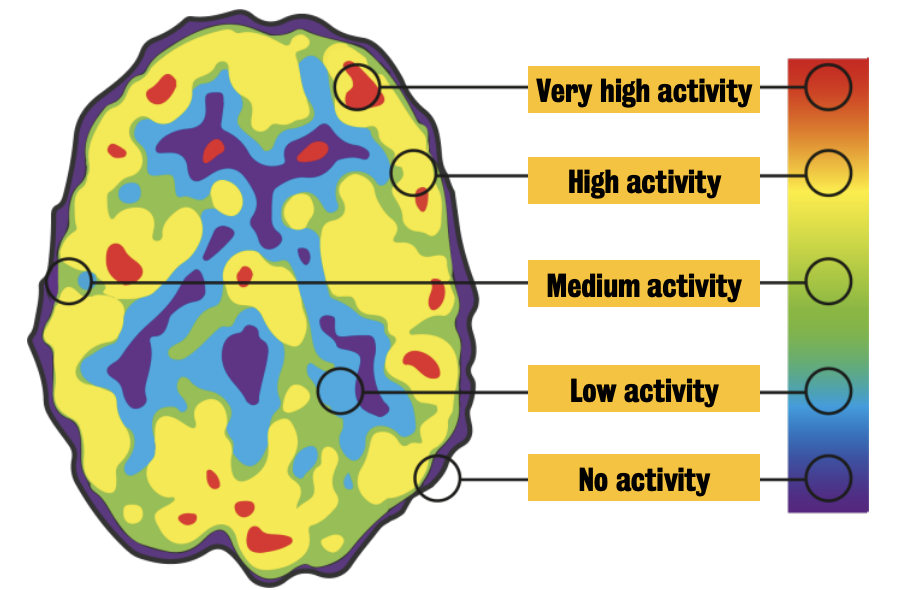
Coloured PET images are created via a computer, which displays each measurement as a series of tiny dot.
The colour of each dot shows the intensity of the energy signal.
Red = highest activity (i.e., greater brain activity)
Developing and validating imaging biomarkers would help to diagnosis and to monitor the success of a therapy or the progression of a disease.
Translational research expresses the potential benefit that modern technologies may bring to the discovery and development of new therapies.
Preclinical models of different diseases play a crucial role in medical areas :. integration of nuclear medicine/PET techniques in this model would benefit translation to clinical studies.
Examples of imaging biomarker use in preclinical models:
Imaging glucose metabolism using Fluoro-deoxyglucose (FDG PET)
Visualization of AD pathology (Aβ plaque = AD hallmark) markers using Amyloid PET