BIOL Practical Exam Study Guide
Syllabus, Safety, Metric System and Measurement
Syllabus policies and procedures
Absence notification must be submitted via RebelMail to the Lab Coordinators within 14 days of the start of the semester
Due to illness or emergencies, absence notification form must be filled out via RebelMail to the lab coordinators with 24 hours of the lab absence
Metric system conversions + prefixes
(check your phone for photos)
Micropipetting
P20: measures 2-20 microliters
used for small volume transfers with high precision.
example: if it reads 068 (top to bottom), it’s 6.8
P200: measures 20-200 microliters (actual reading)
used for transferring mid-range volumes with accuracy.
example: if it reads 150, it’s 150 microliters.
P1000: measures 200-1000 microliters
used for larger volumes
if it reads 068, it’s 680
Solution Concentration
Solute: Substances dissolved in a liquid (sugar)
Solvent: The liquid that does the dissolving (water)
Calculating concentration
Mass or volume = mass (solute, g)/volume (solution, mL)
Solutions of DIFFERENT concentrations: C1V1/C2V2
Temperature Conversions
Fahrenheit to Celsius: C = (F - 32) / 1.8
Celsius to Fahrenheit: F = (C x 1.8) + 32
Spectrophotometer and Concentration
Spectrophotometer measures the amount of light a sample absorbs or transmits
Absorbance and Concentration relation
Absorbance is directly proportional to the concentration of a substance in a solution as described by Beer-Lambert Law
Microscope
(check pictures on phone)
Calculating total magnification
Total magnification = ocular lens power × objective lens power.
Standard ocular lens power is typically 10x.
Ensure to adjust the objective lens to the appropriate magnification for your specimen.
4x objective: 10 (ocular) x 4 (objective) = 40x total magnification
10x objective: 10 × 10 = 100x total magnification
40x objective: 10 × 40 = 40 total magnification
100x objective: 10 × 100 = 1000x total magnification
Scientific Method
Hypothesis
An educated guess that can be tested through experiments and observations.
example: more sunlight leads to faster plant growth.
Independent variable:
The factor that is manipulated (changed) in an experiment to determine its effect on the dependent variable.
example: water amount
Dependent variable:
The factor that is measured in an experiment to assess the impact of the independent variable.
example: plant height; the height of the plant is measured to determine how different amounts of water affect its growth.
Constant variable:
kept the same
example: type of plant, soil, or temperature
Controls
comparison group
example: plants that receive a standard amount of water, serving as a baseline for comparison
Observation
Noticing/describing
can be qualitative (descriptive) or quantitative (numerical)
Pill bug/Isopod/Roly Poly Experiment
Objective: To observe the behavior of pill bugs in response to various environmental factors such as moisture, light, temperature, food, and soil type
Conclusion: Isopods prefer more soil and dark environments
Basic Chemistry
Reactions
Condensation Reaction: A type of reaction where two molecules combine to form a larger molecule, with the loss of a small molecule, often water.
Protein synthesis: amino acids link to form proteins, releasing water
Glycogen Synthesis: glucose molecules join to form glycogen (energy storage), releasing water
Triglyceride Synthesis: fatty acids and glycerol combine to form triglycerides (fat storage), releasing water
Hydrolysis Reaction: A reaction that involves the breaking down of a compound by the addition of water, effectively reversing the process of condensation.
Digestion: enzymes break down carbohydrates, proteins, and fats into smaller molecules by adding water
Glycogen Breakdown: glycogen is broken down into glucose to provide energy
Protein Breakdown: Proteins are broken down into amino acids for various cellular processes
Three molecules we tested for (their monomers and polymers) + amino acids
Carbohydrates
Monomer: monosaccharides
example: glucose, fructose, galactose
Polymer: polysaccharides
example: starch, glycogen, cellulose
Proteins
Monomer: amino acids
Polymer: polypeptides (proteins)
Nucleic Acids
Monomer: nucleotides
Polymer: DNA and RNA
Amino Acids
Building blocks of proteins
each contains an amino group, a carboxyl group, a hydrogen atom, and a unique side chain (R group) all attached to a central carbon atom
Lab test and expected results
Benedict Test (Simple Sugars)
Reagent: Benedicts solution (blue)
Positive result: color change from blue to green, yellow, orange, or red upon heating
Negative result: blue
red = high concentration of simple sugars present.
Iodine/Lugol’s Test (Starch)
Reagent: iodine solution (a brown solution)
Positive result: dark blue or black
Negative result: brown
Biuret Test (Protein)
Reagent: Biuret reagent (a blue solution containing copper sulfate
Positive result: violet or purple
Negative result: blue
Sudan Test III (Fats)
Reagent: Sudan III (red dye)
Positive result: red to orange coloration indicates the presence of fats.
Negative result: no color change or light pink coloration suggests the absence of fats. (clear/colorless)
Acids vs Bases vs Neutrals
Acids: Substances that donate protons (H+) in a solution, typically have a pH less than 7.
Bases: Substances that accept protons or donate hydroxide ions (OH-) in a solution, usually have a pH greater than 7.
Neutral: Solutions that have a pH of 7, indicating no excess of either H+ or OH- ions.
Buffers and Buffering Capacity
Buffers: resist changes in pH
it neutralizes small amounts of added acids or base
Buffering Capacity: the amount of acid or base a buffer can handle before its pH changes significantly, which is crucial for maintaining a stable environment in biological systems.
Cell Structure and Function
Diffusion vs Osmosis
Diffusion: The movement of molecules from an area of higher concentration to an area of lower concentration, continuing until equilibrium is reached.
Substance: diffusion involves the movement of any type of particle
Membrane: diffusion does NOT require a membrane
Driving force: both are driven by concentration gradients
Osmosis: A specific type of diffusion that involves the movement of water molecules across a selectively permeable membrane.
Substances: osmosis specifically involves the movement of water
Membrane: osmosis requires a semipermeable membrane
Driving force: both are driven by concentration gradients but osmosis specifically driven by differences in water concentration (or water potential) across a semipermeable membrane
Semipermeable Membrane: allows water molecules to pass through, but it restricts the passage of solute particles (like salts, sugars)
Concentration Gradient: exist when there is a difference in the concentration of solutes on either side of the membrane (example: one side has a high concentration of sugar, while the other side has a low concentration of sugar)
Water Concentration: the amount of water relative to solute concentration. If one side of the membrane has a high concentration of solutes, it has a low concentration of water. (if one sides has low concentration of solutes, it has a high concentration of water)
Net Water Flow:" Water moves from an area of high water concentration (low solute concentration) to an area of low water concentration (high solute concentration).
SIMPLER TERMS
more stuff (solute)= less water
water moves from where there’s less stuff to where there’s more stuff, in an attempt to even things out
Prokaryotic vs Eukaryotic
Prokaryotic cells: Simple, single-celled organisms without a nucleus (ex: bacteria and archaea)
No membrane bound organelles like mitochondria, endoplasmic reticulum, golgi apparatus
small size
simple structure makes them capable of reproducing rapidly, which contributes to their adaptability in various environments.
Cell wall: some have cell walls (not made of cellulose)
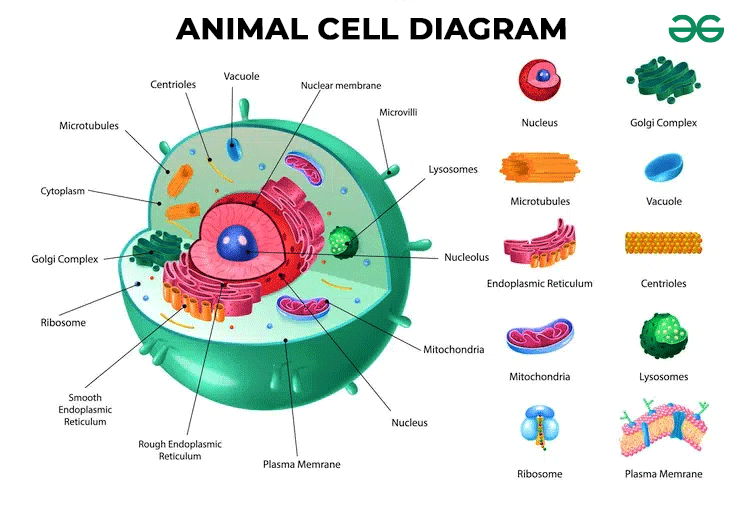
Eukaryotic cells: More complex, can be single-celled or multicellular organisms with a nucleus (e.g., plants, animals, fungi, protists )
Has membrane-bound organelles like mitochondria, ER, golgi, lysosomes
large size
complex structure
Cell wall: some have cell walls (plants and fungi), but animal cells DO NOT
Different shapes of bacteria
Coccus: spherical round-shapes bacterial (like little balls)
Bacillus: rod-shaped bacteria
longer than their width (like cylinder or sausages)
Spirillum: spiral-shaped bacteria
rigid, wavy, or twisted shape (like a corkscrew)
Steps to make a wet mount
Clean the slide and coverslip
ensure the microscope slide and coverslip are clean and free
Place the sample on the slide
put a small drop of your sample onto the center of the clean microscope slide.
Apply coverslip
carefully lower the coverslip at an angle to avoid trapping air bubbles, which can obstruct your view of the specimen.
examine under the microscope
Adjust the focus slowly while observing the slide to ensure that the specimen is clearly visible. Take notes on the characteristics and structures observed during your examination.
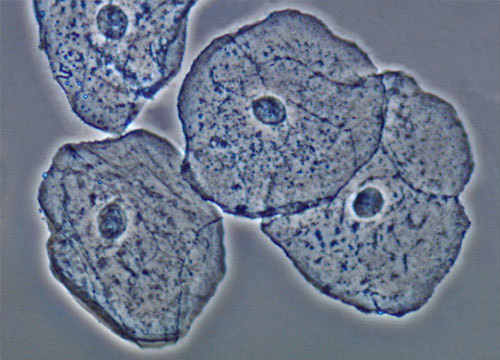
Cheek Epithelial Cells
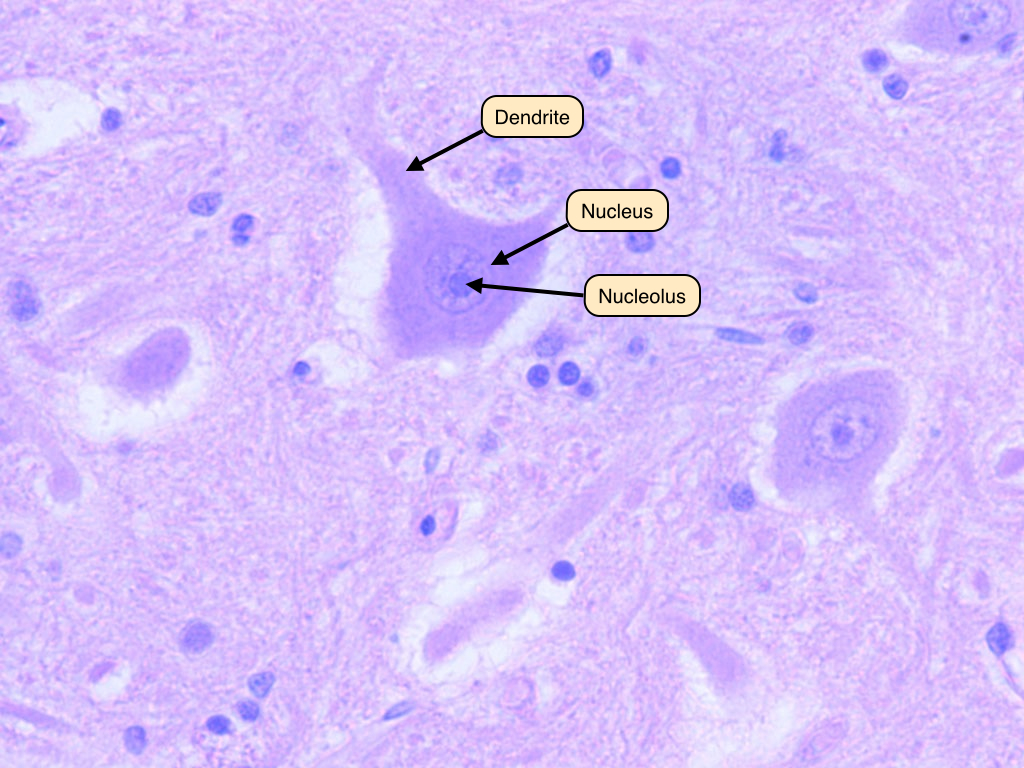
Human Neuron/Nerve Cells
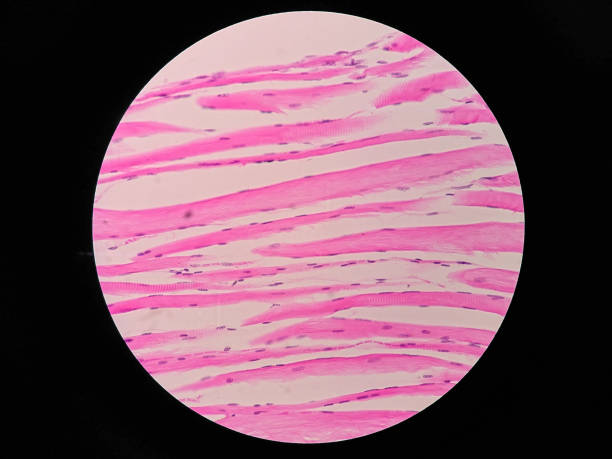
Human Skeletal Muscle
Elodea (leaf cells)
Anabaena

Plant vs Animals
DIFFERENCES
Cell structure
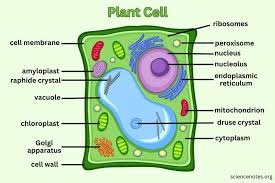
Plant cells: have a cell wall made of cellulose, chloroplast for photosynthesis, and a large central vacuole
Animal cells: lack cell walls and chloroplast and have smaller vacuoles
Nutrition
Plant cells: autotrophs, making their own food through photosynthesis
Animal cells: heterotrophs, consuming other organisms for food
Growth
Plant cells: exhibit indeterminate growth (they can grow throughout their lives)
Animal cells: exhibit determinate growth (they reach a certain size and stop)
Motility
Plant cells: sessile (fixed in one place)
Animal cells: motile (can move)
Response to Stimuli
Plant cells: respond more slowly, often through hormonal signals
Animal cells: have a more rapid response to stimuli due to their nervous systems
SIMILARITIES
Eukaryotic cells
Both have eukaryotic cells, meaning their cells have a nucleus and other membrane-bound organelles
Basic Life Processes
Both perform basic life processes like respiration, reproduction, and excretion
Genetic Material
Both have DNA as their genetic material
Organic Molecules
Both are composed of organic molecules like carbohydrates, proteins, lipids, and nucleic acids
Require Energy
Both need energy to carry out life processes
IDENTIFICATION
Plants: Look for features like cell walls, chloroplasts, and a large central vacuole under a microscope (leaves, stems, roots, flowers,)
Animals: lack cell walls and chloroplast. look for movement or sensory organs or complex body plans
Tonicity in plant and animal cells
Tonicity refers to the relative concentration of solutes (sugar and salts) in the fluid outside a cell compared to the concentration inside the cell. The difference in concentration affects the movement of water across the cell membrane.
Hypertonic: solution outside the cell has a higher solute concentration than inside the cell
Hypotonic: solution outside the cell has a lower solute concentration than inside the cell
Isotonic: solution outside the cell has the same concentration as inside the cell
Plant cells
Isotonic: there is no net movement of water in or out of the cell, maintaining cell shape and function.
cause: the concentration of solutes outside the cell is equal to the concentration inside the cell
Hypertonic: water moves out the cell. the cell membrane shrinks and pulls away from the cell wall
cause: the concentration of solutes outside the cell is higher than the concentration inside the cell
Hypotonic: water moves into the cell, causing it to swell and potentially burst.
cause: the concentration of solutes outside the cell is lower than the concentration inside the cell.
Animal Cells (Red Blood Cells)
Isotonic: there is not net movement of water, maintaining it’s normal shape
cause: the concentration of solutes outside the cell is equal to the concentration inside the cell
Hypertonic: water moves out of the cell, the red blood cell shrinks and becomes shriveled
cause: the concentration of solutes outside the cell is higher than the concentration inside the cell
Hypotonic: water moved into the cell, the red blood cell swells and can burst (lyse). this is because animals cells lack a cell wall to counteract the pressure
cause: the concentration of solutes outside the cell is lower than the concentration inside the cell.
Enzymes
Enzymes are super important in living systems because they speed up chemical reactions that are necessary for life
think of them as catalysts that make things happen much faster than they would on their own.
they are also reusable
after an enzyme helps a reaction occur, it’s not used up or changed
it goes right back to work, helping more reactions happen
reusability is important because it means that a smaller number of enzyme molecules can have a huge impact
Tyrosinase (enzyme)
catalyzed the oxidation of phenols, like tyrosine, and is involved in the production of melanin and other pigments
It’s responsible for turning fruits and vegetables to brown
in cosmetics, tyrosinase inhibitors are used in skin-lightening creams to reduce the production of melanin, which causes skin pigmentation
Spectrophotometers and Absorbance
Absorbance and enzyme activity are related because absorbance is often use to measure the rate of enzyme-catalyzed reactions
Higher absorbance means more product and greater enzyme activity
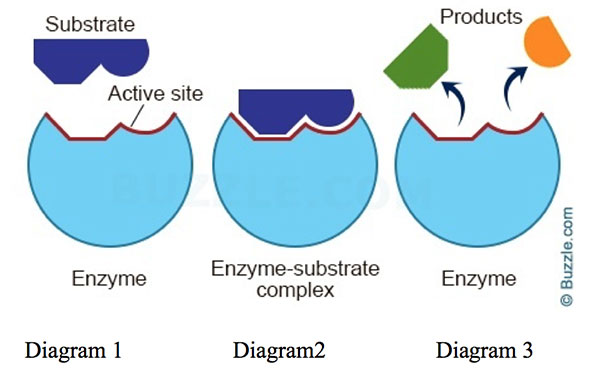
Enzyme function:
Active Site: enzymes specific region, where the substrate (the molecule the enzyme acts on) binds
Enzyme-Substrate Complex: when the substrate binds to the active site, it forms an enzyme-substrate complex (like a lock and key)
Catalysis: the enzyme then facilitates the chemical reaction, converting the substrate into product(s)
Product Release: once the reaction is complete, the product(s) are released, and the enzyme is free to catalyze another reaction
External factors affecting Enzyme function
pH: changes iin pH can alter the enzyme’s shape (denature it) by disrupting the ionic and hydrogen bonds, ultimately affecting its activity and efficiency.
Temperature: increased temperatures generally enhance enzyme activity up to a certain point, after which excessive heat can lead to denaturation, rendering the enzyme ineffective.
Competitors: substances that inhibit or enhance enzymes' actions can affect their efficiency, competing with substrates for binding sites and potentially leading to decreased reaction rates.
Inhibitors:
non-competitive inhibitors: these substances bind to an enzyme at a location other than the active site, causing a change in the enzyme's shape and thereby reducing its activity regardless of substrate concentration.
uncompetitive inhibitors: these inhibitors bind only to the enzyme-substrate complex, preventing the complex from releasing products, which can lead to increased substrate affinity and a decrease in the overall rate of reaction.
Pyrocatechol
can act as a substrate or inhibitor depending on the enzyme involved
it can be a substrate for enzymes like catechol oxidase, where it gets oxidized. however it might inhibit other enzymes by competing for the active site or causing structural changes
Hydroquinone
can act as an inhibitor
used as a reducing agent and can interfere with enzymatic reactions by reducing essential enzyme components or by acting as a competitive inhibitor
Tyrosine
a substrate for certain enzymes and can be an inhibitor for others
depends on the enzyme’s active site
Phenylthiourea (PTU)
PTU is a known inhibitor, particularly for copper-containing enzymes
inhibits enzymes like tyrosinase by binding to the copper in the enzymes active site, preventing the enzyme from binding to its substrate
Energy Metabolism
Reaction for Cellular respiration
C6H12O6 + 6O2 —→ 6CO2 + 6H2O + Energy (ATP)
Glucose + oxygen ——> Carbon Dioxide + Water + Energy
Fermentation
(anaerobic respiration) occurs in the absence of oxygen and results in different end products, such as lactic acid in animals and ethanol in yeast.
Photosynthesis and Aerobic Respiration
Photosynthesis: use carbon dioxide and water, along with light energy, to produce glucose and oxygen
6CO2 +6H2O+ Light Energy —→ C6H12O6 + 6O2
Aerobic Respiration: uses glucose and oxygen to produce carbon dioxide and water, releasing energy in the process
DNA and BLAST
DNA
Friedrich Miescher:
discovery, 1869: isolated a substance from the nuclei of white blood cels, which he called nuclein
first identification of DNA as a distinct molecule
Oswald Avery, Colin MacLeod, and Maclyn McCarty
discovery, 1944: demonstrated that DNA, not protein, is the genetic material responsible for the transfer of genetic information in bacteria
provided direct evidence that DNA is the molecule of heredity
James Watson and Francis Crick
discovery, 1953: with significant contributions from Rosalind Franklin and Maurice Wilkins, determined the double helix and structure of DNA
revolutionized biology, providing a clear understanding of how DNA could carry and transmit genetic information
Rosalind Franklin and Maurice Wilkins
discovery: franklin’s X-ray diffraction images of DNA provided critical data for Watson and Crick’s model
BLAST (Basic Local Alignment Search Tool) is a bioinformatics algorithm used to compare biological sequences, helping in identifying similarities and differences among DNA, RNA, or protein sequences.
Processes
Replication: DNA replicated is the process of copying the DNA molecule to produce two identical DNA strands
Initiation: The DNA double helix unwinds at specific locations called origins of replication
Elongation: DNA polymerase enzyme adds complementary nucleotides to each original strand, creating new strands
Termination: Replication continues until the entire DNA molecule has been copies, resulting in two identical DNA molecules
Transcription: process of synthesizing RNA from a DNA template
Initiation: RNA polymerase binds to a promoter region on the DNA and unwinds the DNA strands
Elongation: RNA polymerase synthesizes a single strand of RNA by adding complementary RNA nucleotides to the growing RNA chain
Termination: transcription continues until RNA polymerase reaches a termination signal, at which point the RNA strand is released
Translation: process of synthesizing proteins from mRNA
Initiation: the ribosome assembles around the mRNA, and the first tRNA molecule binds to the start codon on the mRNA
Elongation: tRNA molecules bring amino acids to the ribosome, where the ribosome facilitates the formation of peptide bonds between the amino acids, creating a polypeptide chain
Termination: the process continues until a stop codon on the mRNA is reached, at which point the ribosome releases the completes protein
Differences between RNA and DNA
Nucleotide composition
DNA: contains deoxyribose sugar, has the bases adenine (A), guanine (G), cytosine (C), and thymine (T).
RNA: contains ribose sugar, has the bases adenine (A), guanine (G), cytosine (C), and uracil (U) instead of thymine.
Process of replication and components
DNA Replication:
Process: DNA is replicated to produce two identical DNA strands.
Initiation: The DNA double helix unwinds at origins of replication.
Elongation: DNA polymerase adds complementary nucleotides to each strand.
Termination: Replication continues until the entire DNA molecule is copied.
Components:
DNA polymerase: enzyme that synthesizes new DNA strands.
Helicase: unwinds the DNA double helix.
Primase: synthesizes RNA primers to initiate DNA synthesis.
Ligase: joins Okazaki fragments on the lagging strand.
Transcription and components
Process: RNA is synthesized from a DNA template.
Initiation: RNA polymerase binds to a promoter region on the DNA and unwinds the DNA strands.
Elongation: RNA polymerase synthesizes a single-stranded RNA molecule by adding complementary RNA nucleotides.
Termination: Transcription continues until RNA polymerase reaches a termination signal, releasing the RNA strand.
Components:
RNA polymerase: enzyme that synthesizes RNA.
Promoter: DNA sequence where RNA polymerase binds to initiate transcription.
Transcription factors: proteins that help RNA polymerase bind to the promoter.
Translation and components
Process: Proteins are synthesized from mRNA.
Initiation: The ribosome assembles around the mRNA, and the first tRNA molecule binds to the start codon.
Elongation: tRNA molecules bring amino acids to the ribosome, where peptide bonds are formed between the amino acids.
Termination: Translation continues until a stop codon is reached, releasing the completed protein.
Components:
Ribosomes: site of protein synthesis.
mRNA: carries the genetic code from DNA to the ribosomes.
tRNA: brings amino acids to the ribosome.
Amino acids: building blocks of proteins.
DNA extraction reagents and functions
Lysis Buffer: ruptures cell membranes to release DNA.
Protease (e.g., Proteinase K): digests proteins, including DNases that could degrade DNA.
Salt (e.g., NaCl): helps to precipitate DNA by neutralizing the negative charge of the DNA phosphate backbone.
Ethanol or Isopropanol: precipitates DNA out of solution.
TE Buffer (Tris-EDTA): maintains DNA stability by controlling pH and chelating divalent cations that can catalyze DNA degradation.
Mutations and Sickle Cell Anemia
Cause: Sickle cell anemia is caused by a point mutation in the β-globin gene on chromosome 11.
What it looks like: The mutation results in the replacement of glutamic acid (hydrophilic) with valine (hydrophobic) at the sixth position of the β-globin protein.
Type of mutation: This is a missense mutation—specifically, a single nucleotide substitution from adenine to thymine (A>T) in the DNA, which leads to a change in the amino acid sequence.
DNA sequencing activity terminology
Primer: A short, single-stranded DNA sequence used to initiate DNA synthesis.
Template DNA: The strand of DNA that serves as a guide for synthesizing a complementary strand.
dNTPs (deoxynucleotide triphosphates): The building blocks of DNA (dATP, dGTP, dCTP, dTTP).
ddNTPs (dideoxynucleotide triphosphates): Chain-terminating nucleotides (ddATP, ddGTP, ddCTP, ddTTP) used in Sanger sequencing. Lacking a 3'-OH group, they stop DNA synthesis when incorporated.
DNA Polymerase: An enzyme that synthesizes new DNA strands.
Electrophoresis: A technique used to separate DNA fragments by size.
DNA Blast activity results
Query Sequence: Your input DNA sequence.
Subject Sequence: The sequence from the database that matches your query.
E-value: The probability that the match occurred by random chance. Lower E-values indicate more significant matches.
Percent Identity: The percentage of identical nucleotides between the query and subject sequences.
Alignment Length: The length of the aligned region between the query and subject sequences.
Biotech I: DNA Fingerprinting
RFLP and how produced
RFLP (Restriction Fragment Length Polymorphism) is a technique used to identify variations in DNA sequences by analyzing the lengths of DNA fragments produced by restriction enzymes.
Production:
DNA Isolation: DNA is extracted and purified from a sample.
Restriction Digestion: DNA is digested with restriction enzymes that cut the DNA at specific recognition sequences.
Gel Electrophoresis: The DNA fragments are separated by size using agarose gel electrophoresis.
Southern Blotting: The DNA fragments are transferred from the gel to a membrane.
Hybridization: The membrane is incubated with a labeled probe that is complementary to a specific DNA sequence.
Detection: The labeled probe is detected, revealing the RFLP pattern.
How restriction enzymes are named and function
Naming:
The first letter comes from the genus of the bacteria, the second two letters from the species, and the fourth letter (if present) from the strain of the bacteria. Roman numerals are used to indicate the order in which the enzymes were discovered in that strain.
Example: EcoRI is derived from Escherichia coli, strain RY13, and it was the first restriction enzyme isolated from this strain.
Function:
Restriction enzymes recognize specific DNA sequences (recognition sites) and cut the DNA at or near those sites. These enzymes are crucial for DNA fingerprinting and genetic engineering.
How restriction enzymes work - Conceptual and visual (know / visualize how the cuts are made)
Conceptual:
Restriction enzymes bind to DNA at their specific recognition sites. Once bound, they cleave the DNA phosphodiester backbone either to produce sticky ends (staggered cuts) or blunt ends (straight cuts).
Visual:
Visualize the enzyme approaching a DNA strand, recognizing a specific sequence, and then making a precise cut, either symmetrically (blunt ends) or asymmetrically (sticky ends).
EcoRI palindrome sequence
The EcoRI recognition sequence is 5'-GAATTC-3'
The complementary sequence is 3'-CTTAAG-5'
It cuts the DNA strand in a staggered manner, producing sticky ends
Restriction enzymes and reagents used in lab
Restriction Enzymes:
EcoRI
HindIII
BamHI
Reagents:
Restriction Buffer: Provides the optimal conditions (pH, salt concentration) for enzyme activity.
DNA samples: The DNA to be digested.
Nuclease-free water: To adjust the reaction volume.
Loading Dye: Added to DNA samples before electrophoresis to visualize migration.
Agarose gel electrophoresis set up and theory
Setup:
Prepare the Agarose Gel: Mix agarose powder with a buffer solution (e.g., TAE or TBE), heat until dissolved, and pour into a casting tray with a comb to create wells.
Prepare DNA Samples: Mix DNA samples with loading dye.
Load Samples: Carefully load the DNA samples into the wells of the gel.
Run the Gel: Place the gel in an electrophoresis chamber filled with buffer, apply an electric field (voltage), and run the gel until the DNA fragments have separated adequately.
Visualize DNA: Stain the gel with a DNA-binding dye (e.g., ethidium bromide or SYBR Safe) and visualize the DNA bands under UV light.
Theory:
Agarose gel electrophoresis separates DNA fragments based on their size. DNA is negatively charged due to the phosphate groups, so it migrates through the gel towards the positive electrode (anode).
Smaller fragments migrate faster and farther than larger fragments.
Reliability of DNA evidence and principles behind DNA fingerprinting
Reliability:
DNA evidence is highly reliable due to the unique genetic makeup of individuals. The chances of two unrelated individuals having the same DNA profile are extremely low.
Cell Divsion: Mitosis and Meiosis
Phases of the Cell Cycle - Mitosis and Meiosis
The cell cycle consists of:
Interphase (G1, S, G2 phases)
Mitotic phase (mitosis and cytokinesis)
Mitosis: cell division resulting in two identical daughter cells; important for growth and repair.
Meiosis: cell division resulting in four genetically different haploid daughter cells; important for sexual reproduction.
Chromosome Structure
Chromatin: DNA and protein complex that makes up chromosomes.
Sister chromatids: identical copies of a chromosome, attached at the centromere.
Centromere: region of a chromosome where sister chromatids are most closely attached.
Kinetochore: protein structure on chromatids where microtubules attach during division.
Plant Cells vs. Animal Cells – Differences in Mitosis and Meiosis
Mitosis:
In animal cells, cytokinesis involves the formation of a cleavage furrow.
In plant cells, cytokinesis involves the formation of a cell plate.
Meiosis: Generally similar processes, but plants have alternation of generations.
Stages of Mitosis – Conceptual and Visual (what separates?)
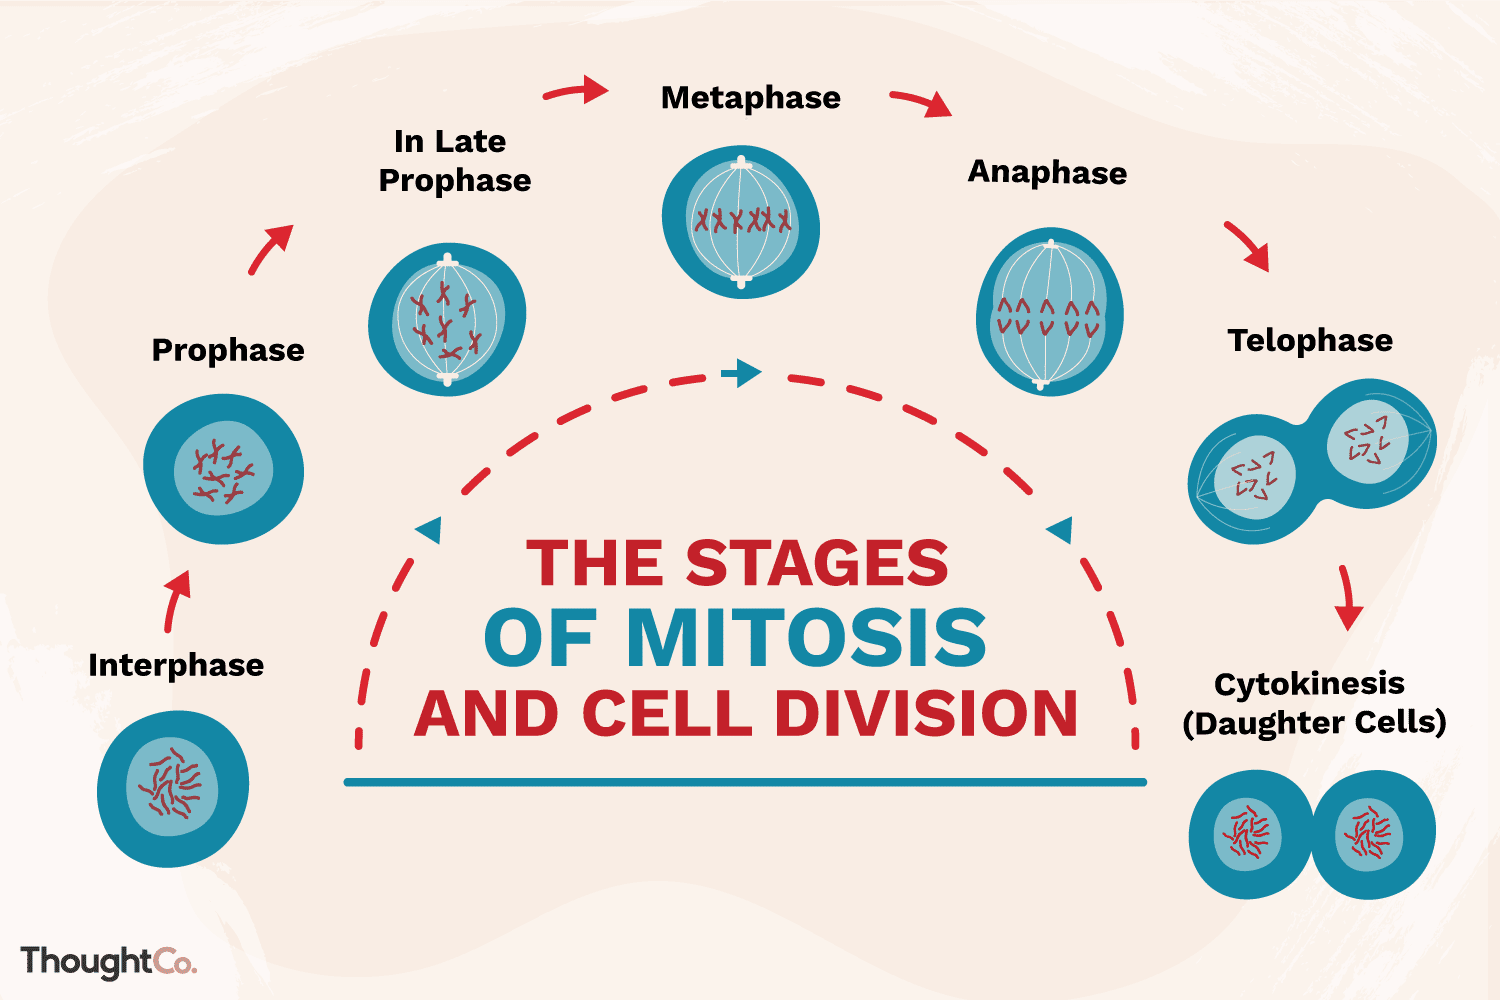
Prophase: chromosomes condense and become visible; the nuclear envelope breaks down
Prometaphase: nuclear envelope fragments, microtubules attach to kinetochores.
Metaphase: chromosomes align at the cell’s equatorial plane
Anaphase: sister chromatids separate and move to opposite ends of the cell.
Telophase: nuclear envelopes reform around each set of chromosomes
Cytokinesis: the cytoplasm divides, resulting in two separate daughter cells, each with a complete set of chromosomes.
Stages of Meiosis – Conceptual and Visual (what separates in meiosis I vs. II?)
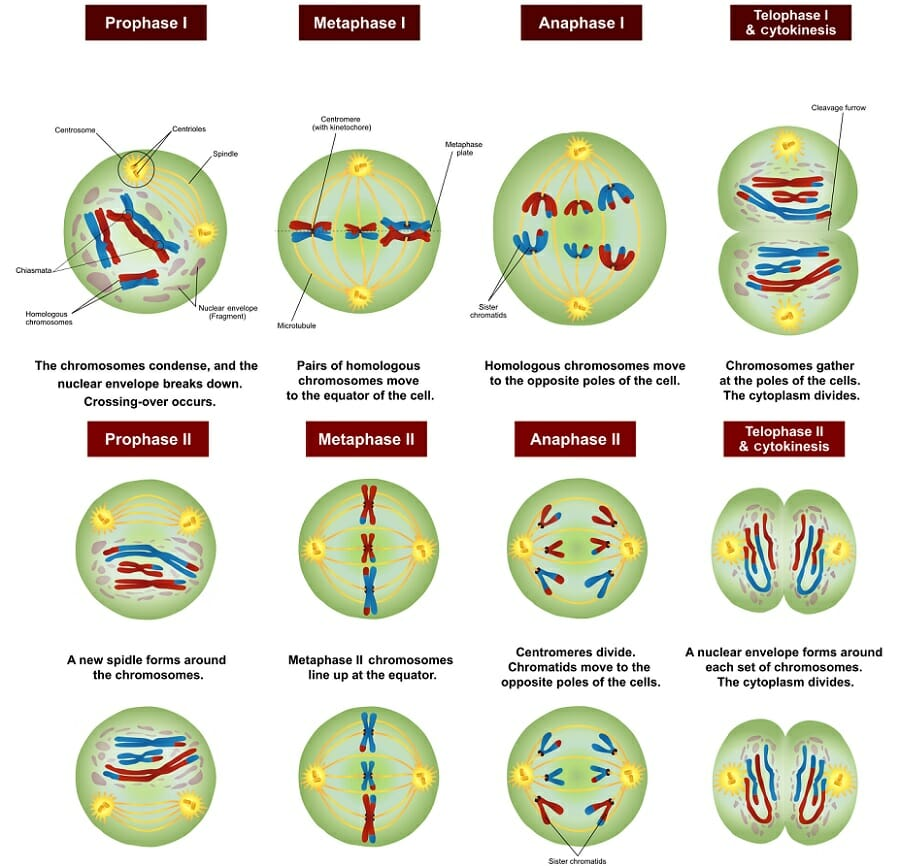
Meiosis I: homologous chromosomes separate
Prophase I: crossing over occurs.
Metaphase I: homologous pairs align at the equatorial plate.
Anaphase I: the homologous chromosomes separate and are pulled apart towards opposite poles of the cell.
Telophase I and Cytokinesis: haploid cells form; each chromosome still consists of two sister chromatids.
Meiosis II: separates sister chromatids.
Similar to mitosis, resulting in four haploid daughter cells.
Alternation of Generations and Plant Life Cycle – Conceptual and Visual
Plants alternate between diploid sporophyte and haploid gametophyte generations.
Sporophytes produce spores by meiosis; gametophytes produce gametes by mitosis.
Independent Assortment, Crossing Over, and Nondisjunction
Independent Assortment: random orientation of homologous chromosomes in metaphase I.
Crossing Over: exchange of genetic material between homologous chromosomes in prophase I.
Nondisjunction: failure of chromosomes to separate properly in meiosis I or II.
Spermatogenesis – Conceptual and Visual
Process of sperm formation in testes.
Primary spermatocytes undergo meiosis I to produce secondary spermatocytes, which undergo meiosis II to produce spermatids. Spermatids mature into sperm.
Oogenesis – Conceptual and Visual
Process of egg formation in ovaries.
Primary oocytes undergo meiosis I to produce a secondary oocyte and a polar body. If fertilized, the secondary oocyte undergoes meiosis II to produce an ootid and another polar body. The ootid matures into an ovum.
Understand and Visualize the Pipe Cleaner Set-Ups
Use pipe cleaners to model chromosomes and chromatids during different stages of mitosis and meiosis to understand their behavior and chromosome/chromatid numbers.
Mendelian Genetics
Draw a chromosome with two genes that are heterozygous/homozygous:
(Diagram would show a chromosome with alleles indicated, e.g., AaBb for heterozygous, AABB or aabb for homozygous)
Understand the definition and differences between:
Genotype: genetic makeup of an organism.
Phenotype: physical traits of an organism.
Homozygous: having two identical alleles for a gene.
Heterozygous: having two different alleles for a gene.
Dominant: allele that is fully expressed in a heterozygote.
Recessive: allele that is masked in a heterozygote.
Gene: a unit of heredity that is transferred from a parent to offspring and is held to determine some characteristic of the offspring.
Alleles: different versions of a gene.
Chromosomes: thread-like structures made of DNA molecules that contain the genes.
Identify patterns of inheritance:
Complete dominance: one allele completely masks the other.
Incomplete dominance: heterozygote shows an intermediate phenotype.
Codominance: both alleles are equally expressed in the heterozygote.
Identify blood types given alleles or a blood typing tray:
Antigens vs. Antibodies:
Antigens: substances that can trigger an immune response.
Antibodies: proteins produced by the immune system to identify and neutralize foreign objects.
Blood Types: A, B, AB, and O, arise from different combinations of alleles , , and i.
Type A: or
Type B: or
Type AB:
Type O: ii
Construct a dihybrid cross:
A cross between individuals that have different alleles for two genes of interest (e.g., AaBb x AaBb).
How to determine genotype from a pedigree chart:
Analyze patterns of inheritance to deduce genotypes of individuals in
Biotech II & III: PCR analysis and ELISA
(REVIEW BOLDED TERMS)
What is a GMO
Genetically Modified Organism: An organism whose genetic material has been altered using genetic engineering techniques.
Regulatory sequences of GMO crops
Promoters: Control when and where a gene is expressed (e.g., CaMV 35S promoter).
Terminators: Signal the end of a gene sequence (e.g., nos terminator).
Pest resistance
GMO crops can be engineered to produce proteins that are toxic to certain pests, reducing the need for pesticides (e.g., Bt corn).
PCR – Principles, Steps (what occurs in each step), What is needed
Principles: Amplifies specific DNA fragments using primers and DNA polymerase.
Steps:
Denaturation: Heat to separate DNA strands.
Annealing: Cool to allow primers to bind to target sequence.
Extension: DNA polymerase extends primers, creating new DNA strands.
What is needed:
Template DNA
Primers
DNA polymerase
dNTPs
Buffer
Interpreting test results – Given a gel result, is the test food GMO?
Compare the band sizes to controls. Presence of a GMO-specific band indicates the food is GMO.
Be able to identify the controls in the experiment.
Positive Control: Contains the target GMO sequence.
Negative Control: Does not contain the target GMO sequence.
Given a hypothetical gel results of the PCR, can you tell if the plant product is GMO or not? The plant primer should show up at 455 bp, and the GMO primer should show up at 200 bp. Look at Figure 12.1 on Page 221 to help you!
If the plant product shows a band at 200 bp (GMO primer), it is a GMO. If it shows a band at 455 bp (plant primer), it confirms plant DNA is present. If both bands are present, it is a GMO plant.
What is ELISA used for? What is the general protocol? Define terms: antigens, antibodies (primary and secondary), indirect detection, enzyme probe, substrate.
ELISA (Enzyme-Linked Immunosorbent Assay) is used to detect the presence and quantity of a specific substance (e.g., protein) in a sample.
General Protocol:
Coat: Plate is coated with the antigen.
Block: Add blocking buffer to prevent non-specific binding.
Primary Antibody: Add primary antibody that binds to the antigen.
Secondary Antibody: Add enzyme-linked secondary antibody that binds to the primary antibody.
Substrate: Add substrate that reacts with the enzyme to produce a detectable signal.
Terms:
Antigens: Substances that elicit an immune response (e.g., proteins).
Antibodies: Proteins produced by the immune system to bind to specific antigens.
-Primary Antibody: Antibody that binds directly to the antigen.Secondary Antibody: Antibody that binds to the primary antibody, linked to an enzyme.
Indirect Detection: Use of a secondary antibody to amplify the signal.
Enzyme Probe: Enzyme linked to the secondary antibody, which catalyzes a reaction to produce a detectable signal.
Substrate: Substance that is acted upon by the enzyme to produce a detectable signal.
What were the primary and secondary antibodies derived from in this experiment?
Primary antibody: Derived from an animal (e.g., mouse, rabbit) immunized with the target antigen.
Secondary antibody: Derived from an animal (e.g., goat) immunized with the primary antibody from another species.
What binds to what in ELISA?
Antigen binds to the plate.
Primary antibody binds to the antigen.
Secondary antibody binds to the primary antibody.
Enzyme probe on secondary antibody reacts with the substrate.
Evolution and Hardy Weinberg Equilibrium
Know the 5 conditions that must be met for Hardy-Weinberg equilibrium.
No mutation
Random mating:
No gene flow
No natural selection
Large population size
Be able to identify the basic mechanisms of evolution with examples.
Mutation: A change in DNA sequence (e.g., a new allele arises).
Genetic Drift: Random changes in allele frequencies due to chance events (e.g., bottleneck effect).
Gene Flow: Movement of alleles between populations (e.g., migration).
Natural Selection: Differential survival and reproduction based on heritable traits (e.g., antibiotic resistance).
Non-random mating: Selection of mates based on specific traits (e.g., sexual selection)
Use the equations p + q= 1 and p2 + 2pq + q2 = 1.
p + q = 1: Allele frequency equation, where p is the frequency of one allele and q is the frequency of the other allele.
p2 + 2pq + q2 = 1: Genotype frequency equation, where p2 is the frequency of homozygous dominant genotype, 2pq is the frequency of heterozygous genotype, and q2 is the frequency of homozygous recessive genotype.
Determine genotypic and allelic frequencies within a population
Describe the results of each simulation from the lab procedures and which basic mechanisms of evolutions it represents.
Simulations will demonstrate how different mechanisms (e.g., selection, drift, gene flow) alter allele frequencies over time.
Describe the effects of genetic drift, natural selection, gene flow and founder effect on allelic frequencies of a population.
Genetic Drift: Can cause random fluctuations in allele frequencies, especially in small populations.
Natural Selection: Can increase the frequency of beneficial alleles and decrease the frequency of harmful alleles.
Gene Flow: Can introduce new alleles into a population, potentially altering allele frequencies.
Determine if a population is in Hardy-Weinberg equilibrium
Compare the observed genotype frequencies with the expected frequencies under Hardy-Weinberg equilibrium. Use a Chi-square test to determine if the differences are statistically significant.