PRE-CAL | ETA Reviewer
Conic Section
curves obtained by the intersection of a plan and a double cone with two identical nappes/cone (one part of a double cone)
Circle
occurs when the plane is horizontal
Ellipses
occurs when the (tilted) plane intersects only one cone to form a bounded curve.
looks like an oval/oblong
Parabola
occurs when the (tilted) plane intersects only one cone to form an unbounded curve.
Hyperbola
when the plane intersects both cones to form two unbounded curves, also known as branches
Circles
A graph where all the points are equidistant from a fixed point called the center.
Equation
(x-h)² + (y-k)² = r²
(x, y) are the coordinates of the variable points on the actual graph.
(h,k) are the coordinates of the fixed point of the circle.
r is the radius, which is the distance of a variable point to the fixed point.
Graphing (using the standard equation)
Identify the center of the circle and graph it based on the constants in the equation.
Identify the radius, or r, by getting the square root of the value on the right side of the equation.
Identify and graph the 4 points by moving r units up, down, left, and right from the center.
Connect all the points properly to form a circular shape.
Semicircle Equations
Derivation
To derive the equations, you must solve for a certain variable depending on how the semicircle opens.
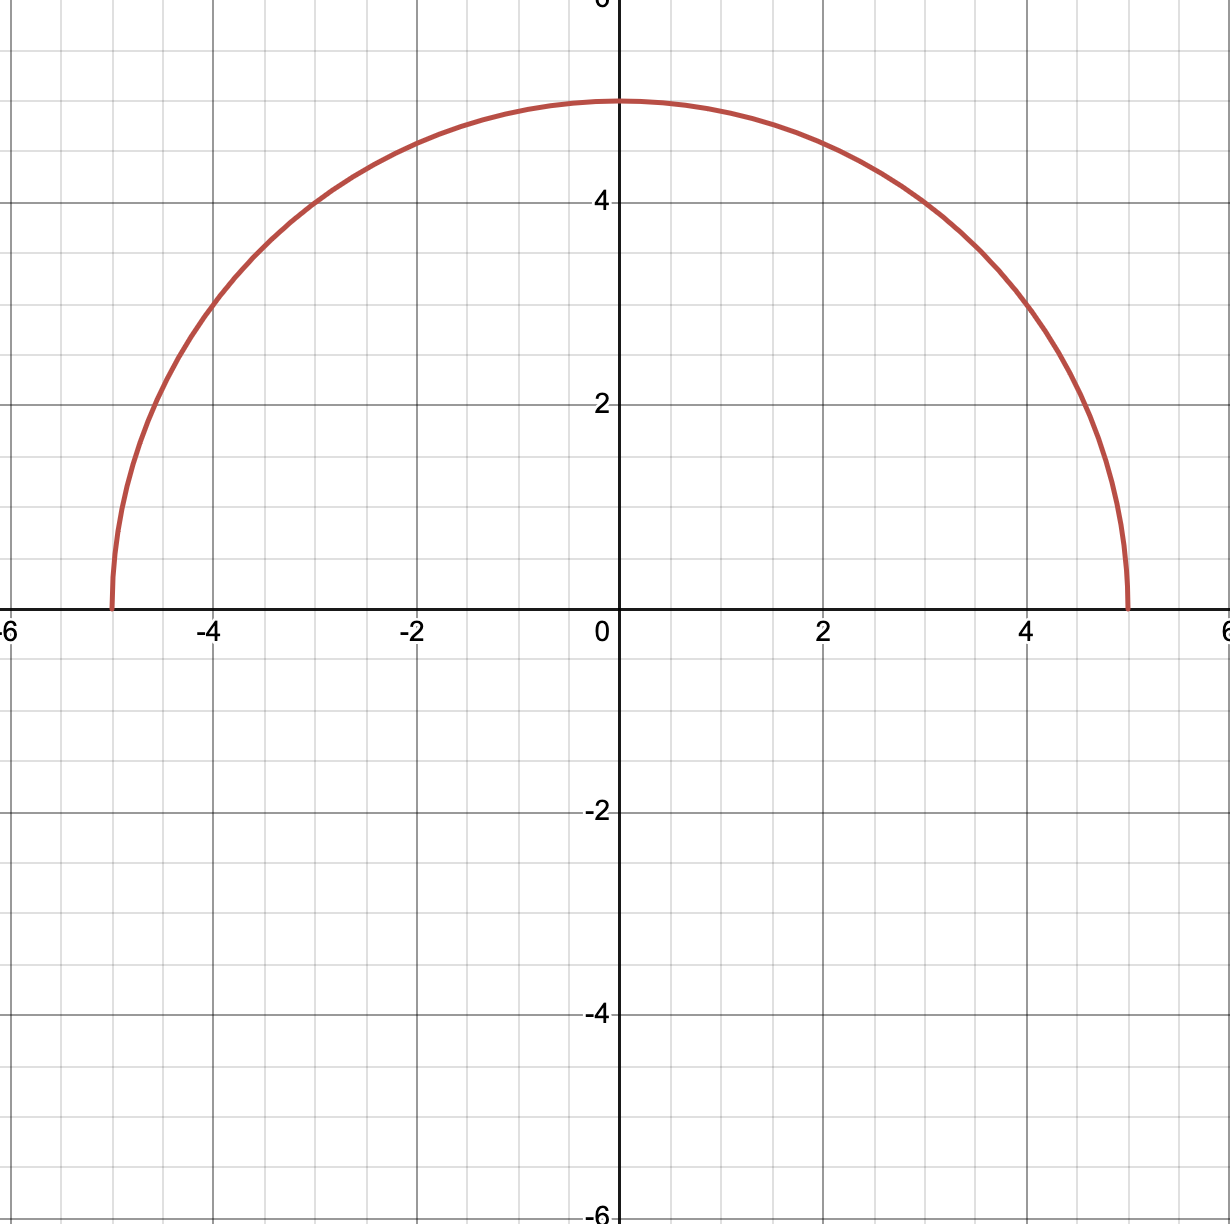
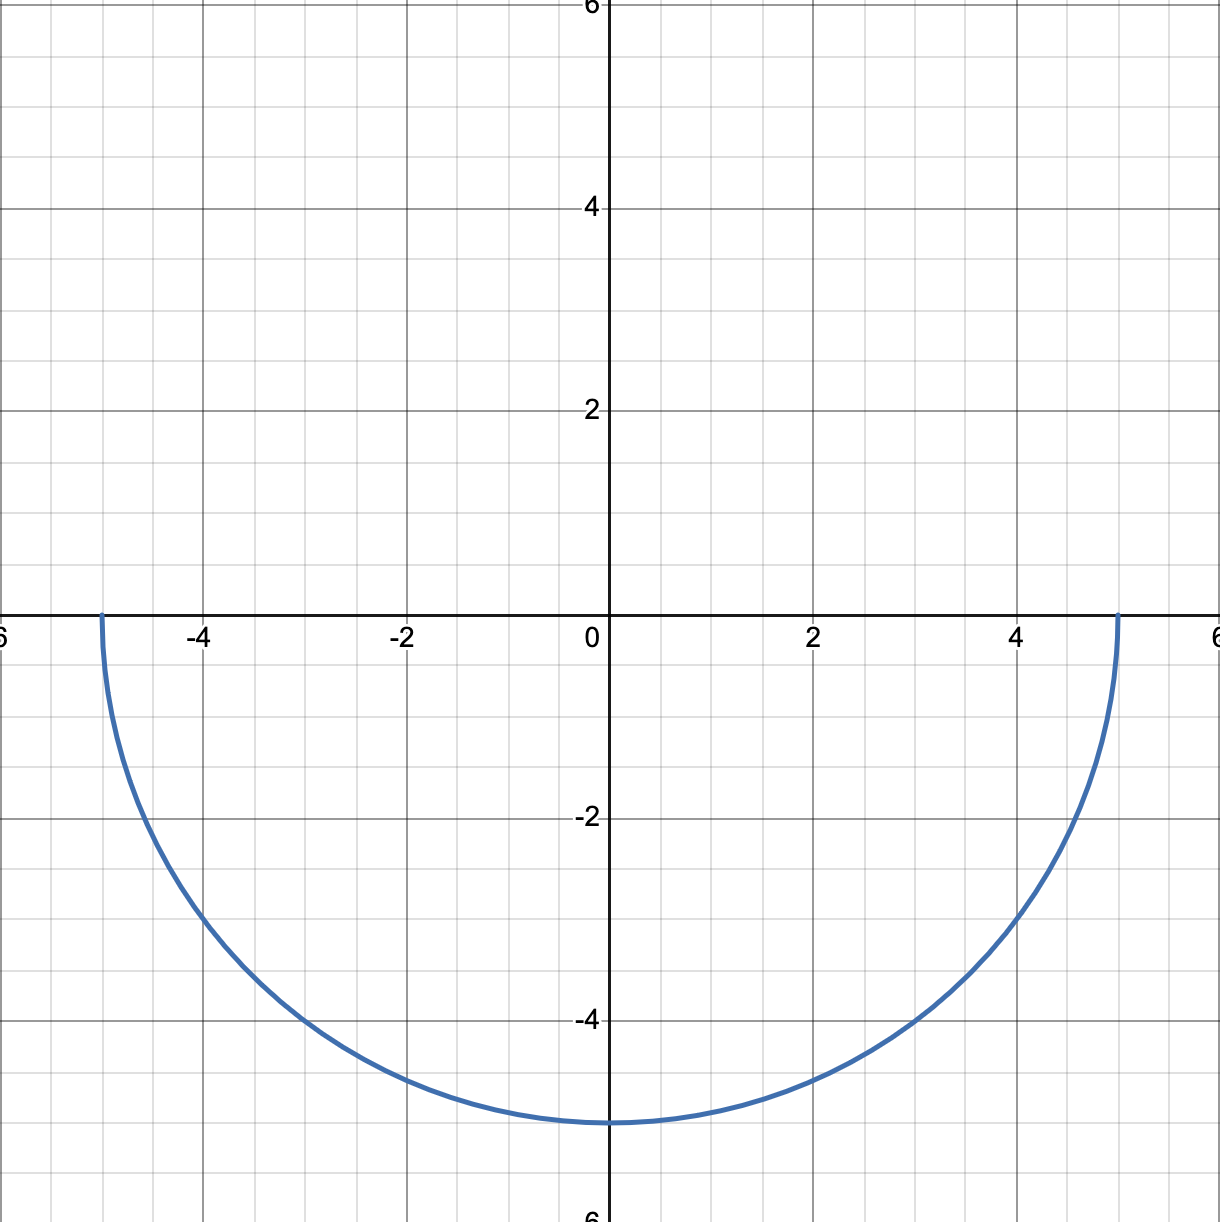
If it is the circle’s the upper half or lower half, solve for y.
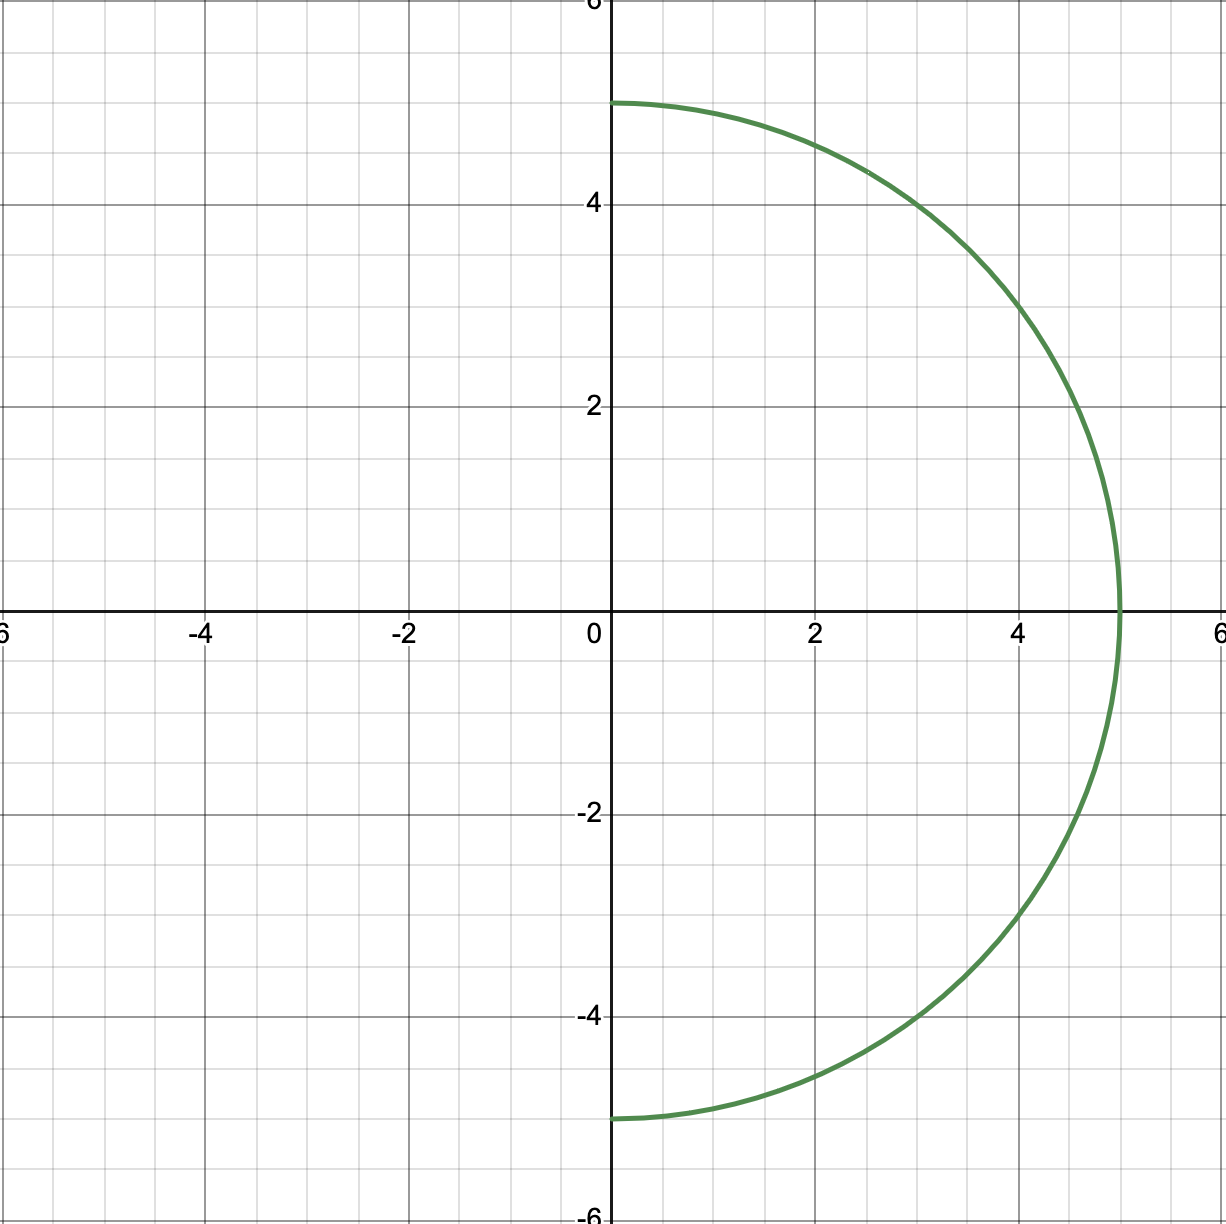
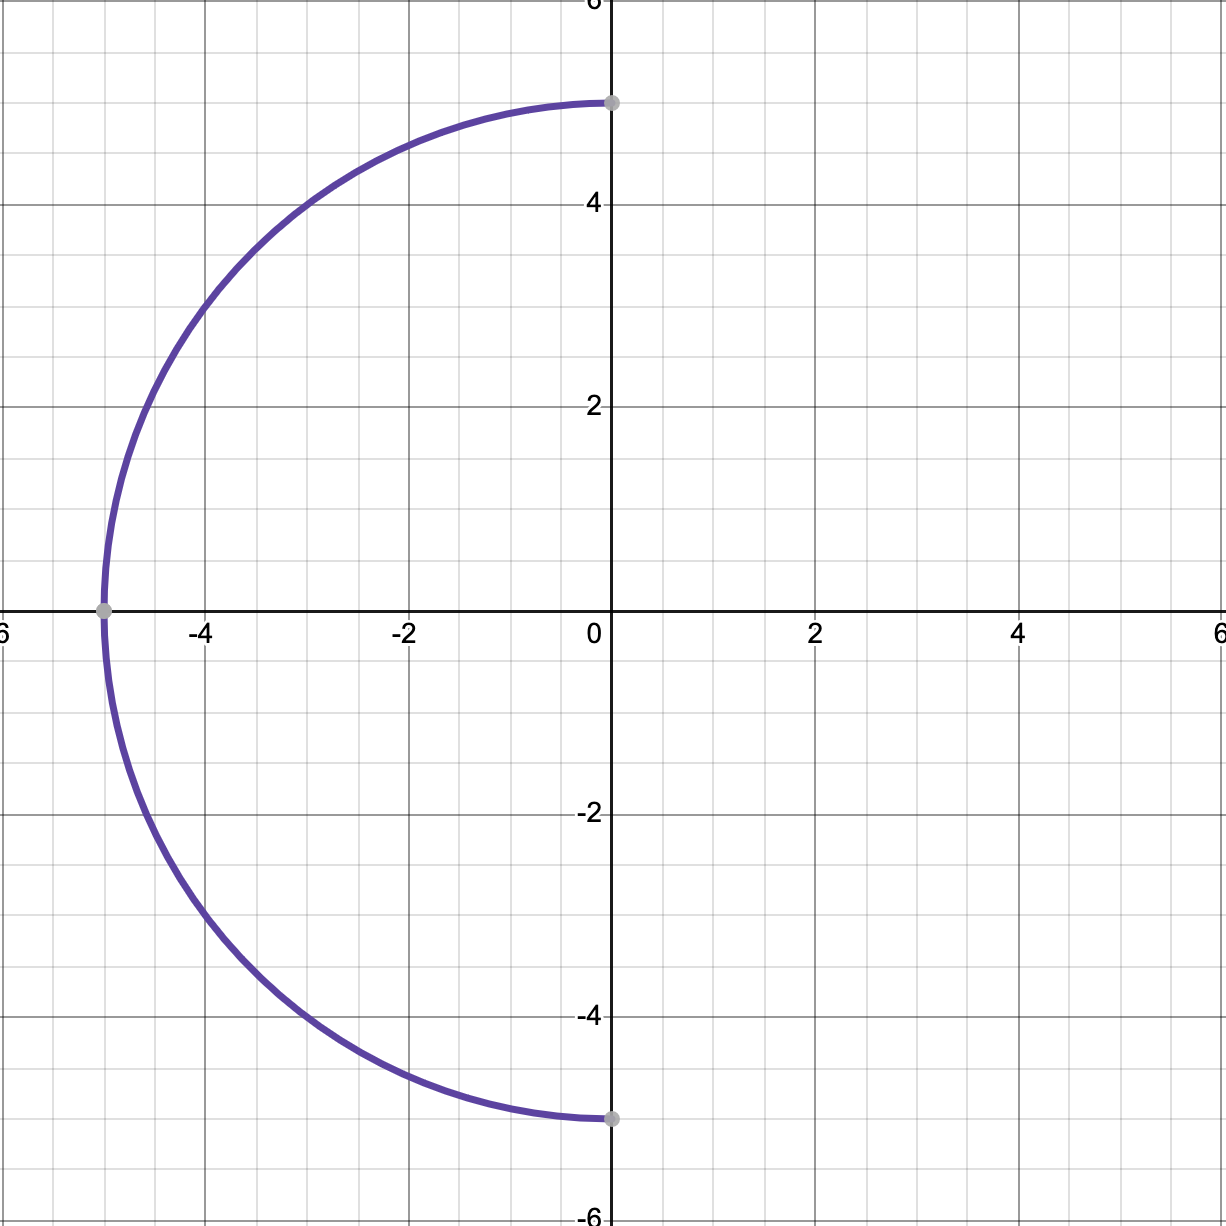
If it is the circle’s left half or right half, solve for x.
Equations & Graphs
Note: Graphs have the center at the origin and a radius at 5.
Upper Half

Lower Half

Right Half

Left Half

Graphing (using the standard equation)
Follow the same rules for graphing circles but only graph the half identified based on the equation.
Ellipse
a set of points wherein their respective sums of the distances from two fixed points are equal or constant.
Properties
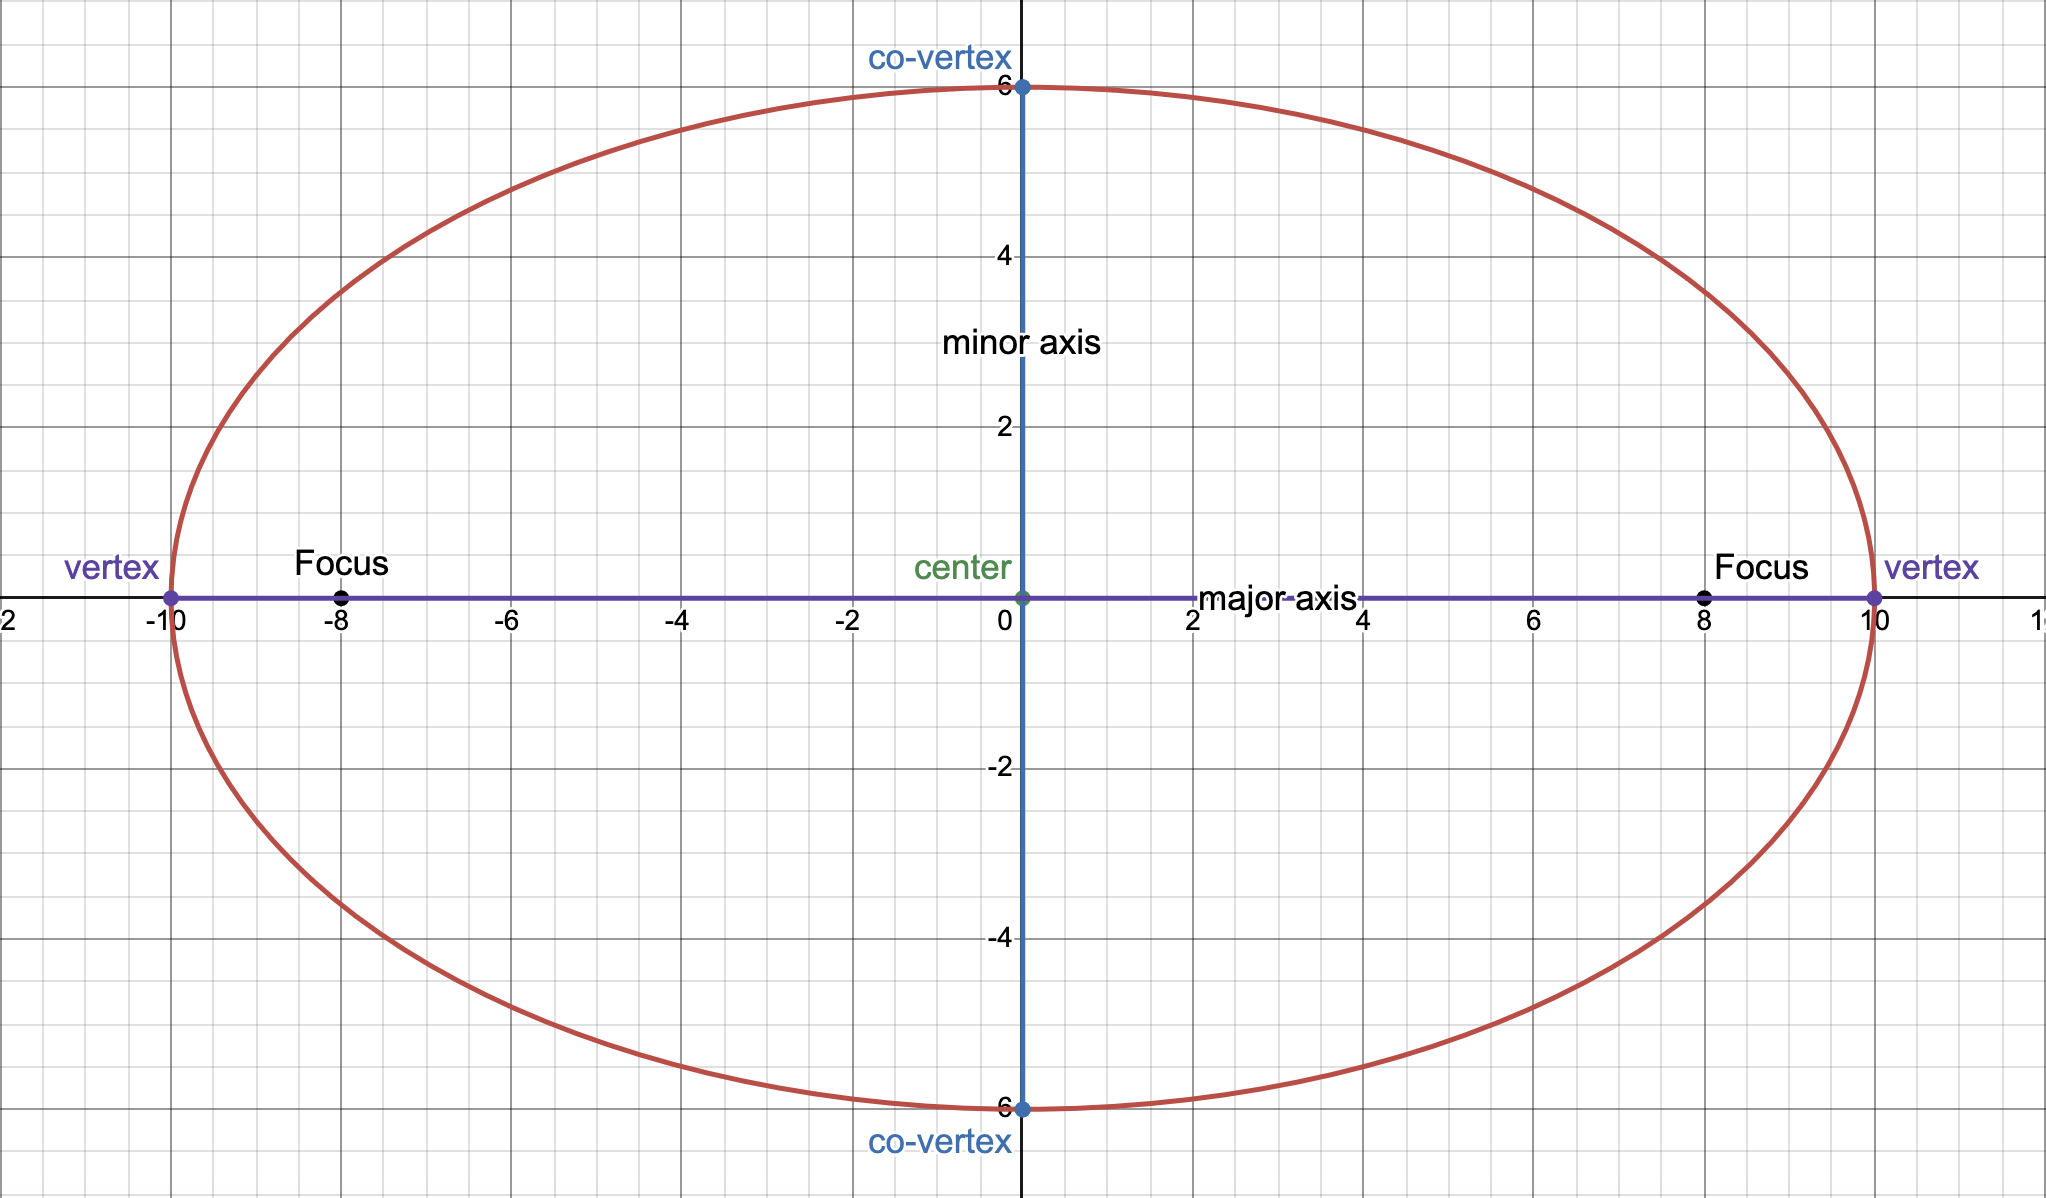
Focus: the fixed points described in the definition above.
Center: the fixed point that is the point of symmetry of the ellipse.
Minor axis: the shortest diameter and axis of symmetry of the ellipse.
Major axis: the longest diameter and axis of symmetry of the ellipse.
Vertices: the points on the ellipse that are the endpoints of the major axis.
Co-vertices: the points on the ellipse that are the endpoints of the minor axis.
Formula
Variables
a is the distance from the center to a vertex
2a is the length of the major axis.
b is the distance form the center to a co-vertex
2b is the length of the minor axis
c is the distance from the center to the focus.
Pythagorean Relationship
a is equal to the line segment connecting a focus and a co-vertex, forming the hypotenuse of a right triangle.
a² = b² + c²
c² = a² - b²
General Equation
|PF1| + |PF2| = 2a
PF is the distance between a point on the ellipse and the focus.
a is the distance from the center to one end point of the major axis.
Standard Equation for HORIZONTAL ELLIPSES
(x-h)²/a² + (y-k)²/b² = 1; wherein a > b
Standard Equation for VERTICAL ELLIPSES
(x-h)²/b² + (y-k)²/a² = 1; wherein a > b
Graphing an Ellipse
Latus Rectum
a chord passing through a focus, is perpendicular to the major axis, and has its endpoints located on the ellipse
Length is equal to 2b²/a units.
How to Graph an Ellipse Using the Standard Equation
Identify the center of the ellipse and graph it based on the constants in the equation.
Identify and graph the first two points by getting the square root of the denominator of the first term.
Identify the coordinates of the endpoints by adding and subtracting this value from the x-coordinate of the center.
The y-coodinate stays the same.
Graph the points on the Cartesian plane.
In a horizontal ellipse, it should form the major axis. The graphed points would have been the vertices.
In a vertical ellipse, it should form the minor axis. The graphed points would have been the co-vertices.
Identify and graph the next two points by getting the square root of the denominator of the second term.
Identify the coordinates of the endpoints by adding and subtracting this value from the y-coordinate of the center.
The x-coodinate stays the same.
Graph the points on the Cartesian plane.
In a horizontal ellipse, it should form the minor axis.
In a vertical ellipse, it should form the major axis.
Identify the value of c by getting the square root of a² - b².
Identify the foci.
In a horizontal ellipse, add and subtract the solved value from the x-coordinate of the center.
In a vertical ellipse, add and subtract the solved value from the y-coordinate of the center.
Identify the end points of latera recta.
Get the distance of the foci to the endpoint of a latus rectum by solving for b²/a.
Graph the points on the Cartesian plane.
In a horizontal ellipse, add and subtract the solved value from the y-coordinate of the foci.
In a vertical ellipse, add and subtract the solved value from the x-coordinate of the foci.
Connect all the points properly to form an oblong shape.
Parabola
It is the set of all points that are equidistant from a fixed point called the foci and a fixed line called the directrix.
A parabola devours its focus.
Properties
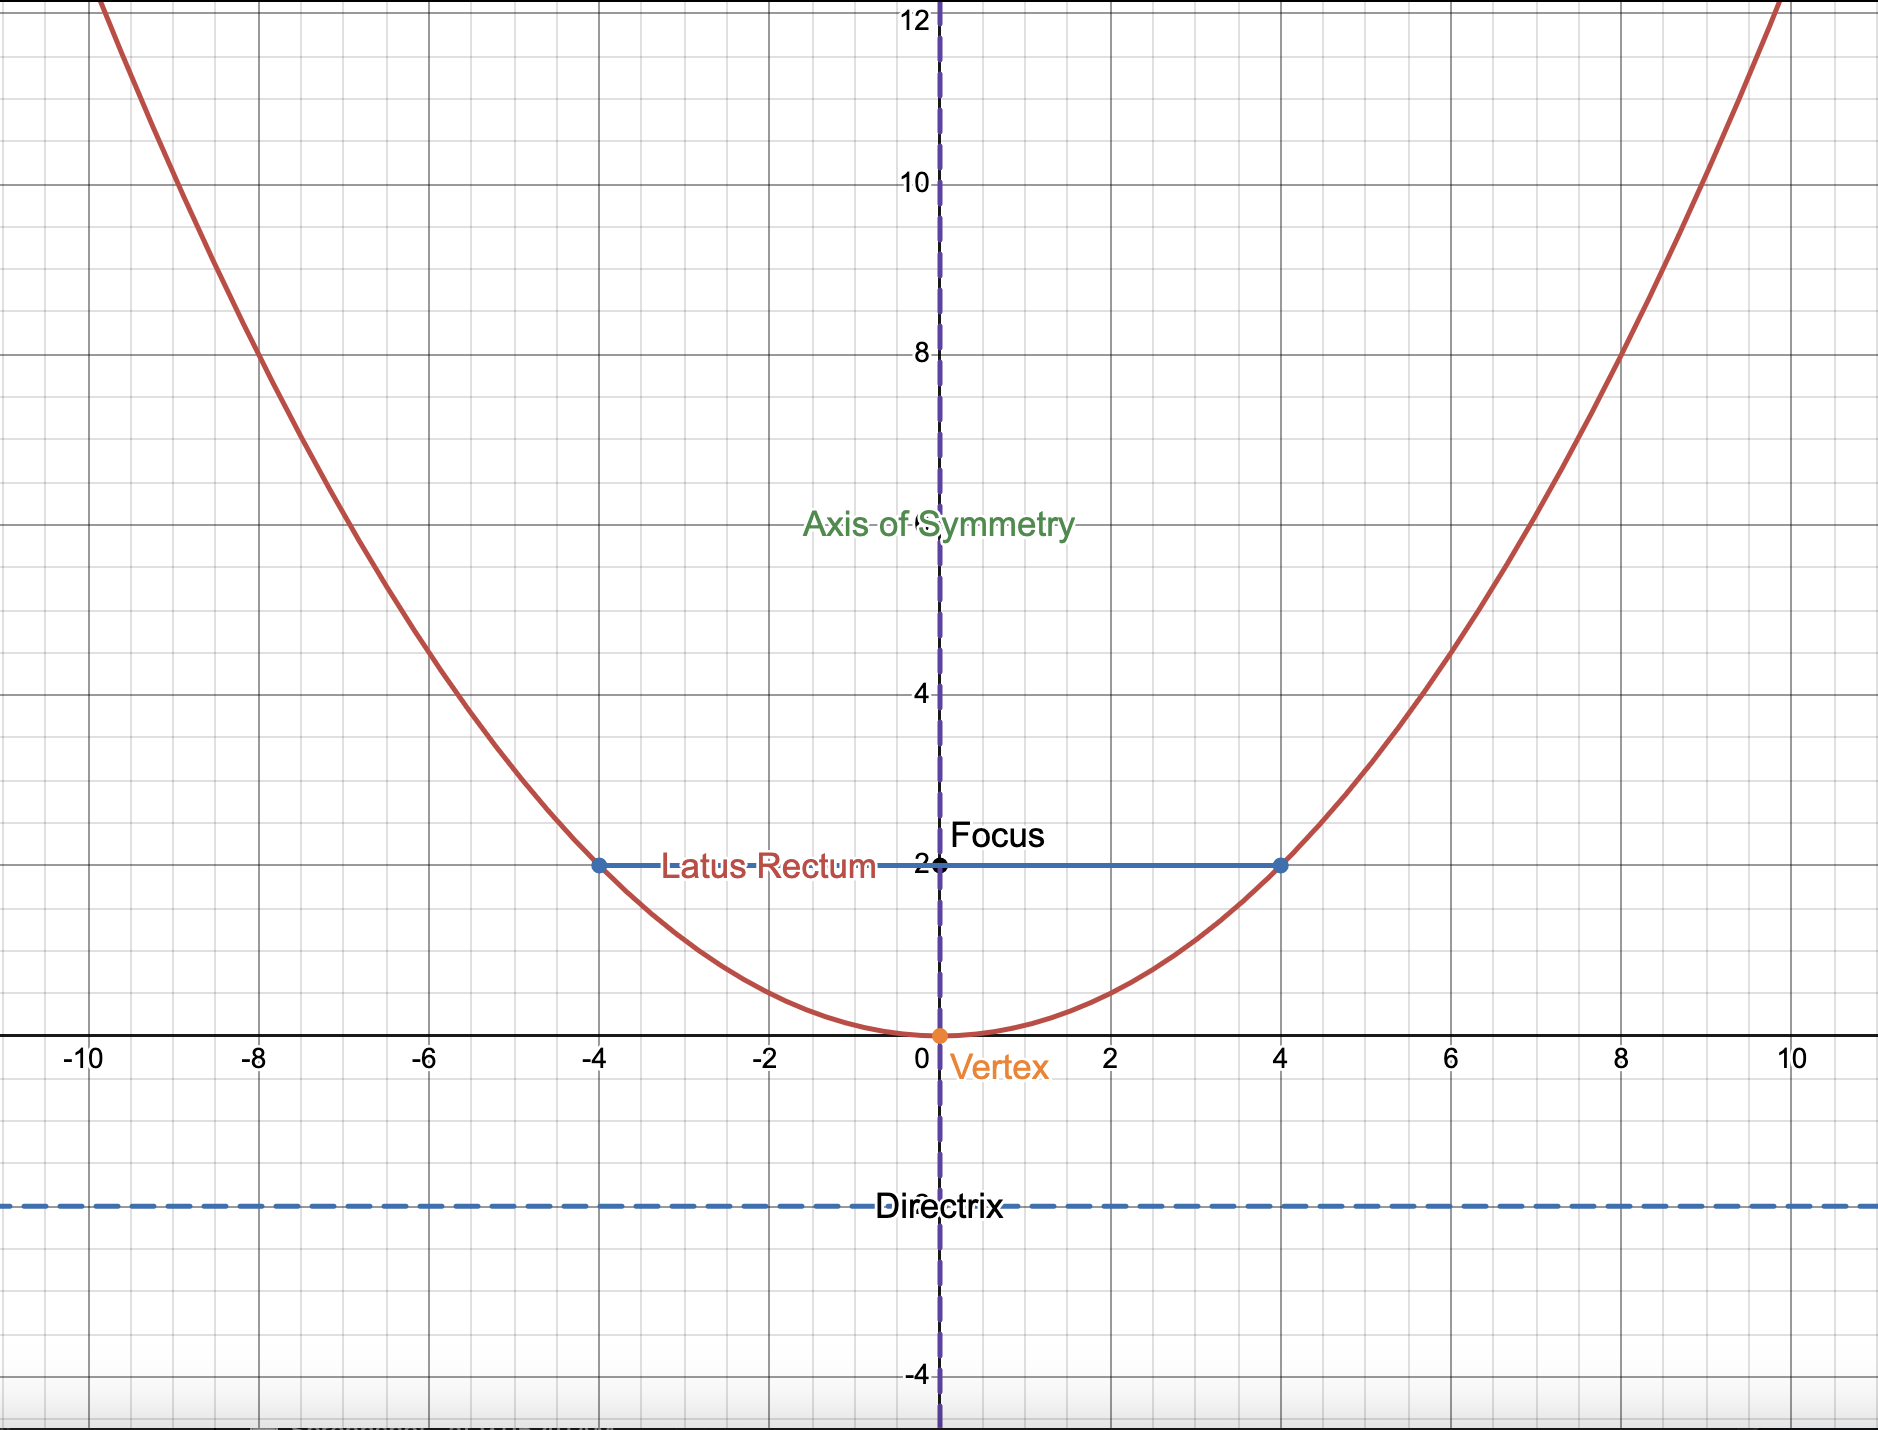
Focus: the fixed point described in the definition above.
Directrix: the fixed line that is the point of symmetry of the ellipse.
Axis of Symmetry: the line that divides the parabola into two equal parts.
Vertex: The point in the parabola where the direction changes.
Latus Rectum: the point that passes through the focus and is perpendicular to the axis of symmetry.
Focal Width: the distance between the vertex and the focus & the distance between the vertex and the directrix
Formula
Variables
Let p be the focal width.
Let (h,k) the coordinates of the vertex.
Standard Equation for Parabolas Opening UPWARDS
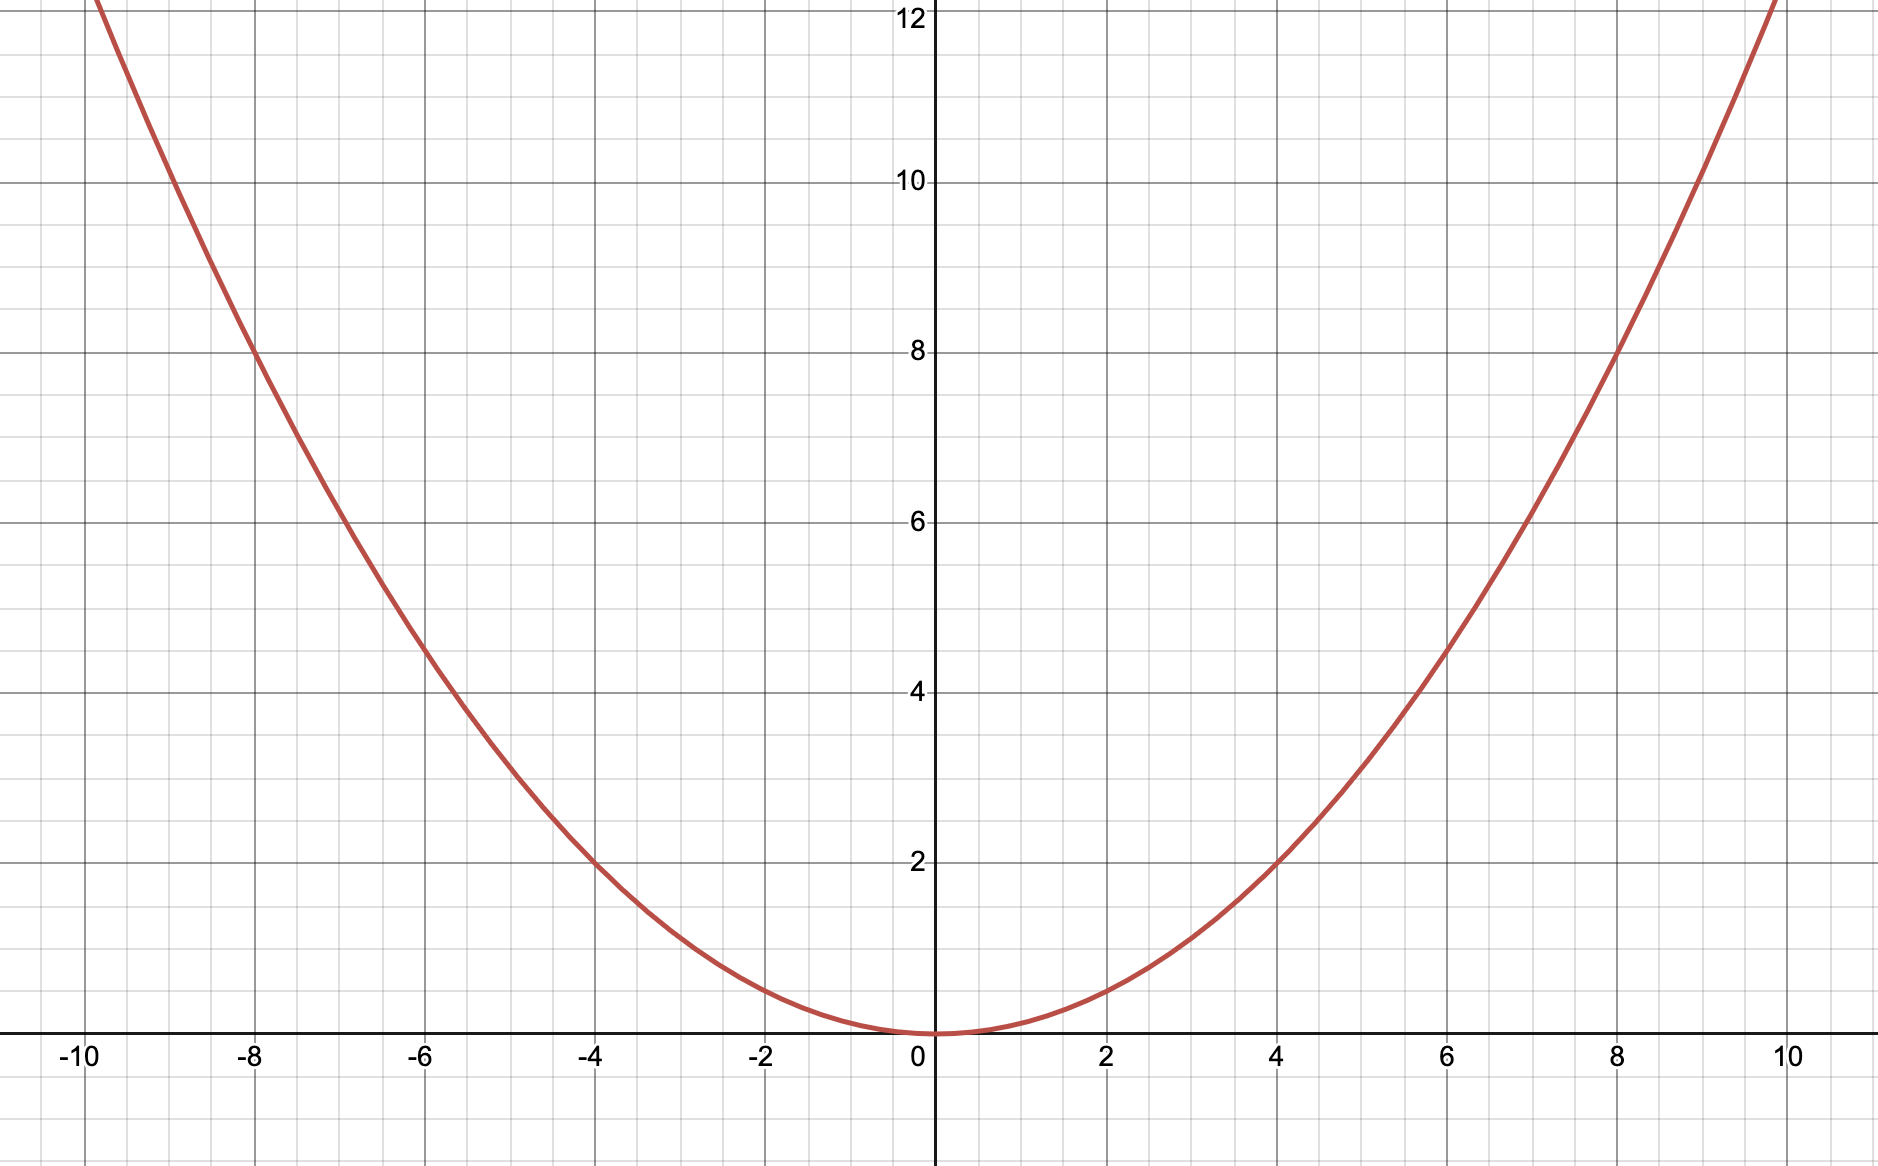
(x-h)²=4p(y-k)
Standard Equation for Parabolas Opening DOWNWARDS
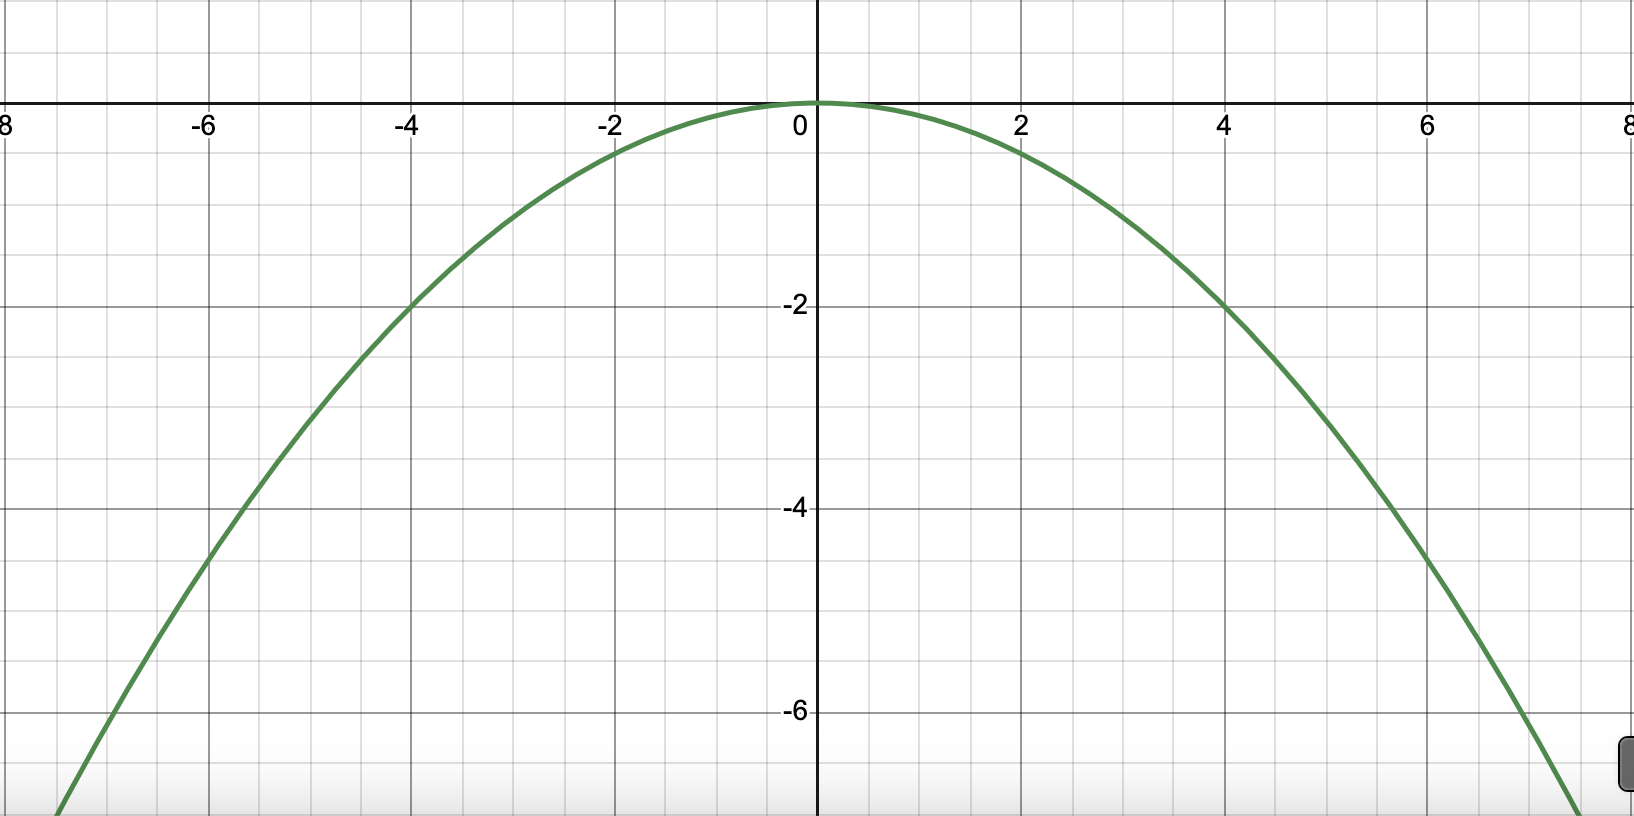
(x-h)²=-4p(y-k)
Standard Equation for Parabolas Opening TO THE RIGHT
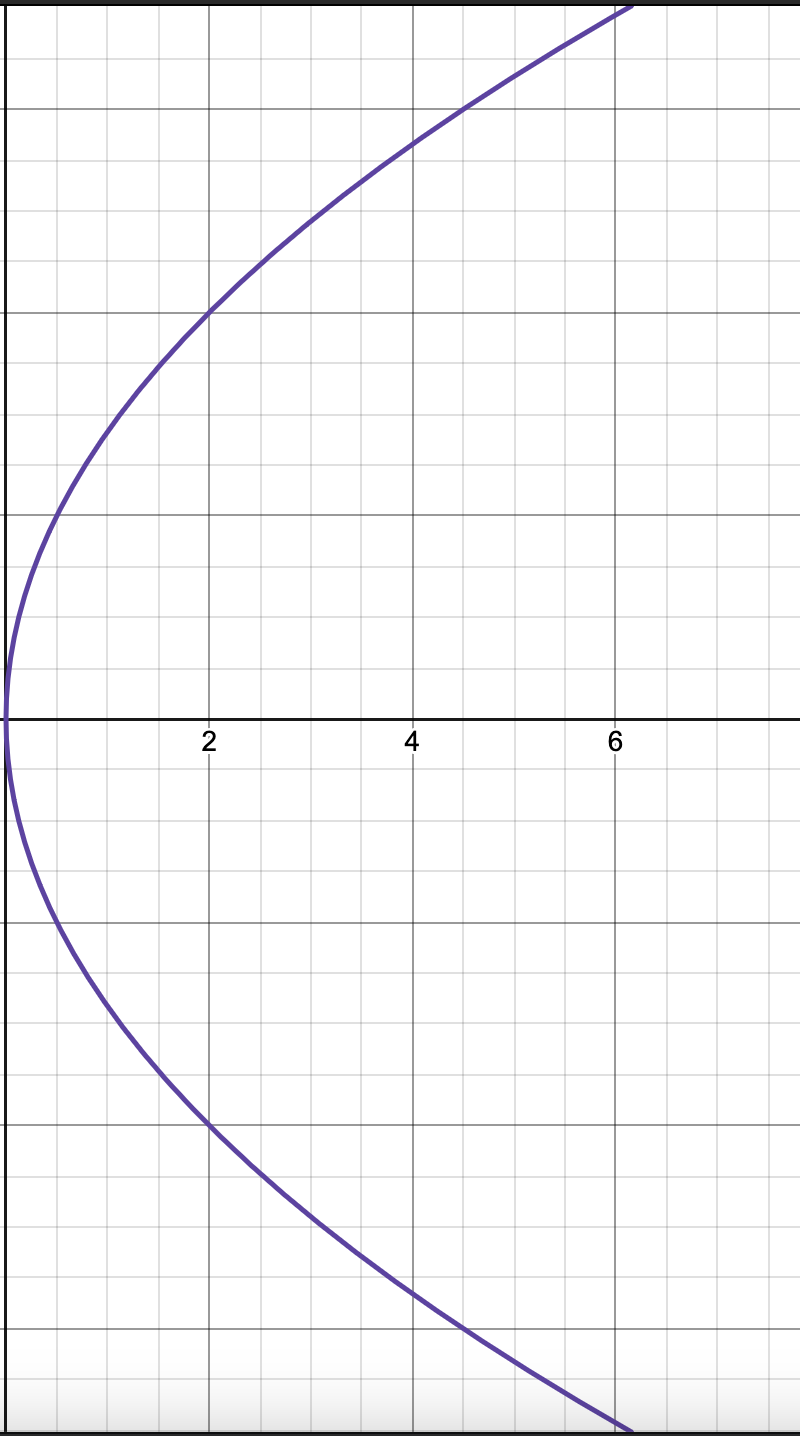
(y-k)²=4p(x-h)
Standard Equation for Parabolas Opening TO THE RIGHT
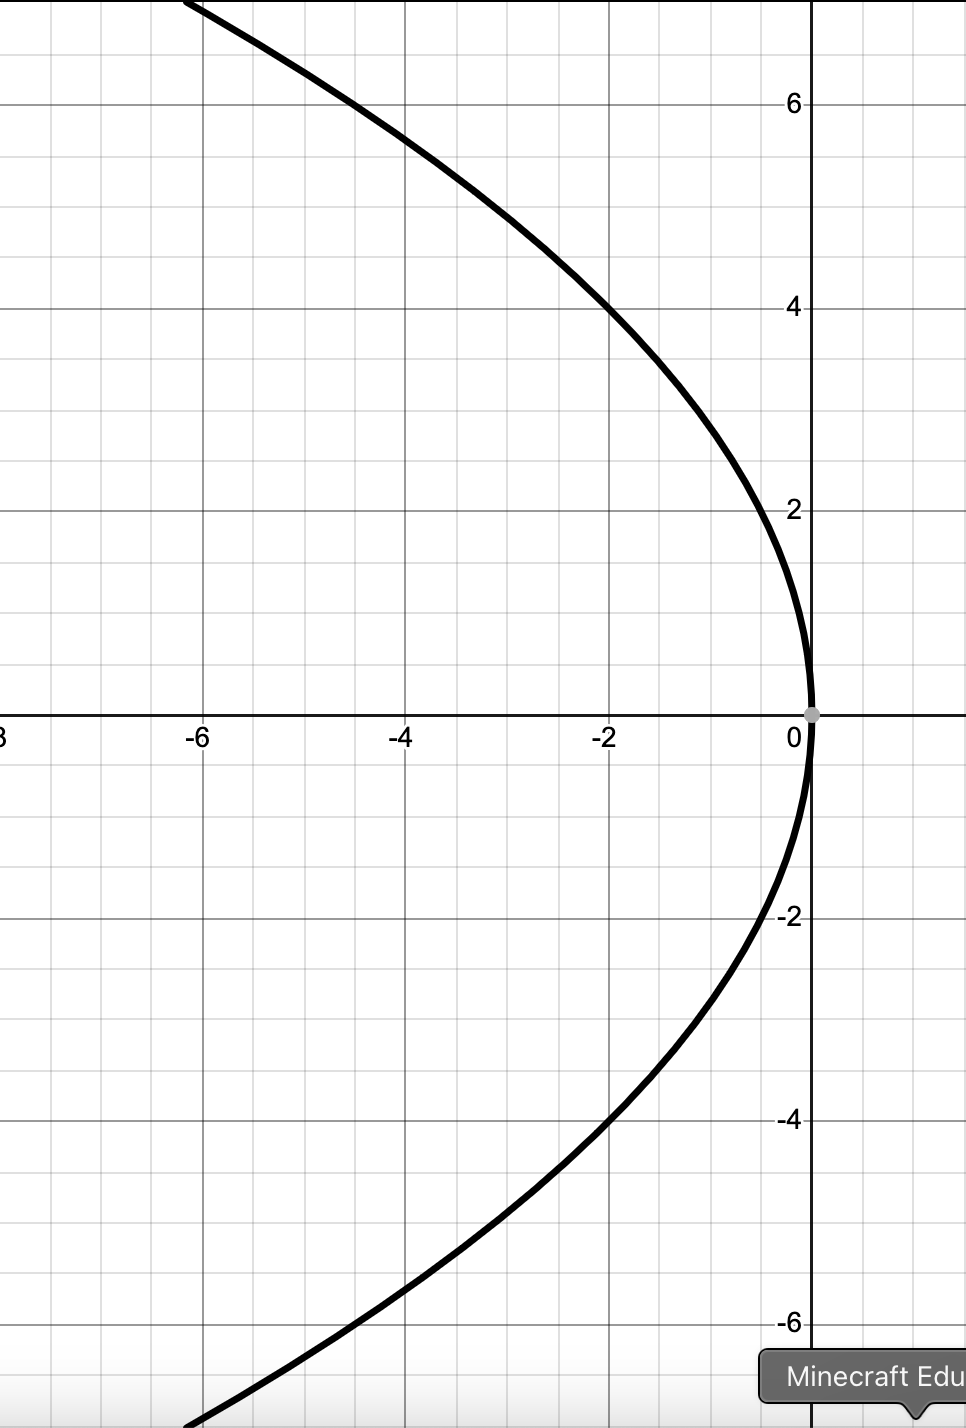
(y-k)²=-4p(x-h)
Graphing a Parabola
Identify the vertex of the parabola and graph it based on the constants in the equation.
Check how the parabola opens, or its concavity, based on the equation.
Solve for p based on the equation.
Graph the focus by moving p units from the vertex in the direction the parabola opens.
If it opens upwards, graph the focus p units above the vertex.
If it opens downwards, graph the focus p units below the vertex.
If it opens to the right, graph the focus p units to the right of the vertex.
If it opens to the left, graph the focus p units to the left of the vertex.
Graph the directrix by moving p units from the vertex in the direction opposite the one the parabola opens.
If it opens upwards, graph the horizontal directrix p units below the vertex.
If it opens downwards, graph the horizontal directrix p units above the vertex.
If it opens to the right, graph the vertical directrix p units to the left of the vertex.
If it opens to the left, graph the vertical directrix p units to the right of the vertex.
Graph the endpoints of the latus rectum.
If it opens upwards or downwards, graph the endpoints 2p units to the left and to the right of the focus.
If it opens to the left or to the right, graph the endpoints 2p units below and above the focus.
Connect the vertex and the endpoints of the latus rectum in one continuous curved line, ensuring it opens in the right direction and devours the focus.
Hyperbola
set of all points, the difference of whose distances from two fixed points called foci is constant.
Properties
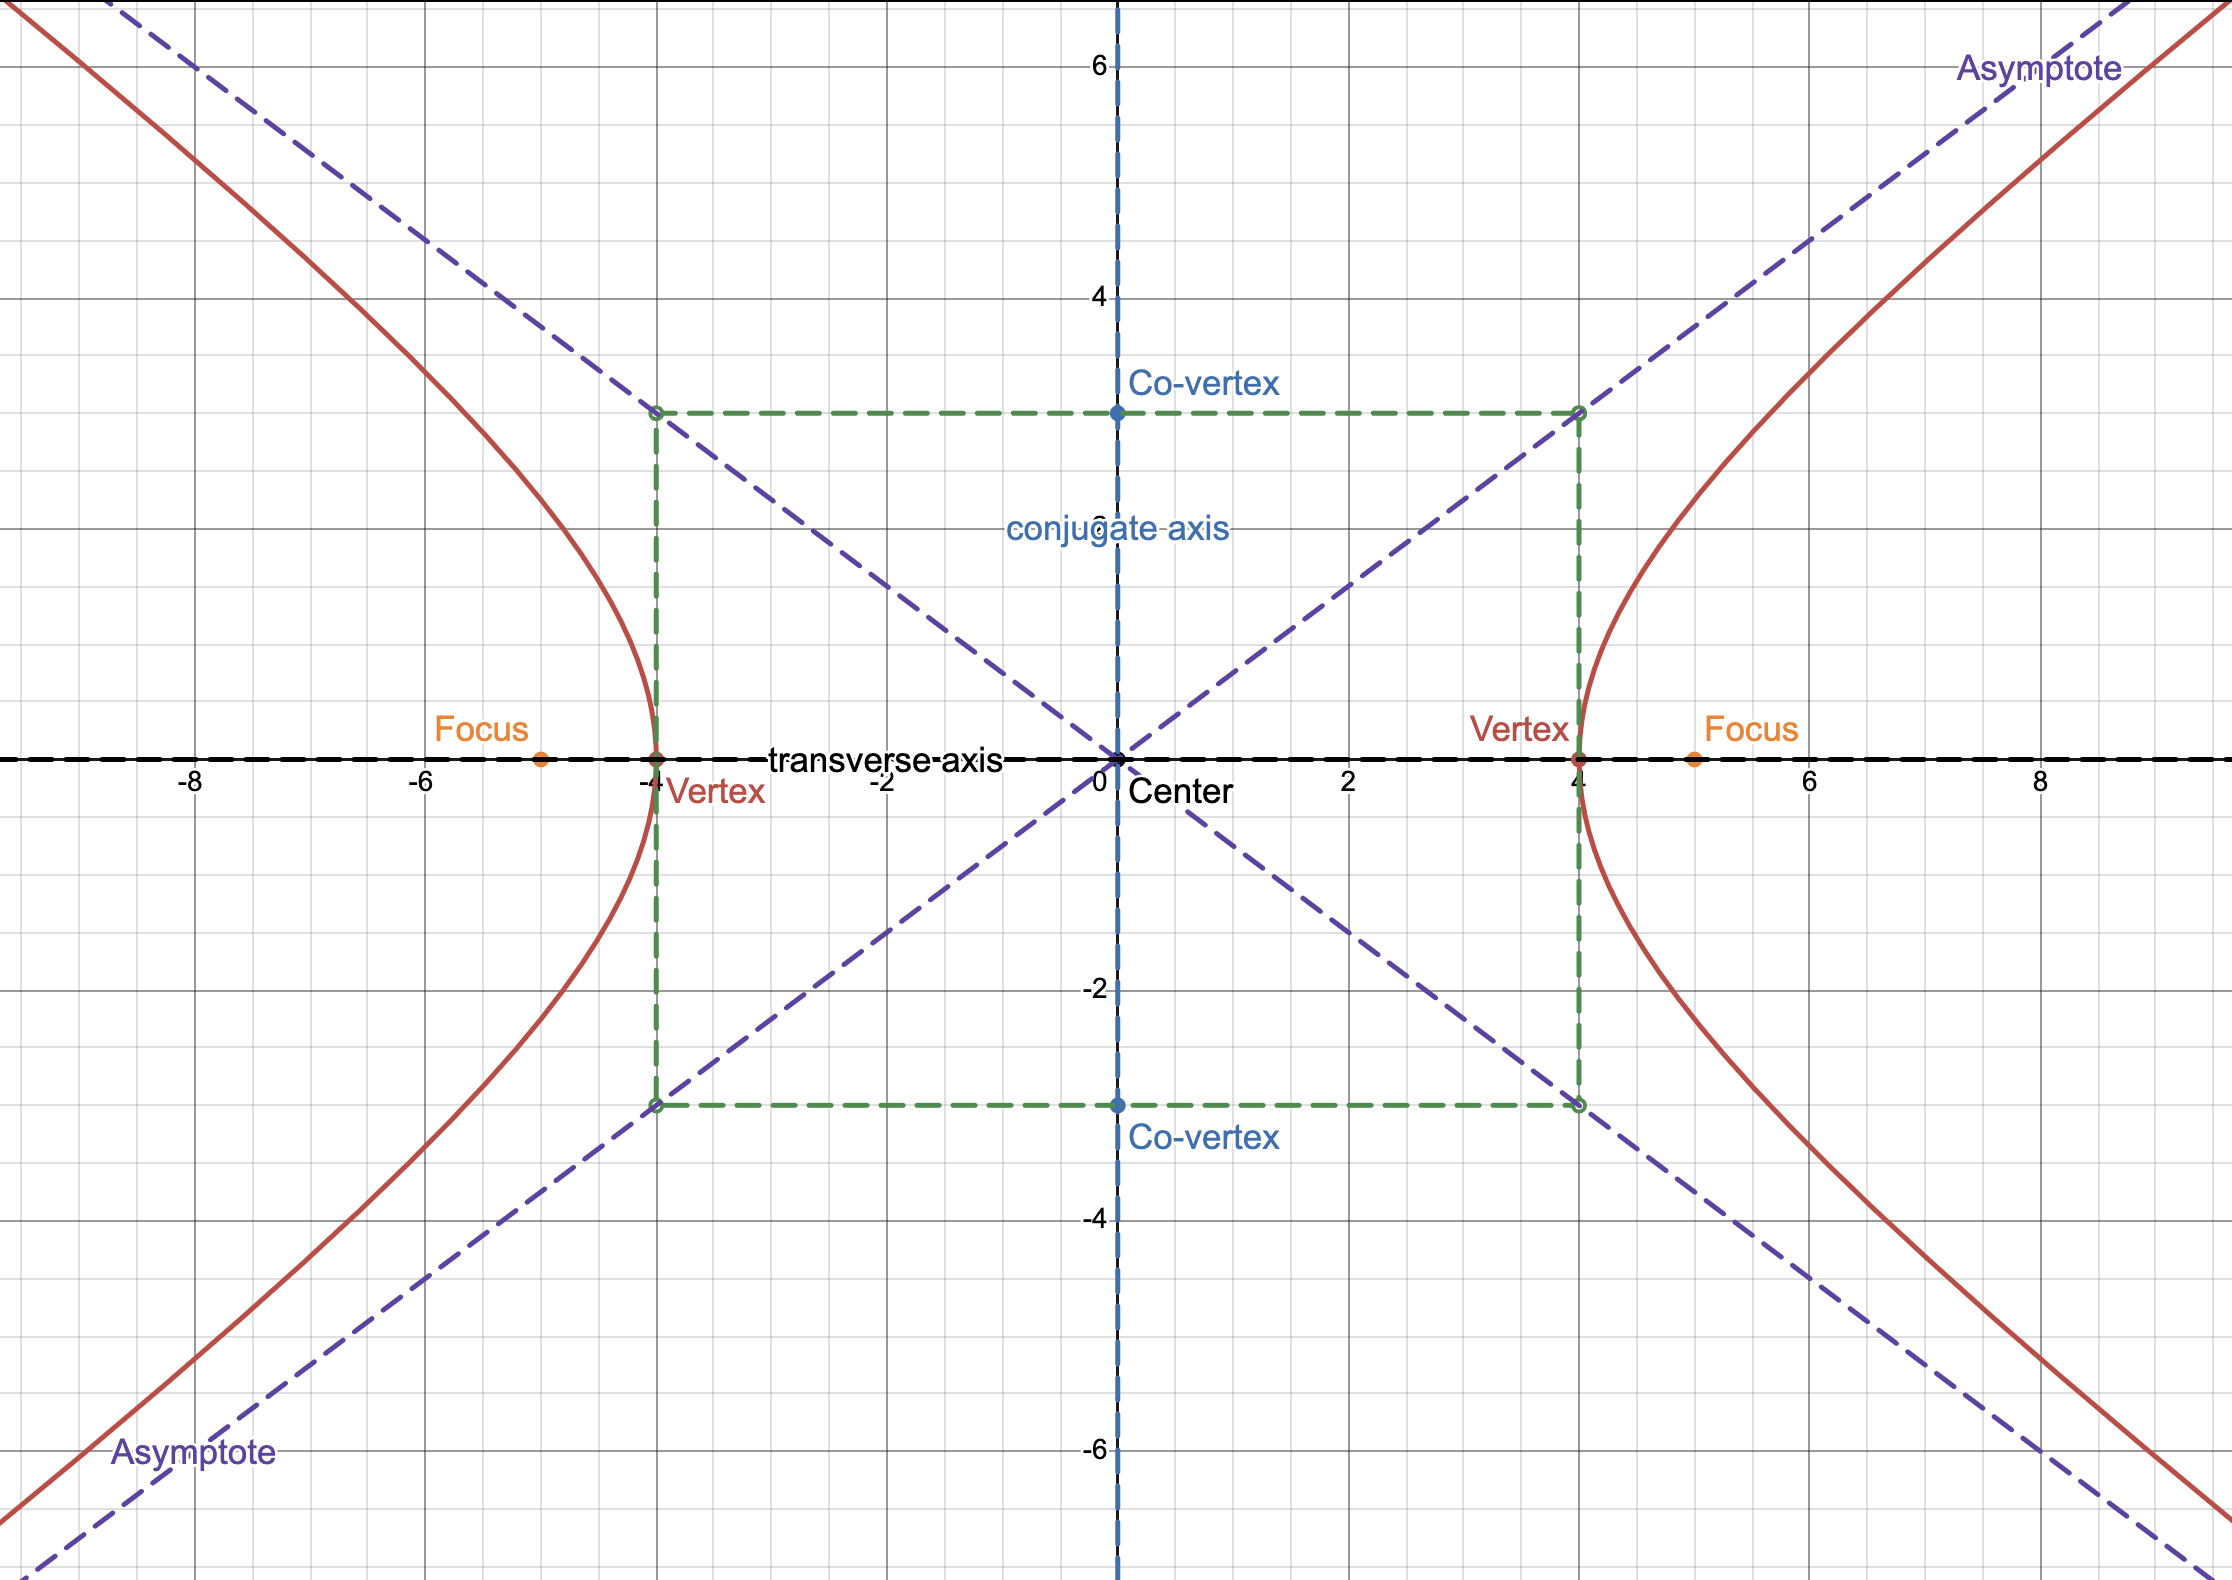
Foci: the fixed points described in the definition above.
Vertices: the points where the direction of the curves of the hyperbola changes.
Transverse axis: the chord that passes through the vertices.
Center: the midpoint of the transverse axis.
Conjugate Axis: the chord that connects the co-vertices, is perpendicular to the transverse axis.
Co-vertices: points that are b units away from the center.
Asymptotes: the diagonal lines that the curves of hyperbola approach but never intersect.
Formula
Variables
a is the distance from the center to a vertex
2a is the length of the transverse axis.
b is the distance form the center to a co-vertex
2b is the length of the conjugate axis
c is the distance from the center to the focus.
Pythagorean Relationship
Create a rectangle such that the sides pass through the vertices and co-vertices.
c is equal to the line segment connecting the center and a corner, creating part of the asymptotes. It forms the hypotenuse of a right triangle, where a and b are the sides.
c² = a² + b²
Equations
General Equation
|PF1| - |PF2| = 2a
PF is the distance between a point on the ellipse and the focus.
a is the distance from the center to a vertex.
Standard Equation for HORIZONTAL HYPERBOLAS
x²/a² - y²/b² = 1
Standard Equation for VERTICAL HYPERBOLAS
y²/a² - x²/b² = 1
Graphing a Hyperbola
Identify if the hyperbola is a horizontal or vertical hyperbola based on which variable is in the positive term.
Identify the center of the hyperbola, in this case is the origin.
Identify and graph the vertices by getting the square root of the denominator of the first term.
In a horizontal hyperbola, identify the coordinates of the endpoints by adding and subtracting this value from the x-coordinate of the center. The vertices should be at (a,0) and (-a,0).
In a vertical hyperbola, identify the coordinates of the endpoints by adding and subtracting this value from the y-coordinate of the center. The vertices should be at (0,a) and (0,-a).
Identify and graph the co-vertices by getting the square root of the denominator of the second term.
In a horizontal hyperbola, identify the coordinates of the endpoints by adding and subtracting this value from the y-coordinate of the center. The co-vertices should be at (0,b) and (0,-b).
In a vertical hyperbola, identify the coordinates of the endpoints by adding and subtracting this value from the x-coordinate of the center. The co-vertices should be at (b,0) and (-b,0).
Identify the value of c by getting the square root of a² + b² to plot the foci.
In a horizontal hyperbola, add and subtract the solved value from the x-coordinate of the center. The foci should be at (c, 0) and (-c, 0).
In a vertical hyperbola, add and subtract the solved value from the y-coordinate of the center. The foci should be at (0, c) and (0, -c).
Draw a rectangle such that the vertices and co-vertices are a midpoint of a side. Make the asymptotes by drawing two diagonal lines connecting the opposite corners of the rectangle
In a horizontal hyperbola, the equations of the asymptotes are y = ±b/a.
In a vertical hyperbola, the equations of the asymptotes are y = ±a/b.
(OPTIONAL) To make graphing easier, plot four more points by solving for the latus rectum.
Solve for the distance of the latus rectum with b²/a.
In a horizontal hyperbola, add and subtract the solved value from the y-coordinate of the foci. The points should be at (c, b²/a), (c, -b²/a), (-c, b²/a), and (-c, -b²/a).
In a vertical hyperbola, add and subtract the solved value from the x-coordinate of the foci. The points should be at (b²/a, c), (-b²/a, c), (b²/a, -c), and (-b²/a, -c).
Draw the curves of the hyperbola using the asymptotes as guides. Ensure that the curves approach the asymptotes but never meet.
Trigonometric Angles
Angle
the amount of rotation generated when a ray is rotated about its endpoint.
Initial Side
the initial position of the ray
Terminal Side
the position of the ray at the end of its rotation
Vertex
the endpoint of the ray
Positive Angle
the ray was rotated counterclockwise
Negative Angle
the ray was rotated clockwise
Angles in Standard Position
if the vertex is at the origin on a Cartesian plane, and the initial side aligns with the positive part of the x-axis.
Quadrantal Angle
angle in standard position whose terminal side lies on the x or y axis
Coterminal Angles
angles that are in the same positions and have the same terminal side but different rotations
Reference Angles (ϴ’)
the ϴ’ for the given angle is the positive acute angle formed by the terminal side of the given angle and the x-axis
Locations of Reference Angles (based on the location of ϴ)
ϴ is in Quadrant I (0º ≤ ϴ ≤ 90º)
ϴ = ϴ’
ϴ is in Quadrant II (90º ≤ ϴ ≤ 180º)
180º - ϴ = ϴ’
ϴ is in Quadrant III (180º ≤ ϴ ≤ 270º)
ϴ - 180º = ϴ’
ϴ is in Quadrant IV (270º ≤ ϴ ≤ 360º)
360º - ϴ = ϴ’
Radians
One radian (rad) is the measure of a central angle subtended by the arc equal to the radius of the circle.
Important Angles
2π = 360º
π = 180º
π/2 = 90º
Converting Radian Measure to Degree Measure
Multiply the value by 180º/π radians.
Converting Degree Measure to Radian Measure
Multiply the value by π radians/180º.
Revolution (rev)
formed when the initial side of an angle rotates completely around the vertex so that the initial and final side coincide.
1 rev is equal to 360º or 2π rad
Converting Revolution Measure to Radian Measure
Multiply the value by 2π rad.
Converting Radian Measure to Revolution Measure
Divide the value by 2π rad.
Trigonometric Functions
Functions
Note: Using the sides of a right triangle
sin ϴ = opposite/hypotenuse
cos ϴ = adjacent/hypotenuse
tan ϴ = opposite/adjacent
csc ϴ = 1/(sin ϴ) = hypotenuse/opposite
sec ϴ = 1/(cos ϴ) = hypotenuse/adjacent
cot ϴ = 1/(tan ϴ) = 1/(cos ϴ) = adjacent/opposite

Unit Circle
Definition
A circle with a center of (0,0) and radius of 1
Formula: x² + y² = 1
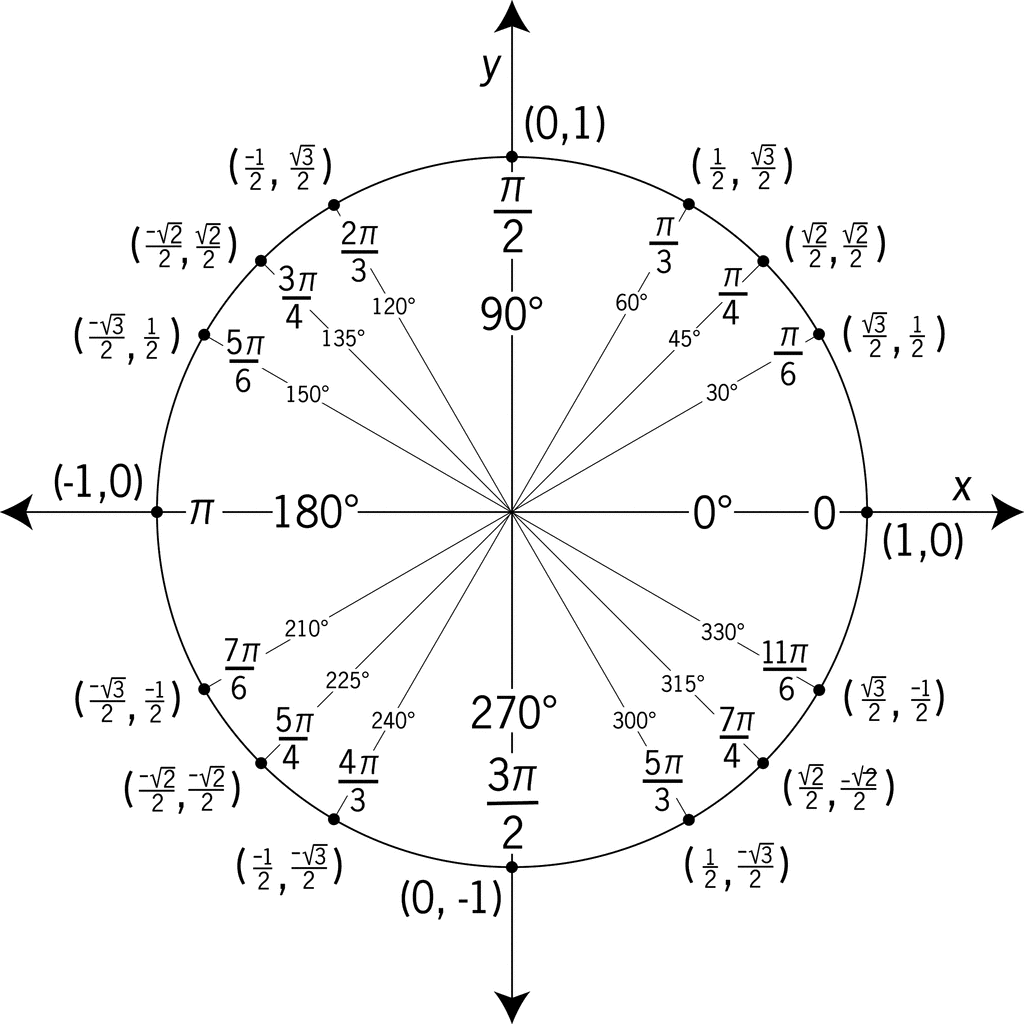
You can get the trigonometric values by drawing the needed angle with the circle’s center as the vertex until the circle and getting the x and y.
In (x, y):
x-component is the cosine value
y-component is the sine value
Quadrants
Quadrant I has all trig values as positive.
Quadrant II has sine and cosecant values as positive.
Quadrant III has tangent and cotangent values as positive, as sine and cosine values are both negative.
Quadrant IV has the secant and cosine values as positive.
Picture of Unit Circle
Trigonometric Graphs
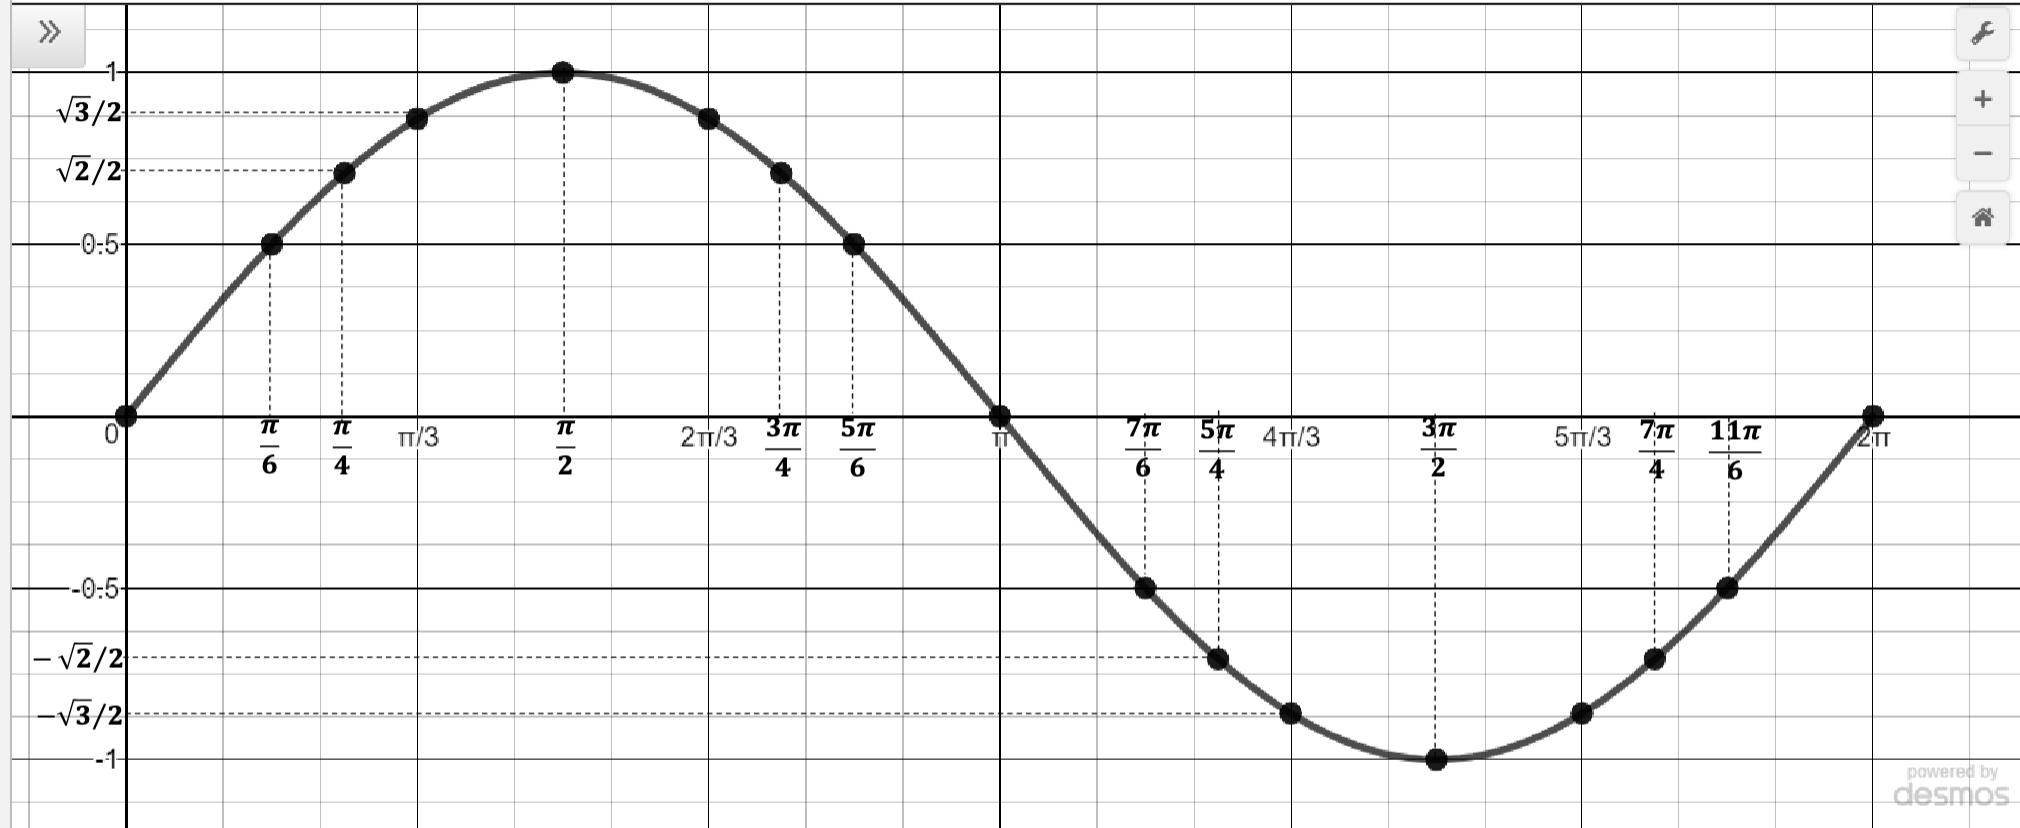
Sine Graph
Amplitude: 1
Period: 2π
x-intercepts: kπ/2; k ∈ odd integers
Domain: x ∈ R
Range: -1 ≤ y ≤ 1
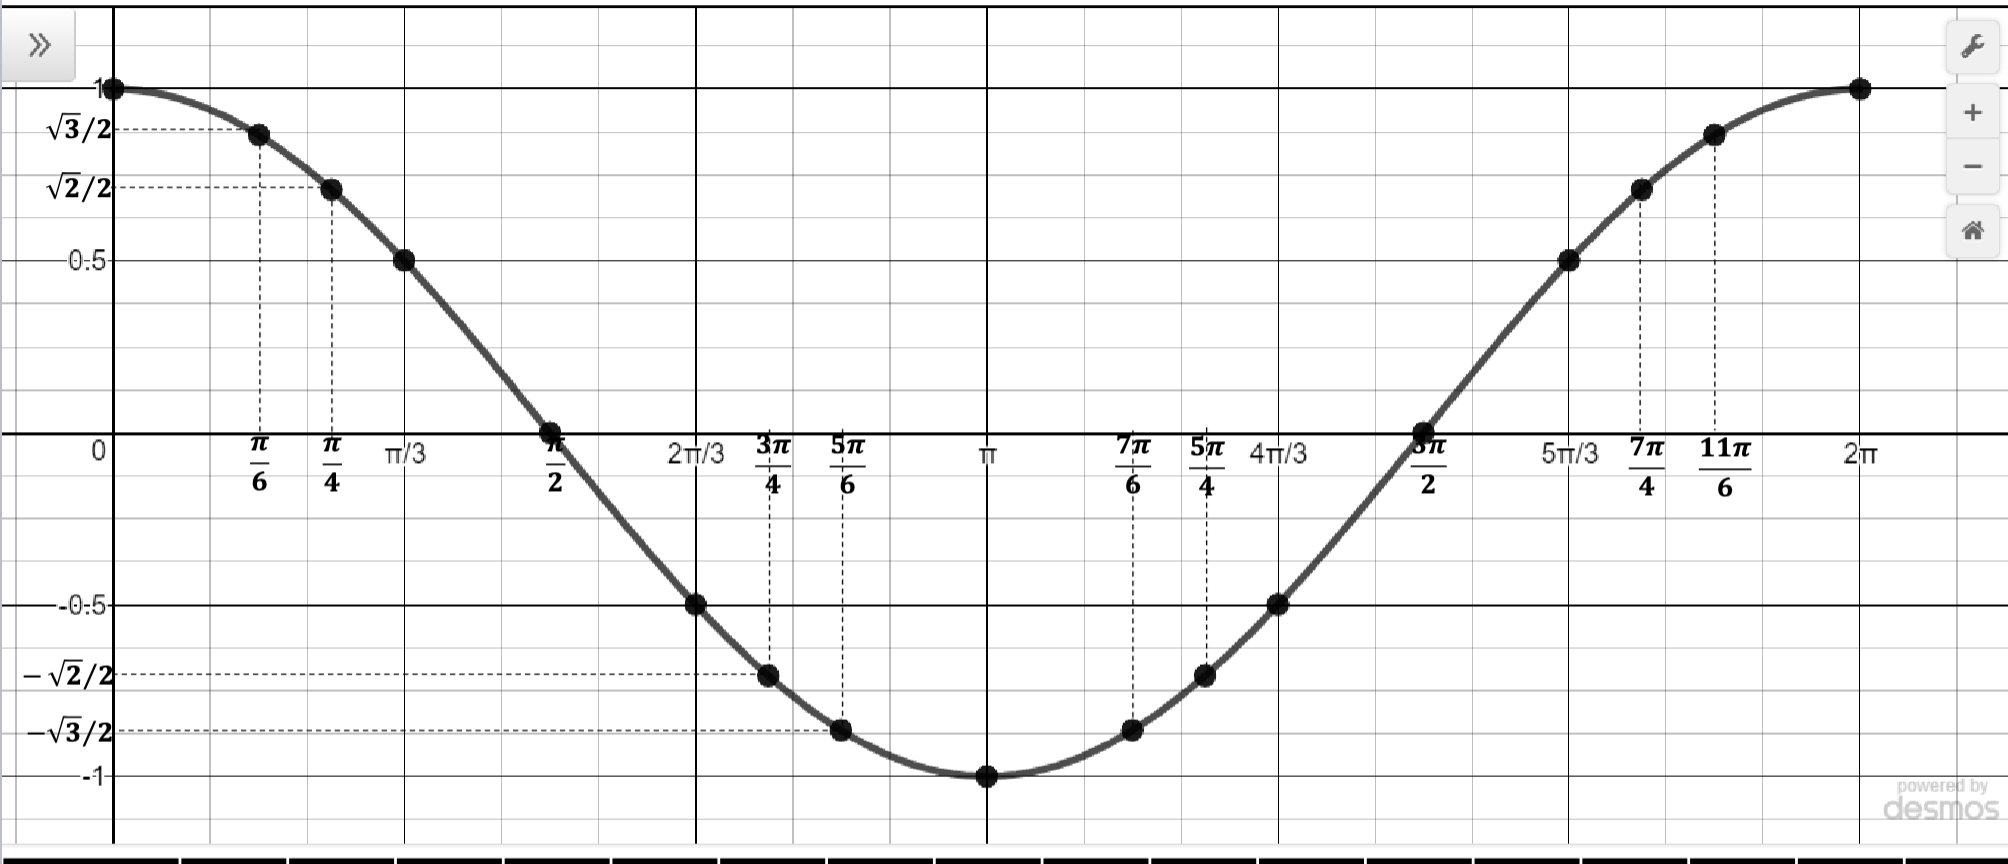
Cosine Graph
Amplitude: 1
Period: 2π
x-intercepts: kπ; k ∈ integers
Domain: x ∈ R
Range: -1 ≤ y ≤ 1
Graph Transformations

Vertical Expansions and Contraction
changes in the height of the amplitude by changing A
If |A| > 1, then the amplitude stretches/expands.
If 0 < |A| < 1, then the amplitude shrinks/contracts.
Horizontal Expansions and Contraction
changes in the length of the period by changing B
If |B| > 1, then the period stretches/expands.
If 0 < |B| < 1, then the period shrinks/contracts.
Vertical Reflection
reflection about the x-axis
occurs when A is negative
Horizontal Reflection
reflection about the y-axis
occurs when B is negative
Horizontal Translation
occurs when the graph shifts to the right or left
If it is (sin x - C), the graph shifts C units to the right
If it is (sin x + C), the graph shifts C units to the left
Vertical Translation
occurs when the graph shifts to up or down
If D > 0, the graph shifts D units up
If it is D < 0, the graph shifts D units down