Unit 7: Ideas About Science (Biology B OCR GCSE)
Investigating Phenomena Scientifically 🧠
Key Concepts:
Scientific Investigations: Careful data collection and analysis.
Stages: Hypothesis, predictions, experiments, conclusions.
📊 Remember: Follow the steps methodically.
Hypotheses and Predictions:
Hypothesis: Possible explanation for an observation.
A hypothesis must be made before any data can be collected and analysed.
📝 Example: “Plants need nutrients to grow. Fertiliser provides nutrients.”
Prediction: Testable statement based on the hypothesis.
The prediction will state how the effect of a factor will affect the outcome.
🧩 Example: “If fertiliser is added, basil seedlings will grow taller.”
Experiments:
Experiments are carried out to test the prediction.
Variables:
Independent Variable: What you change (e.g., light intensity).
Dependent Variable: What you measure (e.g., photosynthesis rate).
Control Variables: Kept constant for a fair test (e.g., temperature).
🔬 Example: Measuring bubbles in pondweed photosynthesis experiment.
Fair Test: Control variables must be kept constant.
Tools: Stopwatch, water bath for temperature control.
Data Collection:
When planning an experiment, you must decide what data needs to be collected and what measurements will be taken.
Depending on the type of investigation, this may include choosing a sample size or range of values that will be measured.
Sample Size: Large enough for valid conclusions, small enough to be manageable.
Method: Clear, concise, repeatable.
🧩Example: Use a measuring cylinder for 1 cm³ accuracy.
Once the data type is chosen and the variables are outlined, the experiment method can be written.
Apparatus list: Appropriate equipment must be selected.
The equipment must be suitable for the job and must provide precise, valid, and accurate data.
Risk Assessment:
Hazard: something that could cause harm.
Risk: the chance that the hazard will cause harm.
Hazards and Risks:
Identify and reduce risks (e.g., wear safety glasses with irritants).
⚠️ Example: Hydrogen peroxide safety.
Data Processing and Presentation 🧠
After experimenting to investigate a hypothesis, there is a process of collecting, presenting, and analysing data.
Processing Data:
Significant Figures:
Consistent in all measurements.
🔢 Tip: Round to the lowest significant figure in calculations.
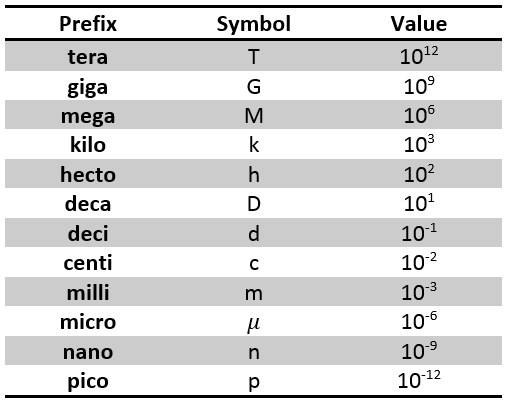
SI Units: Standard units (e.g., second, meter, kilogram).
You need to be able to convert between units, as some equations will require measurements in specific units.
Quantity | SI Base Unit |
|---|---|
Time | Second, s |
Length | Metre, m |
Energy | Joule, J |
Mass | Kilogram, kg |
Errors:
Random Errors: Environmental changes, worn instruments.
Systematic Errors: Consistent inaccuracies.
Anomalous Results: Do not fit the trend, exclude if justified.
🔍 Example: Anomalous bubble count in photosynthesis experiment.
Presenting Data:
Tables: Drawn with a ruler, units in headers.
📊 Example: Mean height of plants in cm.
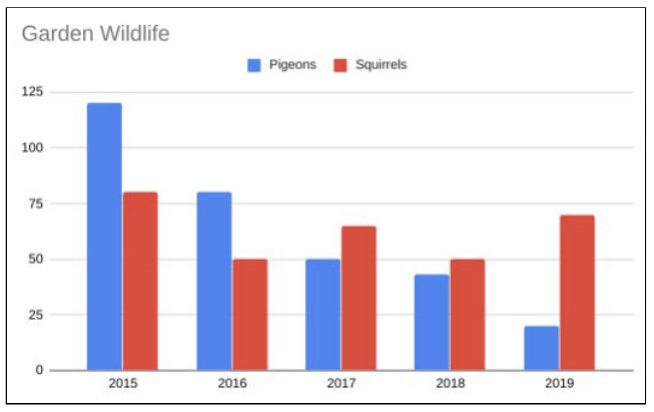
Bar Charts:
For categorical data, easy to compare.
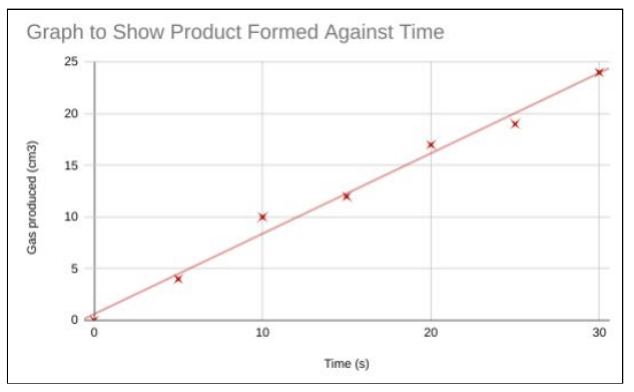
Graphs: For continuous data, plot points and draw best-fit lines.
Continuous data: data that can be measured and can have any value within a range.
📈Example: Graph of gas produced over time.
Range Bars:
Indicate uncertainty or variation.
Gradient Calculation: Rate of reaction from graph slope.
🔍Example: (Change in y) ÷ (Change in x).
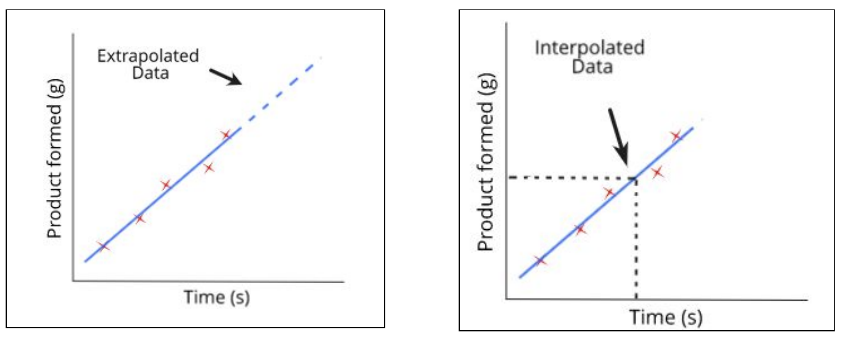
Extrapolation: continuing the trend further to obtain more data points just outside the range.
Interpolation: constructing new data points within the range of known data points using a line of best fit.
Statistics:
Statistics give values that can be easily compared across a range of experiments.
Range: Spread of data (largest - smallest).
Mean: Average value (sum of values ÷ number of values).
📉 Tip: Exclude anomalies.
Experiment Improvements:
Fair Test Evaluation:
Was the method valid? Was it a fair test? Were all variables controlled? Were there anomalous values? Was there enough evidence to reach a valid conclusion?
🔄 Suggestions: Narrow intervals for more accuracy.
🌱Example: Test enzyme activity at 35°C, 40°C, 45°C.
Drawing Conclusions and Scientific Development 🧠
Drawing Conclusions:
Data Analysis:
Conclude based on data only.
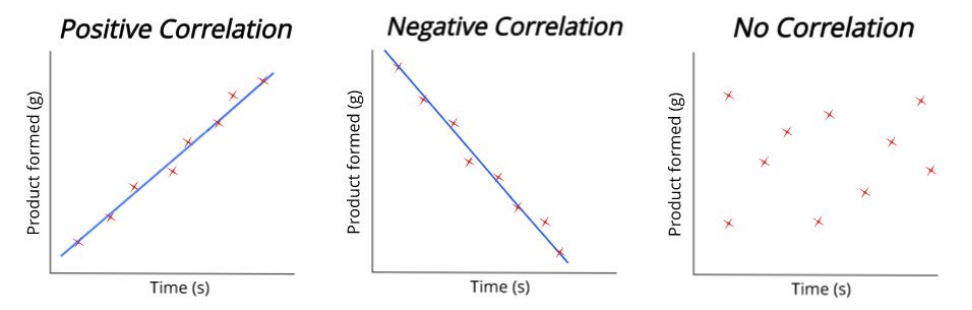
Pattern recognition and correlation.
Individual cases do not provide convincing evidence for or against correlation.
📈Example: Conclude enzyme A is more effective if data supports it.
Correlation and Causation:
Correlation: Relationship between variables.
🧩 Example: Smoking correlated with lung cancer, but not always causative.
Causation: Direct cause-and-effect relationship.
One event is the result of the occurrence of the other event.
Correlation doesn’t always mean causation.
📉 Example: CO₂ levels causing global temperature rise.
Modification of Scientific Theories:
New Evidence: Leads to theory modification.
The proposition of a scientific explanation involves creative thinking.
🧬 Example: Darwin's theory supported by modern genetics.
Technological Advances: Enable better evidence and theory adjustments.
🌱Example: Antibiotic resistance studies.
Scientific theory: a general explanation that can be applied to numerous situations.
Peer Review:
Peer review: Scientific community checks new findings.
Ensures validity before acceptance.
Models and Limitations:
Models are used to help explain ideas and to test explanations quickly.
It represents the main features of a system and can be used to predict possible outcomes.
Types of Models:
Representational (visual), descriptive (explanatory), mathematical (predictive).
🧩 Example: Lock-and-key enzyme model's limitations.
Benefits and Risks:
Science improves quality of life (e.g., antibiotics, fertilisers).
Consider ethical implications (e.g., stem cell research).
Scientific and Technological Impact on Society 🧠
Benefits of Science
Improve quality of life:
Vaccinations.
Antibiotics
Fertilisers for crops.
Water can be processed to be made potable.
Risks
Some applications of science can risk people’s quality of life or the environment.
Everything carries a certain level of risk.
People are generally happier to accept a risk if it is something they choose to do, rather than imposed.
People often have an idea of a perceived risk, which can differ from a calculated risk.
Perceived risk: an overestimate of the risk.
Ethical issues
Some scientific explanations can have ethical implications.
🧬Example: use of embryonic stem cells, genetic engineering.
Communicating science
Scientists must communicate their work in a way that can be understood by a large range of audiences.
Tips for Remembering Confusing Concepts 🧠
General Tips:
Create Mnemonics:
Use acronyms or phrases to remember lists (e.g., “HOMES” for Great Lakes: Huron, Ontario, Michigan, Erie, Superior).
Visual Aids:
Draw diagrams or mind maps to visualise relationships and processes.
Teach Someone Else:
Explaining concepts to others can reinforce your understanding.
Scientific Investigations:
Stages Order:
Hypothesis, Prediction, Experiment, Conclusion (H-PEC).
🌱 Hypothesis: Plants need nutrients.
🌱 Prediction: Fertiliser helps growth.
🧪 Experiment: Add fertiliser.
📊 Conclusion: Analyse results.
Variables:
Independent (I change), Dependent (Data), Control (Constant).
🔧 Independent: Thing you change.
📏 Dependent: Thing you measure.
🛠️ Control: Things you keep the same.
Data Processing:
Significant Figures:
Think “Consistent Figures” to remember consistency.
✏️ Consistent in all calculations.
Errors:
Random: R for Random events, Systematic: S for Same every time.
🎲 Random: Fluctuates.
📉 Systematic: Consistent error.
Graph Rules:
Dependent (Vertical), Independent (Horizontal) (D-I-V-H).
📈 Dependent: y-axis (Vertical).
📊 Independent: x-axis (Horizontal).
Models and Theories:
Models Types:
Representational (R), Descriptive (D), Mathematical (M).
📘 Representational: Physical analogy.
📖 Descriptive: Specific explanation.
🔢 Mathematical: Data patterns.
Causation vs. Correlation:
🔗 Causation: Direct link. Cause-Effect.
📊 Correlation: Relationship, not cause.
Correlation doesn’t always mean causation.
Practical Examples:
Hypothesis Example:
Nutrients and fertiliser link: Think N-F Link (Nutrients-Fertiliser).
🌱 Hypothesis: Nutrients boost growth.
🌿 Prediction: Fertilised plants grow better.
Graph Example:
Remember Bubbles for Photosynthesis: B-P (Bubbles-Photosynthesis).
💧 Hypothesis: Light affects photosynthesis.
🌞 Prediction: More light, more bubbles.