Notes Traffic Psychology
Lecture 1 Theories and models
Skill models: a drivers perceptual and motor skills are what makes them safe
Reaction time, vision, level of driver training
Too simplistic
Attitude theories: we have certain attitude against behavior
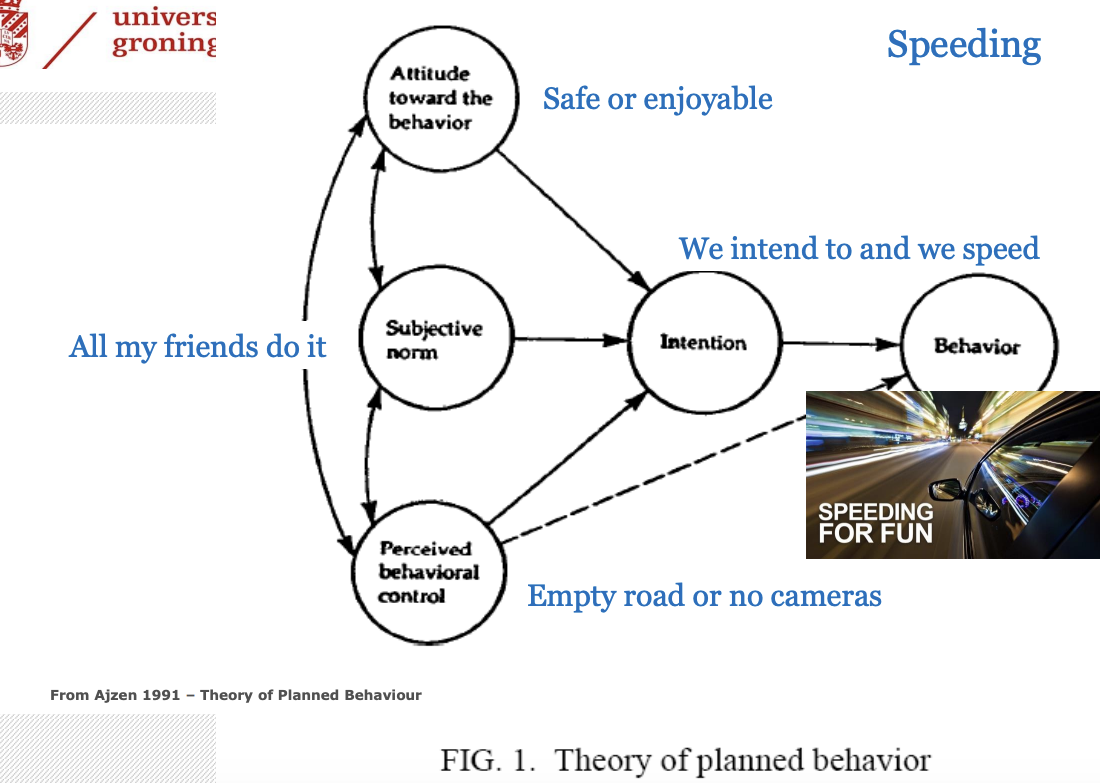
Theory of planned behavior (TPB)
The Theory of Planned Behavior (TPB) is a social psychological theory that predicts human behavior based on 4 factors: attitude, subjective norm, perceived control, intention
Utility theories: maximize gain and minimize loss
Trying to make a rational decision, often not based on anything
Risk/motivational theories:
Risk homeostasis theory (RHT) - individuals have a target level of risk
Fixed level
If experienced risk does not equal target risk, action is taken. If something is too risky, we do something to attain more safety = behavioral adaptation
Risk allostatic theory (RAT) - individuals have a preferred range of feeling of risk
More dynamic
We evaluate a situation and respond to that
Zero risk theory - argues that risk is hardly ever experienced when it is, it acts as a warning.
Safety margin model: threshold model which motivates to be '“comfortable”
Multiple safety margins monitored like personal space
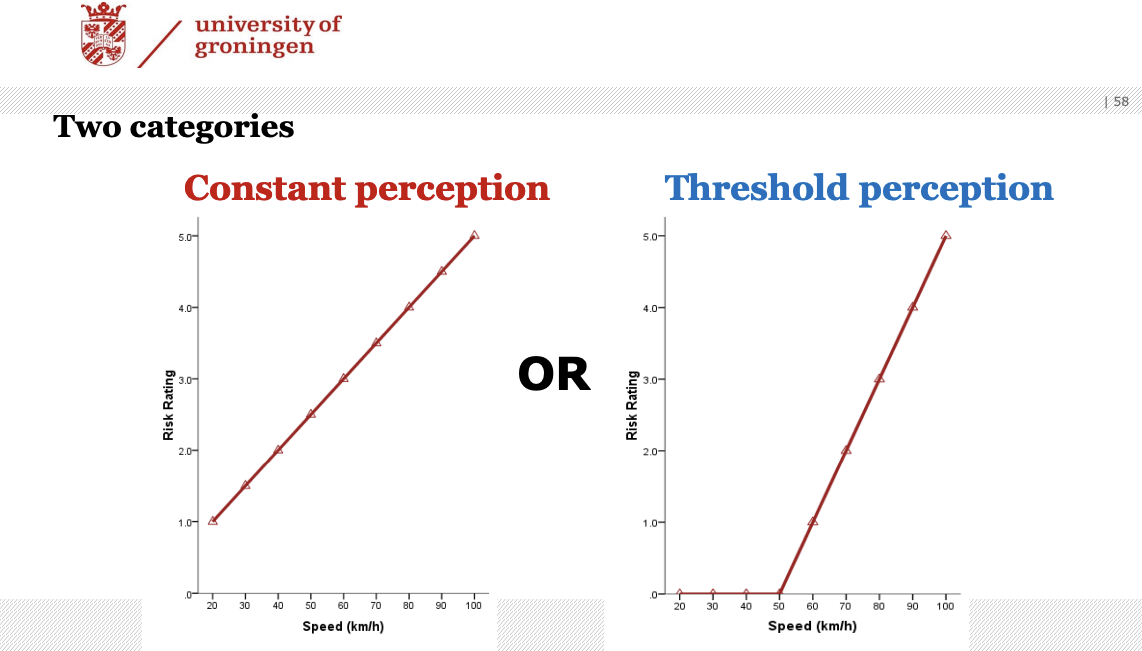
Constant perception models:
Risk homeostasis theory
Risk allostatic theory
Threshold perception models:
Zero risk theory
Threat avoidance theory
Safety margin model
Performance and decision taking models:
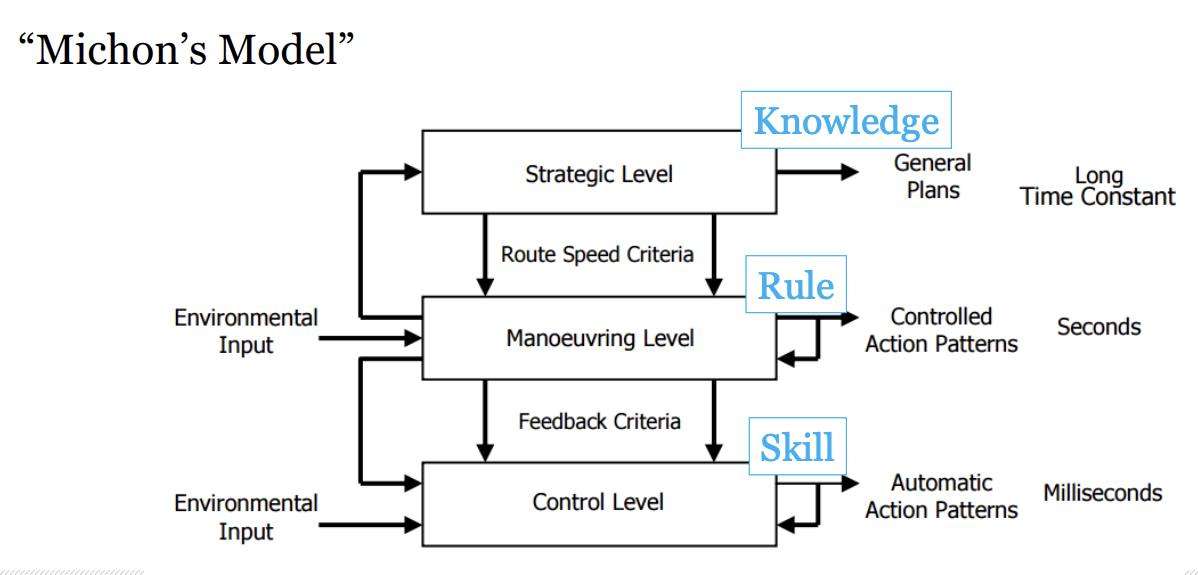
Rasmussen: Human Performance
Knowledge level - Bounded rationality & “thinking”
Rule level - Pattern matching & recognition
Skill level - Highly automated, very little/no effort
Michon’s model: Hierarchical decision-making
Lecture 2 Automation and driver support
MABA-MABA assumption = men are better at-machines are better at
human better at: judgement, reasoning, improv
machine better at: repetitive tasks, precision, quick response
Automation in traffic
Support systems (information) like navigation, speed limit info, ADAS (=advanced driver assistance systems)
Automate driving itself (vehicle control)
Different levels of automation:
no automation - opening the door
decision support - navigation system
consentual artificial intelligence - device asking permission
monitored artificial intelligence - cruise control
full automation - automated driving
level 1-3: human can control
level 4-5: human cannot control
Humans and automation
Use: voluntarily activating/disengaging automation
Abuse: task is taken over by machine without considering consequences for operator
Disuse: neglect automation
Misuse: unjustified overreliance
Phileas, “tram on tyres” - had 3 modes of operation with different automation levels
Adaptable automation: human determines how automation is applied
Adaptive automation: system assigns automation level
Issues of automation
errors
transfer of control (from manual → automatic and vice versa)
mixed traffic
failing sensors by mud for example
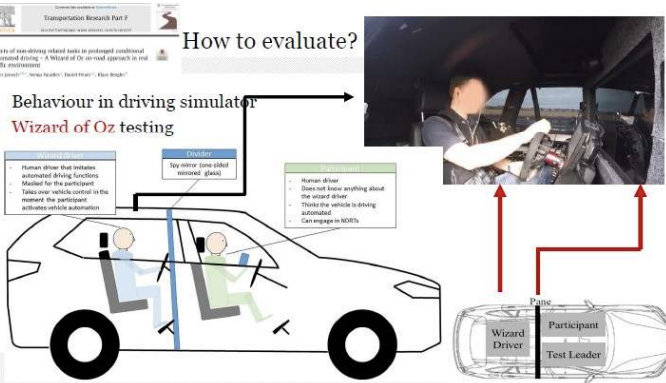
Wizard of Oz testing
Rasmussen
‘skill based’ errors: failing sensors
‘rule based’ errors: pattern recognition
‘knowledge based’ errors: is it al preprogrammed or sufficiently trained with data
Ethics:
hacking
terrorism
smuggling
External human-machine interface (eHMI) = screen on outside of car with text or smiley that interacts with humans
Lecture 3 Car driving with cognitive impairment
The ageing society
normal cerebral and cognitive decline
pathological cerebral and cognitive decline - Alzheimer’s, Huntington’s
Driving assessment methods
Behind-the-wheel examination (BTW): on-road test conducted by driving specialist
+ direct, quantifiable measurement
- subjective, no challenging scenarios
Instrumented vehicle: instruments (e.g. cameras) linked to vehicle inputs (e.g. braking)
+ direct, quantifiable measurement
- expensive, no challenging scenarios
Virtual reality driving simulation
+ objective, quantifiable measurement and safe to do challenging scenarios
- comparable to real world?
Crash statistics: data from collisions
+ clinical relevance
- collected after the fact, infrequent events and only if reported
Self-reports: own driving history
+ easy to assess
- self-report bias
Neuropsychological assessment: speed of processing
done by behavioral observations, self-reports and neuropsychological tests
Fitness to drive? Decision making
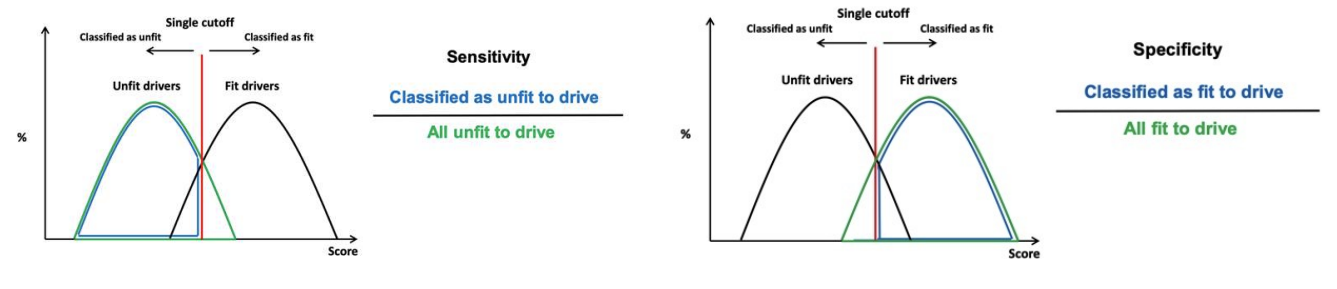
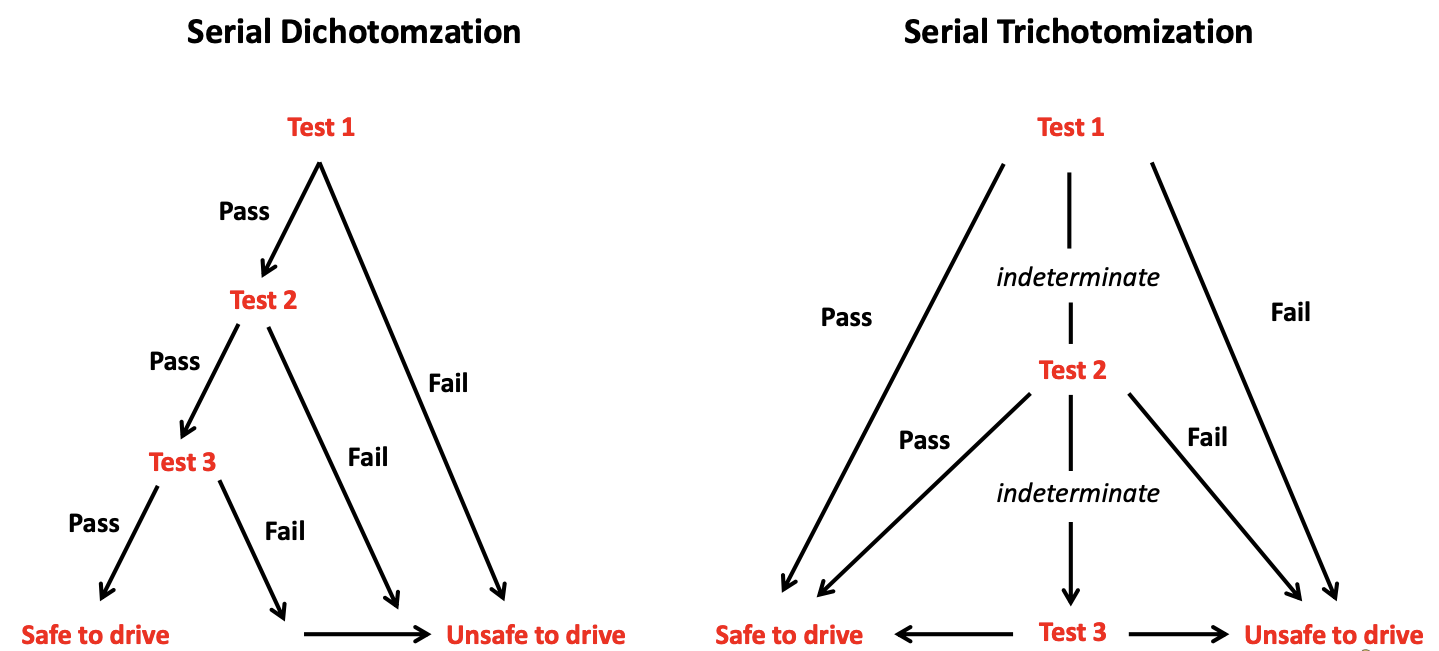
Dichotomization = a single cutoff
Sensitivity (true +): how many of older people unfit to drive do I classify as unfit?
Specificity (true -): how many of older people fit to drive do I classify as fit?
Positive predictive value: how many of older people classified as unfit to drive are actually unfit?
Negative predictive value: how many of older people classified as fit to drive are actually fit?
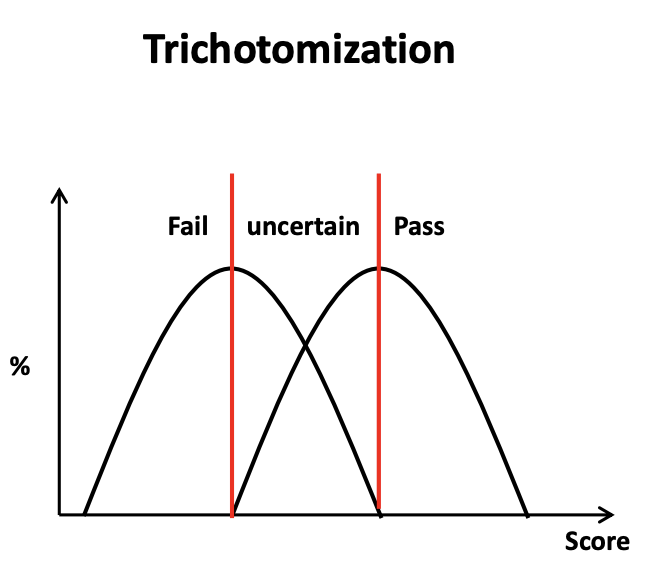
Trichotomization = 3 groups, middle is uncertain
Driving research at RUG
Goal: to develop a strategy for determining fitness to drive of patients with dementia in the clinical setting (using clinical interviews, neuropsychological assessment and driving simulator rides)
Conclusions: patients with mild form may be able to drive
Adherence to recommendation
if advice was stop/continue driving → most people followed advice
if advice was driving lessons → not a lot of people followed advice
Interventions and alternatives for when unfit:
Advanced driver assistant systems (ADAS) - navigation guidance, night vision enhancement, intelligent cruise control
Cognitive interventions - training of cognitive functions which are fundamental of driving
Educational interventions
Clinical interventions - reduced mobility can result in depression, social isolation and loss of independence → prepare elderly for this to ease them into it
Lecture 4 Mental workload and fatigue
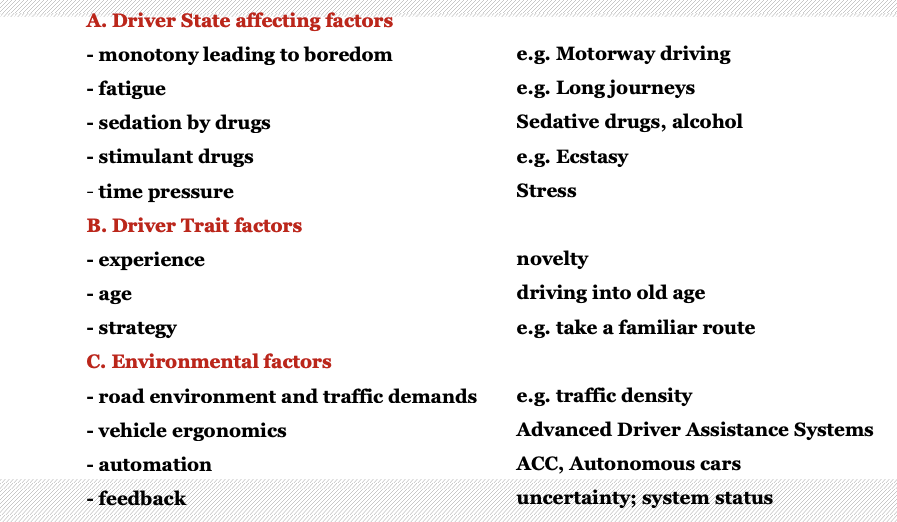
Mental workload: the difference between the processing resources to the operator and the resource demands of the (multiple) task(s)
can have consequences for performance
simply put:
demand > capacity = workload high → performance decreases
demand < capacity = workload low/acceptable
The availability of resources depends on:
individual differences
arousal
motivation
resource demands depend on:
- task structure (information processing)
- task combinations (number and type)
There are 2 concepts of tasks:
Task complexity: increases with an increase in the number of stages of processing that are required to perform a task
Difficulty of a task: related to the processing effort (amount of resources) that is required by the individual for task performance
Mental workload can be high as a result of
high task demand
reduced capability to deal with the task demands
Mental workload in driving:
Mental effort - trying hard
2 types:
Compensatory effort: counteract reduced state
Computational effort: deal with increased task demands
Assessing mental workload pt1
Measures have to be:
sensitive to changes
selective
stable and reliable
non-intrusive to the primary task
accepted by the operator
Measures can be: diagnostic or generally sensitive
There are also implementation requirements
Types of measures:
A. Performance measures
A1. Primary task
longitudinal: speed and speed control, headway control
lateral: lane position, steering wheel movements
A2. Secondary task
added task: like addition/calculation task
embedded task: mirror looking behavior
B. Self reports
Multidimensional → mental workload, physical workload, time pressure, performance, effort, frustration
C. Physiological measures
ECG: average heart rate and heart rate variability
Respiration: frequency, amplitude
EMG: energy
“Behavior”: eye movements (gaze duration and frequency of scans)
If there is an increase in mental workload → increase in average heart rate and decrease in heart rate variability (seen on ECG)
Assessing mental workload pt2
Need to interpret and integrate information from multiple measures:
performance
self-reports
physiology
Fatigue: subjective experience of tiredness and unwillingness to continue working
3 types of fatigue:
Sleep-related fatigue (circadian rhythm)
Active task related fatigue (exhaustion after high demand)
Passive task related fatigue (monotony, boredom)
Fatigue detection
psychophysiology
steering wheel movements
facial monitoring
Structure of a warning display:
warning must be noticed, read, understood, accepted and should not lead to adverse reactions
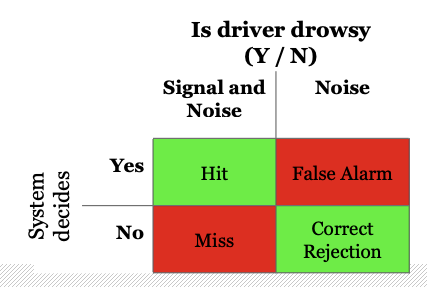
Signal detection theory
goal: to discriminate signals from noise
Shifts, major problems:
work at night and sleep in the day
morning shifts too early
rest between shifts too short
too many successive shifts without time off
too many successive night shifts
countermeasures:
avoid night and early work
rapid rotation
free time between shifts
napping
Indications in dealing with a fatigue related accident
single vehicle accident
high speed road accident (motorway)
no attempt to brake or swerve
driver was alone in vehicle
time, early morning / 3-4 pm
male young driver
Lecture 5 Education, enforcement and engineering
Education
1a. Licencing and driver training
Skill level: training and education makes people more skilled drivers, not necessarily safer drivers
Strategic level: danger recognition
Experience paradox: independent driving experience leads to safe behavior but to get experience you need experience
solution: supervised practice
GDL (Graduated Driving Licence)
AUS/USA: 16 years
drive under supervision, not in night, no teenage passengers
results: reduces all crash-types in ages 16-17 (effect in age 18 is debated)
Factors why younger drivers tend to cause more crashes:
overconfidence
countries with safe roads are safe for young drivers, not used to unsafe roads
they tend to drive older cars → decreases safety
1b. Campaigns
If you want to change behavior → make campaign
Protection motivation theory
explains how people perceive and respond to threats. It says individuals protect themselves based on their assessment of threat severity and their ability to cope.
perceived: severity of threatening event and probability of occurrence
efficacy: of recommended preventive behavior and self-efficacy
Fear appeals
elicit fear can motivate but also lead to defense response (e.g. denial, ridiculing, minimising)
mainly affects cognition, not driving behavior
The message-relevant effect
short-term: negative emotional appeals
long-term: positive appeals
Enforcement
Traffic enforcement (e.g. speed, traffic lights, drink-driving)
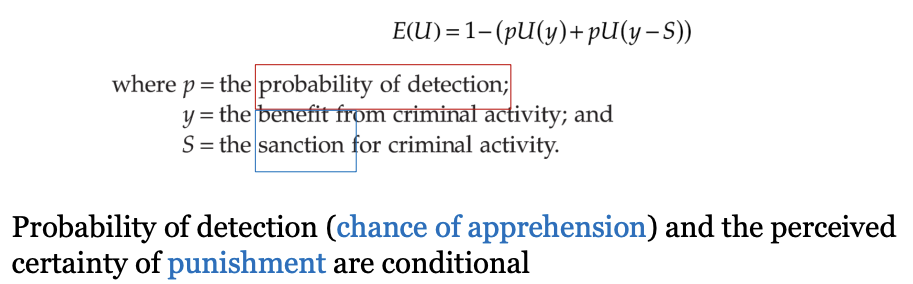
Deterrence theory: activity happens in case of positive utility
benefits of certain behavior (speeding gives joy or gets you home earlier)
punishment when detected
probability of detection
criminal activity is assumed to occur when total expected utility is positive in this equation
Enforcement methods
for speeding - cameras, mobile units
at traffic lights - cameras, mobile units → reduce red light running
for seat belts, helmets, lights - mobile units
drink-driving - on site (breathalysing)
headway, road rage, mobile phone use - cameras, mobile units
Halo effects
Distance halo: behave better than you normally do when you see a police car for example
Time halo:
Average speed enforcement
advantages:
homogenised flow → better traffic density and reduced travel time
accepted by the public
Engineering
Self explaining roads: design of roads evokes correct driving behaviors from road users
removing guidance → uncertainty → slow down → less accidents
engineering is the most effective compared to education and enforcement but also most expensive
Lecture 6 Drugs and driving
Why do people drink and drive?
Disinhibition model: can’t control themselves
sober → inhibitions present
drunk → inhibitions fall away
Myopia model: can’t see beyond the now
sober → individual can still consider a wide range of values, rules and concerns
drunk → I need, I feel, I want now
Assessing effects of alcohol on traffic safety
Epidemiological research by surveys, road side testing and hospital registrations
prevalence
accident risk calculation
Experimental research
driving related tasks (e.g. alertness, memory, risk taking)
pros: easy to administer, widely available, executive functioning
cons: in isolation → not representative real world
on road driving (road tracking test, car following task)
pros: representative
cons: not always possible (ethics)
driving simulator tasks (road tracking tests, car following tests, interaction with traffic)
pros: easy administrable, low cost, interaction with traffic
cons: simulator sickness, representative?
Conclusion alcohol in traffic
alcohol affects judgement and skills
also as benchmark for drugs in traffic bc:
clear dose related effect on accident risk
a lot is known about the effect of alcohol on driving performance
Determining the effects of drugs on driving and traffic safety
example 1. THC:
+ effects: altered perception, relaxation, increased awareness
- effects: anxiety, dissociation
high prevalence and increased accident risk
cognitive performance decreases with dosage
example 2. amphetamines (psychostimulant):
+ effects: improved neuropsychological task performance (reaction time, impulse control, tracking), no impairment on other driving tasks
not safe because tasks that are tested do not cover everything
Driving impairment effects depend on:
substance
dose
time after intake
half-life of the drug
tolerance
precondition (reason to use drug)
Lecture 7 Vulnerable road users
Vulnerable road users (VRU) are:
older people
children
pedestrians
etc
Cars are getting bigger (SUV’s) → further compromise pedestrian safety
Cycling into old age
many single-sided accidents
infrastructure is one of the factors → forgiving cycle path should be made where it’s okay for people to make errors that don’t immediately lead to accidents
Common problems that older cyclists experience:
soft shoulder lanes
swerving
Possible solutions:
optical illusions → anamorphosis (least effective)
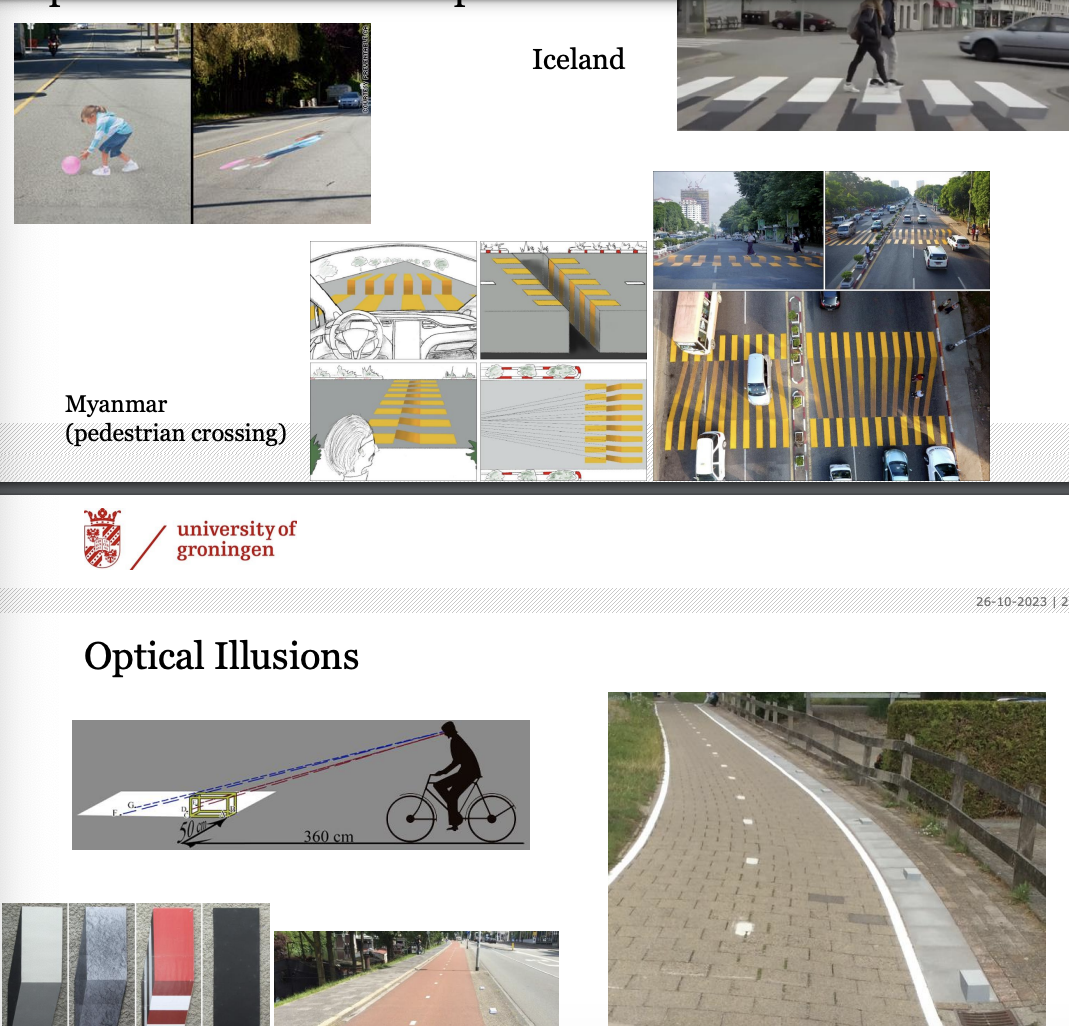
‘Forgiving’ shoulder lanes → space added in the shoulder as a buffer area (most effective)
3 types:
grey colored artificial grass
green colored artificial grass
concrete strip
Formal communication with others = using arms
Prediction is not more accurate than chance for turning cyclists
contributions to prediction accuracy:
left turn: head movements
straight: constant speed
right turn: change in speed
Theres safety in numbers; large group → more visible
Guest lecture Hemianopia and participation in traffic
Hemianopia and its impact on participation in traffic
Hemianopia: visual impairment characterized by the loss of half of the visual field in one or both eyes
Hemianopia does not seem to reduce safety of street crossing
It does reduce relative walking speed and the ability to detect objects
HH also affects the safety of cycling in unexpected events
Compensating by behavioral change
Scanning behavior:
higher exploration rate, long scans → may result in earlier detection of other road-users at unexpected events → increases safety
Tactical compensation:
lower cycling/walking speed and frequent/anticipatory braking → reduces time pressure to react on road-users
Strategic compensation:
avoiding situations with high time pressure to detect road users
The role of rehabilitation centres
can provide aid in terms of compensation training, but may also increase family and friend support