GEOG 110 01
Week 1
08/25/2025 Homework Reading (Chapter 1)
Weather is the state of atmosphere at a specific place and time described quantitatively by temperature, humidity, cloudiness, precipitation, and wind.
Meteorology is the study of the atmosphere and the life cycle of weather systems.
Climate refers to weather conditions averaged over a specific time — commonly 30 years — along with extremes.
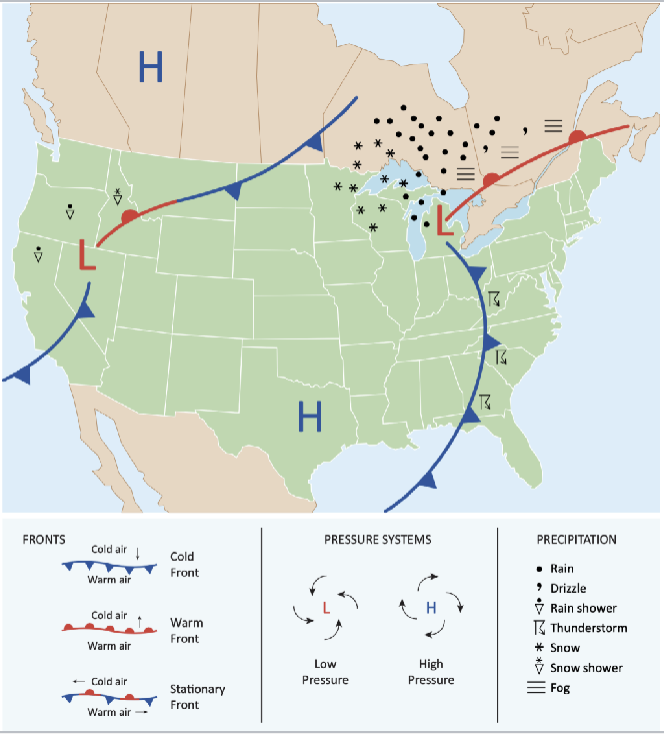
Weather maps graphically portray atmospheric conditions across a broad region.
Symbols identify high-pressure systems (anticyclones) and low-pressure systems (cyclones).
Climatology is the study of climate, its controls, and spatial and temporal variability.
Description of the climate
Random terms:
Maximum temperature: The highest air temperature recorded over a 24-hour period.
Minimum temperature: The lowest air temperature recorded over a 24-hour period.
Dewpoint/Front Point: The temperature to which air must be cooled at constant pressure to become saturated with water vapor and for dew to begin forming on relatively cold surfaces.
Relative humidity: A measure of the actual concentration of the water vapor component of air compared to the concentration the air would have if saturated with water vapor.
Precipitation amount: Depth of rainfall or melted snowfall over a 24-hour period.
Air pressure: The weight of a column of air over a unit area of the Earth’s surface.
Wind direction and wind speed: According to meteorological tradition, wind direction is the compass direction from which the wind blows.
An air mass is a huge volume of air covering hundreds of thousands of square kilometers that has relatively uniform temperature and humidity properties in its horizontal extent.
Typically associated with a large high pressure system and its specific characteristics depend on the types of surfaces over which the air mass forms (its source region) and travels.
Four basic types of air masses:
Cold
Dry
Cold and Humid
Warm and Humid
A front is a narrow transition zone between air masses that differ in temperature, humidity, or both.
Forms where contrasting air masses meet, and the associated air movements often give rise to the cloudiness and precipitation.
Most common fronts”
Stationary
Literally a stationary front
On both sides of a stationary front, winds blow roughly parallel to the front but in opposite directions.
Cold
Advances by sliding under and pushing up the less dense warm air and the leading edge of cold air at the Earth’s surface is plotted on a weather map as a cold front.
Warm
Cloud patterns on a visible satellite image are of particular interest to atmospheric scientists.
Weather radar complements satellite surveillance of the atmosphere by locating and tracking the movement of areas of precipitation and monitoring the circulation within small-scale weather systems such as thunderstorms.
Sky Watching
Clouds are tiny water droplets.
A cloud near the surface is fog.
Stratiform Clouds: form horizontal layers. Cumuliform clouds: appear puffy.
08/27/2025
Weather
Present conditions
Changes constantly
Conditions are almost never “normal”
Climate
Average conditions for a specified place and time
“Normal” represents average of past 30 years of weather data
Because if you go more than 30 years climate change occurs. Its a slow moving thing but it changes slowly all the time.
Extremes are noted using the entire weather record.
Location is what controls climate.
How far is it from the equator?
The closer you get to the poles the colder is gets.
How close are you to the water because that also determines weather?
Time Keeping
Local time (“sun time”)
Standard time (time zones)
Z-time, GMT, and UTC
Z-Time = Zulu Time
Time on the prime meridian (standard time in London)
UTC = Universal time coordinated
All of these are basically the current time on the prime meridian (standard time in London)
All weather maps are marked for a specific time
All data is collected at a certain time anywhere, that’s why it is useful for everyone to have a standard time when collecting it.
Personal: Kind of like how most scientists use the metric system so they all recognize it all over.
Times of WX data collection are standardized in order to produce synoptic maps. “Synoptic” means “seen at one time”.
Anticyclone / Cyclones
The air pressures go down evenly on the isobars.
Isobars are the lines circulating the high or low air pressure markers.
The mega “H” or mega “L”
Anticyclones are clockwise, but in the Southern Hemisphere, they are anticlockwise.
The map in class is showing the northern hemisphere.
Anticyclone whiteboard notes:
Clockwise in northern hemisphere
Center of high pressure
Diverging from the center
Subsiding (sinking air)
Clear skies
Fair weather
Light winds
(For anticyclones) Air pressure always spirals outwards. “H” is pushing air outward, away from the middle. It is never going inward.
Cyclone
Center of low pressure
Moves counterclockwise or anti clockwise in the northern hemisphere
Converging air toward center
On the tree example it goes upward after pulling it in from the sides.
Combining air can’t occupy the same area, it needs to keep moving.
Rising air
Cloudy skies
Unsettled/rainy weather
Windy
Weather map symbols (cheat sheet)
Air masses and fronts
Air masses are large bodies of air that have generally uniform characteristics of temperature and humidity.
Fronts are located at contrasting air mass boundaries.
Air masses capture the characteristics of their source regions:
Cold if they come from high latitude regions: Canada, Artic Ocean, Siberia
Warm if they come from tropical regions: Gulf of Mexico/Caribbean, Mexico
Humid if they come from ocean source regions: Pacific, Atlantic, Gulf of Mexico
Dry if they come from land areas: Canada, Siberia, desserts of US SW, and Mexico
Fronts
Warm front: warm air rides up and over colder air at the surface as colder air slowly retreats.
Cold front: cold air advances into warm air wedging warm air upward and causing often intense precipitation along a narrow zone ahead of the front.
08/27/2025 Lab
Surface analysis
Surface map at a synoptic time of the Earth
Quiz:
Cloud Coverage
Wind direction
Dew Point
Temperature
Wind pressure rounded to the nearest 5 knots
08/29/2025
Shape and size of the Earth
Equator:
12,756 Kilometers
7926 Miles
Circumference: 40,075 Kilometers
South Pole
Distance to the equator:
12,714 Kilometers
North Pole
Distance to the equator:
7,900 Miles
The Earth rotates on an Axis
Because the earth rotates, it has an axis of rotation.
The North and South poles are the places where the earth’s axis intercepts the earth’s surface.
If standing at the north pole, the north star, Polaris, is exactly 90° upwards.
Polaris moves very little so it is an “anchor” point for our Earth.
Polaris/The North Star is at a fixed point in the sky, it will always indicate your latitude.
Unless you’re in the Southern Hemisphere.
Earth moves roughly 15° every hour.
Latitude
Latitude Lines (Parallels)
Are parallel to one another (they never meet, and never cross)
Are perpendicular to the axis of the Earth
Run east to west
Get progressively shorter away from the Equator
Measure distance north or south of the Equator
Have values from 0° to 90°
The Equator is 0° latitude.
It is the greatest circumference of the earth and makes up a set of points equidistant from both poles.
Only the Equator is a great circle among the lines of latitude.
Important Lines of Latitude
0° Equator
23.5° N, Tropic of Cancer
23.5° S, Tropic of Capricorn
66.5° N, Arctic Circle
66.5° S, Antarctic Circle
90° N, North Pole
90° S, South Pole
Why are these particular lines of latitude important?
The tropics are latitudes where the sun strikes directly overhead sometime during the year.
The Arctic & Antarctic Circles mark the latitude where 24 hours of daylight, or 24 hours of darkness, occur in each hemisphere during the Solstices.
And the Poles mark Earth’s rotational axis.
Longitude
Lines of Longitude
Join at each pole, but spread out at the Equator
Are perpendicular to the equator
Are known as meridians
Run north and south
Are all the same length, and are all great circles
Measure distance east and west of the Prime Meridian
Have values from 0° to 180°.
The Prime Meridian is an arbitrary starting point: 0° longitude could have been anywhere on Earth.
Week 2
09/03/2025 Pre-Lab Quiz Studying
The geographic grid is a system of lines, intersecting at right angles, used to locate any position on earth’s surface.
The rotational axis of Earth is an imaginary line connecting the North Pole and South Pole, and the equator.
The great circle is one that divides a sphere in two equal halves (hemispheres); it represents the circumference of the sphere, and is thus the largest circle that can be drawn on it.
Small circles do not cut the earth into two equal halves. All parallels of latitude except for the equator are small circles.
09/03/2025 (Class, Lana came in clutch)
Earth-Sun Relationships
The Solar Constant
Earth receives constant radiation from the Sun
At its distance of 150,000,000 Kilometers, top of atmosphere gets 1370 W/m2
A Watt (W) is one joule per second (J/S)
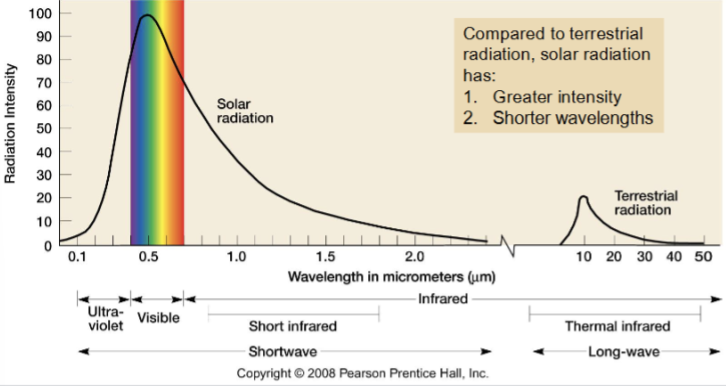
Bodies radiate according to their temperature
Earth captures small amounts of sun radiation.
Sun radiates in shorter wavelengths.
Due to higher temperatures.
Shortwave in (Sunlight)
Long wave out (Heat)
Earth radiates in all directions.
Comparing solar with terrestrial radiation
Greater Intensity
Shorter wavelengths
Earth’s orbit is slightly elliptical
Earth is closet to the sun in January and furthest in July
The closet point in orbit to the Sun is called perihelion (January 4)
The furthest point of orbit from the Sun is called aphelion (July 4)
Earth’s orbit at the correct scale
At true scale, Earth’s orbit around the Sun is almost a perfect circle.
Can the variation in distance be the cause of seasons?
No, for 2 reasons:
Distance changes out receipt of energy by only 3%
Northern Hemisphere has its summer when the southern hemisphere has its winter.
The plane of the Earth’s orbit in space is called the Ecliptic.
Earth’s Axiel Tilt
Viewed on the edge — ecliptic plane appears as a line.
Earth’s axis is tilted 23.5°
North end of Earth’s axis always point towards Polaris (The North Star)
The Earth’s axis is always pointed in the same direction in space
No matter what time of year or time of day.
Seasons
What causes seasons?
Summer has higher sun angles
More intense radiation which causes more warming power than in winter.
Summer has longer days
The sun is able to warm the earth’s surface for a longer period each day in winter.
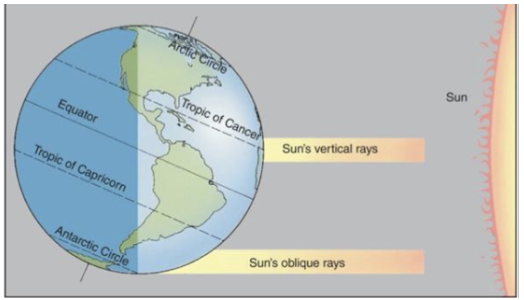
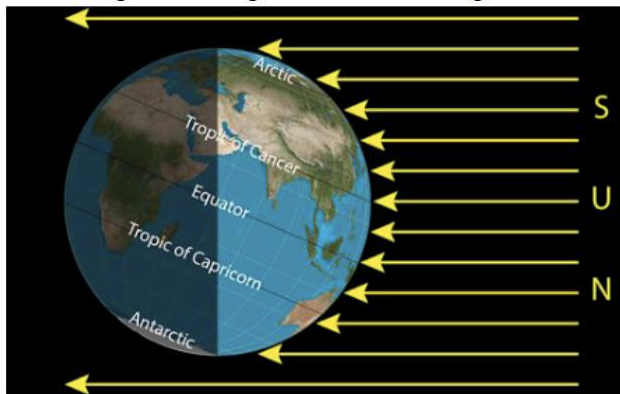
Northern Hemisphere Summer
Sun’s most direct rays are in the northern hemisphere.
Latitudes in northern hemisphere are getting longer periods of daylight.
Tropic of Cancer is getting more sun rays than a Tropic of Capricorn
What about distance of the Earth to the Sun?
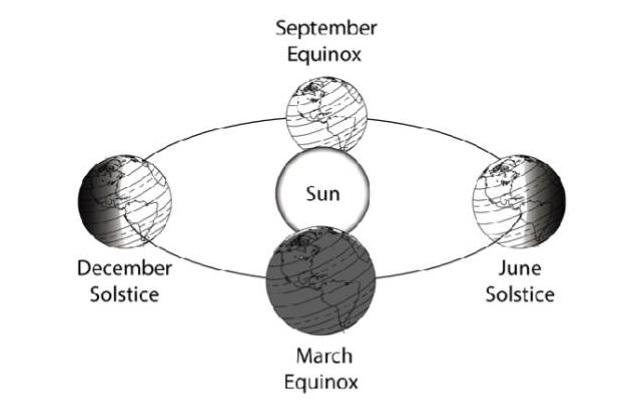
The Four Seasons
Seasons determined by the Earth’s tilt and where earth is in its orbit around Sun.
Northern Hemisphere gets maximum radiation (highest sun angles and longest days) in June.
Southern Hemisphere gets maximum radiation in December.
The Solstices and day length
June Solstice — June 21st
Beginning of Northern Hemisphere’s summer / Southern Hemisphere’s Winter
Days in Northern Hemisphere are longest for the year.
Days in Southern Hemisphere are shortest for the year.
Northern Hemisphere sun angles are high and Southern Hemisphere sun angles are low.
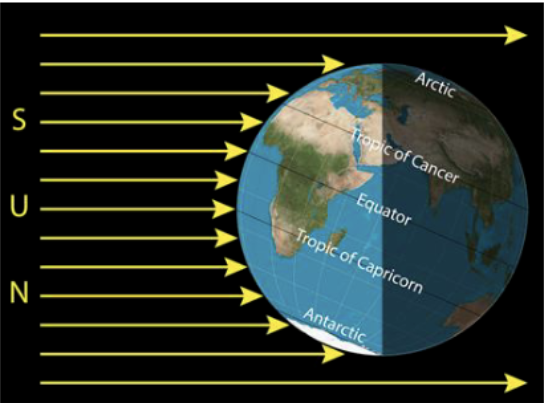
December Solstice — December 21st
Beginning on Northern Hemisphere Winter and Southern Hemisphere Summer
Days in Northern Hemisphere are shortest for the year.
Days in Southern Hemisphere are longest for the year.
Northern Hemisphere sun angles are low and Southern Hemisphere sun angles are high.
The Solstices and Equinoxes.
09/03/2025 (Lab)
How do you know how far east/west you are in the ocean?
If you know your local time, looking at the sun.
Lets say it’s noon where you are, compare it with time in some other place in the world (prime meridian, Zulu Time)
If east of it subtract time
If west add time
15° of Longitude is equal to 60 minutes of time.
09/05/2025
The Atmosphere is made of?
The atmosphere is a mixture of
individual gas molecules
Suspended microscopic particles of solid and liquid
and falling precipitation
How ‘big’ is it?
The Earth’s atmosphere is commonly defined as extending to 480 km (300 miles) above sea level.
Space is internationally accepted as beginning at the Karman Line-100Km ( 62 Miles). 99.999% of the atmosphere lies below this altitude (1.6% of Earth’s radius).
The international space station orbits at about 408KM (254 Miles)
How “big” is the atmosphere?
99% of atmospheric particles are contained in the lowest 30km (18.6. miles) of the atmosphere - or the lowest 6% of the atmosphere’s total height as a whole.
However, there is considerable mass contained in the atmosphere: mass contained in the atmosphere: 5.15 quadrillion tons (5.15 × 10¹⁸ kilograms). The force of this mass pushing downward on the Earth’s surface is what we call atmospheric pressure.
Atmospheric Gasses
Gasses can be exchanged between Earth and the atmosphere (it is a system) through geological or biological processes. So some gasses can vary:
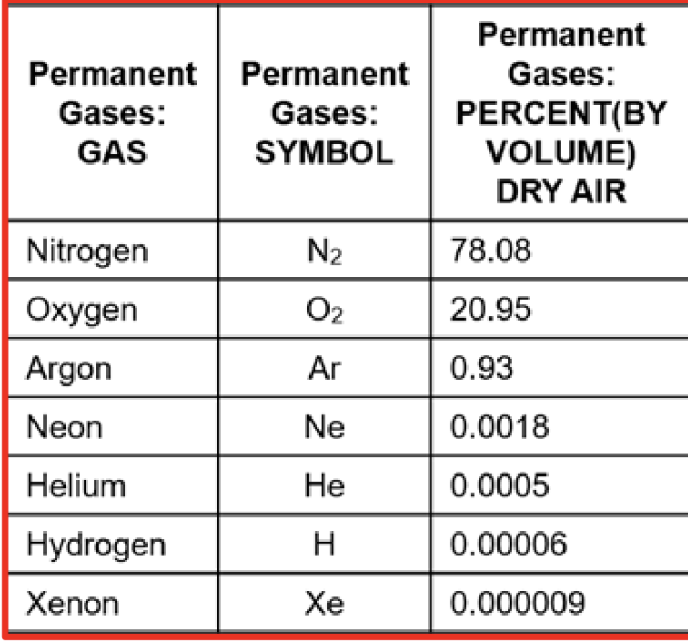
Permanent gasses
Stable proportion of atmospheric mass.
Most common is nitrogen, oxygen, and argon.
Variable gasses:
proportion varies in time and space
most common is water vapor and carbon dioxide.
Composition of Atmosphere near surface
Remember:
Nitrogen is 78.08
Oxygen (round to 21%)
Argon is 0.93
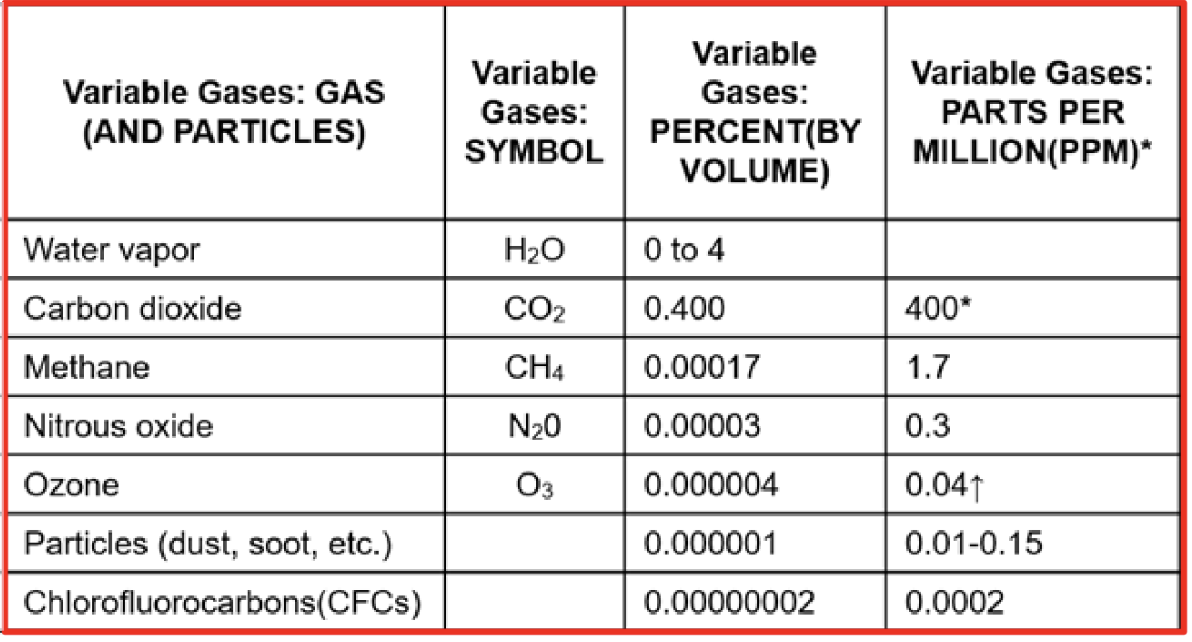
Remember:
Water Vapor is H20V [The little “v” indicates it is water]
This is 0% to 4% by volume
It is never actually 0%, it gets hella close though
Goes up to around 4%
Carbon Dioxide 0.400% or 400 parts per minute (400 out of 1,000,000 are carbon dioxide molecules)
Oxygen and Carbon Dioxide
Oxygen (O2) is 2nd most abundant gas and is of course required for animals to breathe and convert (oxidize) food into energy.
Carbon Dioxide is a very small part (0.4%) of atmosphere, so it is often expressed as parts per million (PPM) - now about 425 PPM (compared to 285 PPM per-industrial level).
Ozone
In the upper atmosphere, ozone is created and destroyed due to ultraviolet radiation - which ultimately protects us from harmful UV radiation
O2 + UV —> O + O —> O2 + O —> O3
Water Vapor
Water Vapor ( water in its gaseous state) is always mixed into our lower atmosphere.
Invisible gas. Clouds and fog are actually tiny droplets of water.
You can feel humidity on a hot (or even cold) day.
Varies in time and space - from 0.2% by volume in cold, dry climates to nearly 4% in humid tropics.
Massive source of stored energy.
Aerosols and Particulates
Aerosols are tiny solids or liquids suspended in the atmosphere,
Sulfur dioxide
Smoke
Particulates are a kind of aerosol more specific to solid particles
Ash, dust, pollen
These are important due to their roles in absorption or reflection of energy and formation of precipitation.
Week 3
09/08/2025
Some units of measurement
Temperature in °C
0°C = Freezing point
Can go a lot lower and go into the negatives for physics
On Kelvin Scale 273K° is freezing
15°C = Earth average temperature
Meter for length
Square meters for area
Surface could be 1 meter on the side
Total area than would be 1 square meter
Area is “A”
Cubic meters “m3” = volume “V”
Kilograms (Kg) = Mass
Mass (m) * Acceleration (a) = Force (F)
F(Kg * (m/s)/s) kgms-2 = 1 newton
Can measure the force as pressure
Vertical Structure
Earth’s surface = 15°C
Earth’s atmosphere is divided into four major layers, based on temperature trend from bottom to top:
Troposphere
Tropopause = -60°C
Stratosphere
Stratopause = 0°C
Mesophere
Mesopause = -90°C
Thermosphere
Upper Thermosphere = >100°C
Direction of temperature
Negative in troposphere and mesophere
Positive in stratosphere and thermosphere.
Change in Density
Mass of air, and therefore density both decrease with increasing altitude.
Change in Pressure
In the upper atmosphere, less mass results in lower force. So, pressure is lower.
Greater mass in lower atmosphere increases force, so pressure is greatest at the sea level.
Troposphere
The troposphere is where nearly all weather takes place, primarily due to the presence of nearly all water vapor and atmospheric particulates.
Warm at the bottom due to the absorption of sunlight at the earth’s surface.
Air temperature decreases with rising altitude.
About 6.5°C / 1000m (3.6°F / 1000ft)
This is called average tropspheric lapse rate of normal lapse rate.
Shallowest of the layers, but about 80% of mass and considerable mixing particularly due to its negative temperature trend and its abundant water vapor.
Tropopause
The tropopause is the boundary between the troposphere and the stratosphere.
It is located where the temperature ceases to decrease with increasing altitude (Temperature trend becomes isothermal).
Average about 11km above sea level.
Up to 17km at equator.
About 9km at poles.
Stratosphere
Air temperature increases with increasing altitude (a positive relationship).
Notice that the coldest air in the stratosphere is lowest in elevation - this layer is stratified by temperature.
At these upper elevations, most heating is due to the absorption of UV radiation by oxygen and ozone.
Ozone maximum is in the lowest sratosphere but most of the warming is at the top, where most UV is absorbed.
The stratosphere is more than triple the thickness of the trophosphere but it only accounts for 20% of atmospheric mass.
Within the stratosphere lies the ozone layer at about 20-30km.
Even at its maximum, ozone only occurs at about 10 PPM, but it protects life from harmful UV radiation.
Mesosphere and Thermosphere
Only 0.1% of atmospheric mass is in these two zones combined.
In the mesophere most heating comes from the absorption of UV radiation near the stratopause and any remaining heat disperses with altitude (note the decrease in temp with altitude).
In the thermosphere, molecules absorb raw sunlight, so they move very fast but are so sparse that high temps are misleading.
Heat content includes kinetic energy (speed) and mass.
A normal thermometer wouldn’t be able to detect the high temperatures.
09/10/2025 (Absent)
Transfer of energy in the Earth - Atmosphere System
Methods of energy transfer
Conduction
Transfer of heat on an atomic/molecular level by physical contact.
Example: making cookies and accidentally touch oven grate and burn your fingers (conduction of heat from the grate to your finger).
Convection
Transfer of organized flow of molecules and the energy that they contain.
Example: Rising columns of warm air on a sunny day.
Radiation
Transfer of heat by electromagnetic waves
Example: Cooking smores on campfire and you toast the marshmallow on the stick, but it cooks without using the fire.
Conduction and Convection
Convection
Organized movement of molecules and the energy that they contain.
Warming air gains heat (expands and rises)
Cool air loses heat (contracts and shrinks)
Conduction
Transfer of heat energy by direct contract of molecules.
Heat energy (vibration of atoms) passes from one place to another.
Body Radiates According to Their Temperature
Rate of radiation
Hotter = faster and more intensive
Type of radiation
Hotter = shorter wavelengths
Temperature and Heat
Temperature
Measure of molecule kinetic energy
Warm weather is more energetic than cold
Measuring temperature
Proxy measurement (expression) or molecular motion
Kelvin Scale
Celsius Scale - water boils at 100°
Fahrenheit Scale
Heat
Energy transfer
Example: pan of water on a hot stove, energy goes from the stove, through the pan, and into the water.
Heat moves from the warmer object to colder object.
Thermal Gradients
Rate at which heat flow is controlled in part by the difference in temperature between 2 objects.
If 2 objects have larger differences in temperature, and they are close together, thermal gradient is steep, and energy will move fast.
Heat moves whenever energy is going from one object to another.
Always moves down the thermal gradient (warm to cold)
Heat does not move when temperature is the same.
Heat Capacity
Specific Heat - Amount of heat required to change the temperature of a specific amount of substance by 1°.
High Heat Capacity means substance is slow to change temperature, because it takes a lot of heat to increase temperature by 1°.
Temperature changes fastest when materials have low heat capabilities.
Earth’s Energy Budget
Earth’s Radiation Balance
Input 100% - incoming shortwave radiation from the sun
34% - reflected shortwave
Planetary Albedo (Reflectivity of the Earth)
66% - Radiated longwave (thermal infrared) from Earth
Most terrestrial radiation is absorbed by the Earth’s surface.
47% - absorbed by Earth’s surface
19% absorbed by the atmosphere
Energy Transfers in the Earth-Atmosphere system
Radiated Earth is either reflected (scattered), transmitted, or absorbed.
Reflected radiation is lost to the system (like it was never there)
Transmitted radiation just passes through.
Absorbed radiation will raise the temperature of whatever is absorbing it.
09/10/2025 (Lab)
The Scientific Method
Hypothesis
A hypothesis can fail without being wrong.
If the evidence does not support the hypothesis it fails.
You can still collect more evidence to make it correct.
“Just because your hypothesis wasn’t supported by the evidence, that doesn’t mean it is wrong”.
Discussion
Where you basically yap/explain.
Explain why or why not you’re throwing away your hypothesis.
The north should be colder than the south but you might’ve just gotten bad data.
Some people may trust their data more than their hypotheses, sometimes they trust the hypothesis more than the data.
“How you’re results line up with your hypotheses, and what you expected, and what you got.”
You need to put some reasons why your results didn’t line up with your hypothesis. If they did, you still gotta do a discussion to explain why.
“Why these results occurred”
Analysis of results
“What you found”
Conclusion
“Even though I rejected my hypothesis, here’s what I know to be true”
Sharing
Starts with peer review
Sending manuscript to a journal/publishing house
Editor than sends it out to peer review
They look at everything
Publishers can retract it if they don’t think it is correct
Hypothesis
A prediction
Formal prediction on what you think is going on.
If you make one after the experiment is done, it’s either accepted or failed.
Test either supported or failed to support hypothesis.
YOU WILL NEVER EVER PROVE YOUR HYPOTHESIS
Don’t ever use the word “prove” when it comes to your hypothesis.
“Nothing is ever proven, not ever, not ever”
Theory
A conceptual model on how something works
Newton’s so called “laws” were laws because the math worked so well.
That’s why it became what they call a “law”.
Fact
Something that is measurable
Belief
Not measurable
“Based on something else”
Observation
Recorded data
Use the data to draw a conclusion
Bias
Happens when you don’t separate belief and facts
Everyone develops bias without realizing.
Replicable
Needs to be this
Fasifiable
Most relates to the hypothesis
Week 4
09/15/2025
Latent Heat
Water is the only substance that exists in all three states of matter within normal temperature range of Earth’s atmosphere. When water undergoes a phase change, heat is either either released to, or taken from, the environment around it. This is known as latent heat exchange.
Heat = Energy when professor is yapping
As humans we feel sensible heat, such as a hot 100° day. We cannot feel latent heat, but we can feel the effects of latent heat exchange.
If you go into a pool on a hot day and emerge in a nice breeze, your skin feels cool. The air is evaporating water from your skin, which requires energy to be absorbed by the evaporating water. Evaporating molecules require heat, and they get it from your body, leaving your skin cool.
Heat
Heat = Energy
Types of heat
Sensible heat
Changes in this register in a thermometer.
Heat you can feel
Latent Heat
Changes occur when water changes state.
Heat that you can feel through evaporation.
Energy Absorbed —> Sensible Heat
Or —> Latent Heat
Primarily Sensible
Energy Absorbed by Larol —> Sensible (increased temperature)
Or —> Latent Heat
Primarily Sensible
Energy absorbed by water —> Sensible
or —> Latent (evaporation)
Most of the energy will go to evaporating water
Latent heats of water
Ice to water at 0°C: 90 cal/g
Water to water vapor at 100°C: 540 cal/g
Water to water vapor of 0°C: 590 cal/g
Ice to water vapor at 0°C: 670 cal/g
Outline
Latitude
Land/sea distribution
Water heats slowly, and cools slowly.
It stores huge quantities of heat nearby coastal lands thus maintain a near constant temperature - moderate summer, moderate winter.
Why does water moderate temperatures?
Heat capacity of water is greater than that of land - more energy is required to heat 1 gram of water by 1°C.
Water is transparent: energy can spread through a greater volume of water.
Water mixes constantly, transferring heat within it.
water is constantly evaporating and thus cooling.
Ocean currents
Continental Temperatures are much more extreme than maritime temperatures.
Maritime summers are cool, but their winters are mild.
Compare winter temperature in Minneapolis (-4°F) with those in Seattle (40°F)
Surface ocean currents transfer warm water from low to high latitudes and cold water from high to low temperatures.
Ocean currents move in GYRES (specific large currents that circulate water) within a basin, pushed by the surface winds.
Cold currents cause air temperatures above them to be lower. Nearby coastal regions are likely colder. An example is the California Current, or the Peru Current.
Warm currents cause air temperatures above them to heat up. Nearby coastal regions might be warmer and more humid. An example is the Gulf Stream-North Atlantic Drift.
Elevation
Land form barriers
Human activities
Temperature Distribution at Earth’s surface
Annual Temperature Changes
Vertical Temperature Patterns
09/17/2025
Outline
Controls of Earth’s Surface Temperatures
Latitude
Land/sea distribution
Ocean currents
Elevation
With the troposphere temperatures decrease with increasing altitude or elevation.
We can see the impact of this in snow-capped mountains, including those found at and near the equator.
The 5 Peruvian cities below are all at 15°S. Mean daily temperature decreases as elevation as elevation increases, while temperature range increases.
Land Form Barriers
Human activities
Temperature distribution at Earth’s surface
Annual Temperature Changes
Vertical Temperature Patterns
Isotherms
Isotherms are lines of equal temperature.
Each place on the line has the same temperature.
Look for steep temperature gradients or closely-spaced lines.
Look for gentle temperature gradients or widely-spaced lines.
Temperature varies with latitude: why?
The further you are from the equator the colder it becomes.
Geographical Temperature Patterns at Earth’s Surface
Isotherms are shown: lines of equal temperature
Each place on the line has the same temperature
Look for steep temperature gradients or closely-spaced lines.
Look for gentle temperature gradients or widely-spaced lines.
Temperature varies with latitude: why?
Average temperatures adjusted for elevation by adding 6.5°C for every 1000 meters of elevation (i.e. temperatures are adjusted to sea-level equivalent)
Maps show January and July to represent seasonal extremes of temperature, after a lag of 30-40 days beyond each solstice.
Summary of Seasonal Temperature Maps
Isotherms show impacts of latitude & seasonality.
Steepest temperature gradients occur in the winter hemisphere.
Continental extremes of temperature: warmth moves pole-ward in summer, cold moves equator-ward in winter.
Steeper temperature gradients are found on east coasts in winter, west coasts in summer.
Ocean currents are apparent: warmer on east coasts, cooler on west coasts.
Southern hemisphere is the “water hemisphere” - so there is less variation in temperature.
Temperature lag means that peak warmth or peak cold is delayed after the respective solstice, especially over water.
The Normal Lapse Rate.
We have already seen that the temperatures of the atmosphere change with elevation. These rates of change are called lapse rates.
The average rate of temperature change in the troposphere is the normal lapse rate, and it amounts to 6.5°C/1000m.
Remember that number.
By convention, we usually leave off the negative sign, but remember that the normal situation in the troposphere is cooling with increasing altitude.
Temperature Inversions.
A temperature inversion is when the temperature increases with altitude rather than the normal trend of decreasing with altitude.
Inversions cause at ground level are called surface inversions.
Upper level inversions are anything above the ground level.
Types of Inversions: A Summary
Surface
Radiation: Radiational cooling at night.
Topographic: Cool air is heavy, and flows to low elevations like valleys.
Advection: Cool air blows in from another location and displaces warmer air above the incoming cold air.
AT THE GROUND LEVEL
Upper Air
Subsidence: Sinking air warms by compression.
ABOVE GROUND LEVEL
09/19/2025
Pressure.
Pressure is defined as a forced applied over an area, for example, pounds per square inch.
Air pressure is the weight (force) of air above a surface (area).
In the metric system we use a force unit of newtons per square meter of area (1N/m2 = 1 pascal).
Sea-level pressure is 101,325 Pa, which is equal to 1013.25hPA [Pa = Pascals] (or mb).
Pressure is the weight of molecules above some level in the atmosphere.
Atmosphere Pressure.
Notice how altitude affects air pressure:
Higher in the atmosphere there are few molecules above us, therefore the pressure goes down in that direction.
Lower Altitudes = higher pressures.
Notice also that air density and air pressure have the same shape when graphed against altitude:
Density is defined as the amount of mass in a volume of space, like kilograms per cubic meter.
Higher pressures mean higher density of molecules.
Discovering Air Pressure.
It has long been known that water can be sucked up a tube, as a siphon, but only so far (33 feet).
In 1643, Evangelista Torricelli, a student of Galileo, came up with a hypothesis: the weight of the atmosphere is equal to the weight of a 33 feet column of water.
Torricelli did an experiment with mercury, and predicted that it would rise to only 2.5 feet (because it is 13.6 times denser than water (33/13.6 = 2.5)).
Mercury is a lot denser than water.
He was right: The mercury only rose to a height of 0.76 meters (=2.5 feet/3.28ft/m).
Because his tube was sealed at the top and open on the bottom, it could only be air pressure that was supporting the mercury column.
French mathematician and physicist, Blaise Pascal, put Torricelli’s hypothesis to a further test in 1648. He had his brother-in-law carry a mercury barometer up a mountain to see if the level of mercury in the column fell.
It did, confirming Torricelli’s idea that the weight of the overlying atmosphere was balancing the weight of mercury in the tube.
Measuring of Air Pressure.
Average Air Pressure at Sea Level
14.7 lbs/inch2
29.2 inches of mercury (Hg)
760 mm Hg
101,325 Pa (1 Pa = 1 N/m2)
1013.25 hectopascals (hPa)
1013.25 millibars (mb)
Variations in Surface Air Pressure
Air pressure on the earth’s surface varies according to:
Elevation/altitude
Higher locations have lower pressure
Maps of atmospheric pressure are adjusted so that all locations are mapped as if they were sea-level
Vertical motion (convection)
Rising air causes low pressure
Subsiding air cases high pressure
When we look at weather maps, the effect of elevation has been taken into account, so the only thing that is affecting pressure is vertical motion.
Week 5
09/22/2025 (Absent).
What causes Vertical Motion of Air?
Thermal causes (action is at the earth’s surface)
Warm air expands, becomes less dense and rises.
Cold air contracts, becomes more dense and subsides (sinks).
Dynamic causes (action is aloft — near the troposphere)
Diverging air high above the surface (aloft) causes air to be lifted or to rise.
Converging air aloft causes air to subside.
Thermally-induced Pressure Variations.
Warm surfaces cause air to expand.
When air expands, it becomes less dense, and so it rises.
Rising air always creates surface low pressure.
Cold surfaces chill air and causes it to become more dense, so it sinks.
Subsiding air always produces surface high pressure.
Dynamically-induced Pressure Variations.
Divergence aloft causes air below to rise.
Rising air always creates surface low pressure.
Convergence aloft pushes air downward to the surface.
Subsiding air always produces surface high pressure.
Cells of High and Low Pressure.
Whenever air converges at the surface it is also rising.
Rising air creates low pressure and is associated with cyclones.
Whenever air subsides, it causes divergence at the surface.
Subsiding air creates high pressure and is associated with anticyclones.
Mapping Pressure Distributions.
Maps of surface air pressure use lines of constant pressure, called isobars, to depict the pattern of surface air pressure variations.
A pressure gradient occurs when pressure changes across a distance. Air always moves down pressure gradients - away from highs and toward lows.
A center of high pressure is called an anticyclone.
Air is not only sinking in the anticyclone, but it is also diverging away from the center of high pressure.
A center of low pressure is called a cyclone.
Air is converging toward the middle of low pressure as it rises.
Cyclones and Anticyclones.
Air in the vicinity of the high pressure center is subsiding. All high pressure centers are called anticyclones.
Air near a low pressure center is rising. All low pressure centers are cyclones.
Pressure Gradients.
A pressure gradient is the change of pressure per unit distance (e.g. mb/100km).
Pressure gradients are “steep” when there is large change in pressure per unit distance.
Cyclones are often zones of steep pressure gradients, while anticyclones always have shallow gradients.
Pressure and Altitude.
We can think of altitude in terms of pressure.
Wind.
Wind is the horizontal motion of air.
Wind has speed and direction.
Wind speed varies according to the steepness of a pressure gradient, which is the difference in pressure per horizontal distance (e.g. ∆P(hPa)/100km).
Wind direction is the combined result of two things:
Direction of the pressure gradient (always perpendicular to isobars and from higher to lower pressure).
Coriolis deflection due to earth’s rotation.
09/24/2025
Wind.
Wind is the horizontal motion of air.
Wind has speed and direction.Wind speed varies according to the steepness of a pressure gradient, which is the difference in pressure per horizontal distance.
Wind direction is the combined results of two things:
direction of the pressure gradient (always perpendicular to isobars and from higher to lower pressure)
Coriolis deflection due to earth’s rotation.
Wind Speed.
Wind speed is a direct results of the steepness of the pressure gradient.
Wind Direction.
On a non-rotating earth, wind direction would simply be the most direct path from high pressure to low pressure, that is, straight down the pressure gradient.
However, because the earth rotates, our frame of reference for direction is also rotating.
This means that what appears to be a straight line when seen from an observer in space is a curved path for us on earth.
This is turning from a straight line to a curved path is called the Coriolis Effect.
Coriolis Effect.
When see from above the North Pole, the earth is rotating counterclockwise, but when viewed from above the South Pole, the earth is rotating clockwise.
Northern Hemisphere = counterclockwise
Southern Hemisphere = clockwise
This means that the Coriolis deflection is to the right in the Northern Hemisphere, and to the left in the Southern Hemisphere.
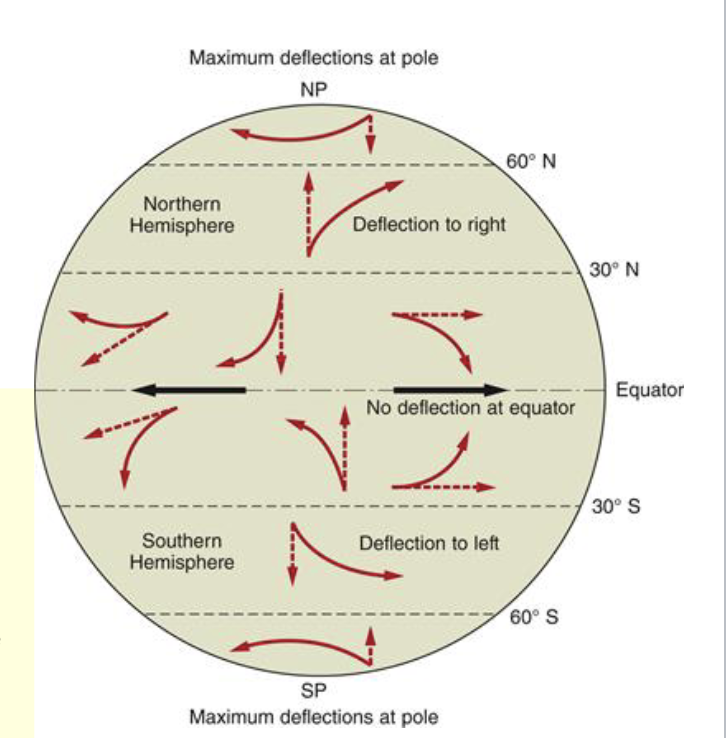
The dashed arrows show the direction of the pressure gradient (the “intended” direction of the wind).
The solid arrows show the actual direction due to Coriolis.
Notice:
The amount of deflection increases with latitude so…
…There is a maximum deflection at the Poles and …
…Zero deflection on the equator.
Coriolis Effect: Know these four rules.
The direction of Coriolis deflection is determined by hemisphere:
Northern/rightward
Southern/leftward
The maximum of Coriolis deflection is determined by latitude:
Maximum at the poles
Zero at the equator
Coriolis increases with latitude
Coriolis effect also increases with wind speed.
Finally, Coriolis always acts at right angles to the wind direction: if the wind is blowing, Coriolis is always “trying” to deflect it to the left or right.
The Coriolis Force.
Coriolis is just as often referred to as a “force” as it is an “effect”.
For those of you who appreciate equations, here is the equation for computing the magnitude of the Coriolis Force.
CF = -2Ωsinφ V
Where Ω is the rate of the earth’s rotation in radians per second (its constant, so you can ignore this for our purposes)
φ is the latitude in degrees
and V is the velocity (speed) of wind in meters per second.
Wind Speed and Direction: A Summary.
Wind speed is dictated by the steepness of the pressure gradient (i.e. the spacing of isobars on a pressure map).
Wind direction is a combination of:
The direction of the pressure gradient
The amount and direction of deflection (left or right) due to Coriolis.
Coriolis deflection is in turn controlled by:
Wind Speed
Latitude
Notice in the list above, how the pressure gradient controls wind speed, and then wind speed determines the amount of Coriolis deflection. Let’s pursue that idea…
Geostrophic Balance.
The initial tendency of the air is to move down the pressure gradient.
However, as soon as it moves, it is deflected away from that path by Coriolis.In the Northern Hemisphere, the air incurs a rightward deflection until it is moving at right angles to the pressure gradient.
This wind resulting from this balance is called geostrophic flow. It results from the pressure gradient form and the Coriolis force being exactly balanced when the wind is flowing parallel to isobars.
Finding Geostrophic Wind Direction: Three Easy Steps.
Find the direction of the pressure gradient from higher to lower pressure.
Turn to the right for the Northern Hemisphere (Left for the Southern Hemisphere).
When the wind is parallel to isobars, the flow is geostrophic.
Effects of Friction.
Geostophic flow is actually never quite achieved, but it almost is at high altitudes.
Two things prevent pure geostrophic flow:
Friction
Curvature of isobars.
Both of these are most important near the surface of the earth, but friction in particular.
You will remember that the strength of the Corioilis Force is dependent on wind speed.
Friction slows the wind, and therefore Coriolis Force is reduced. The pressure gradient, however is not affected.
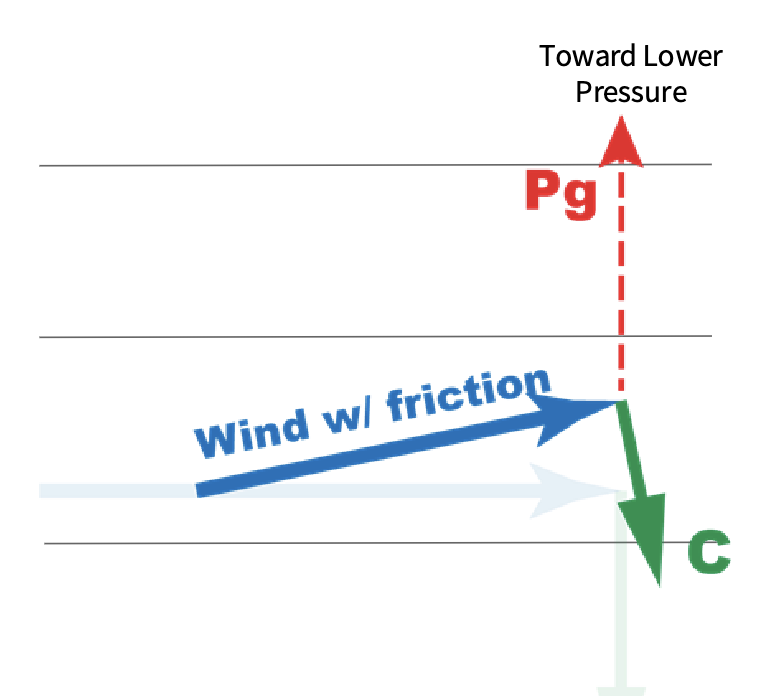
Notice how the wind now will cross isobars where geostophic wind never would.
Geostrophic flow in the upper trophosphere.
The red arrows in this diagram show the direction, and they are sealed to be longer where the pressure gradient is steeper as in the NE part of the map.
Geostrophic winds are the green arrows. Notice how they are also scaled to indicate wind speead according to their length.
These arrows are called vectors, and they show magnitude and direction at each point represented by the center of each circle.
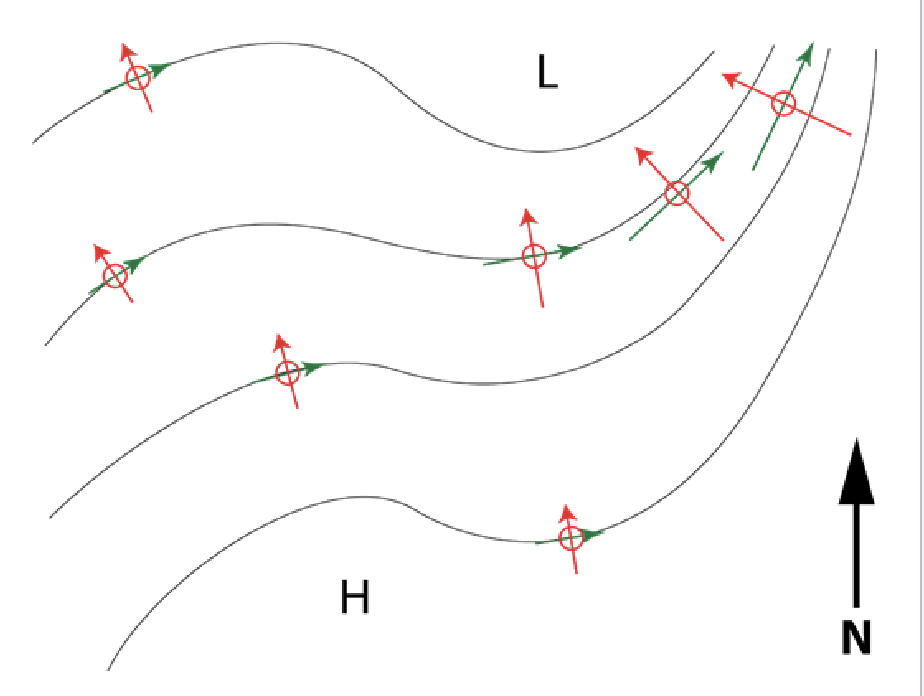
Geostrophic wind compared to frictional wind.
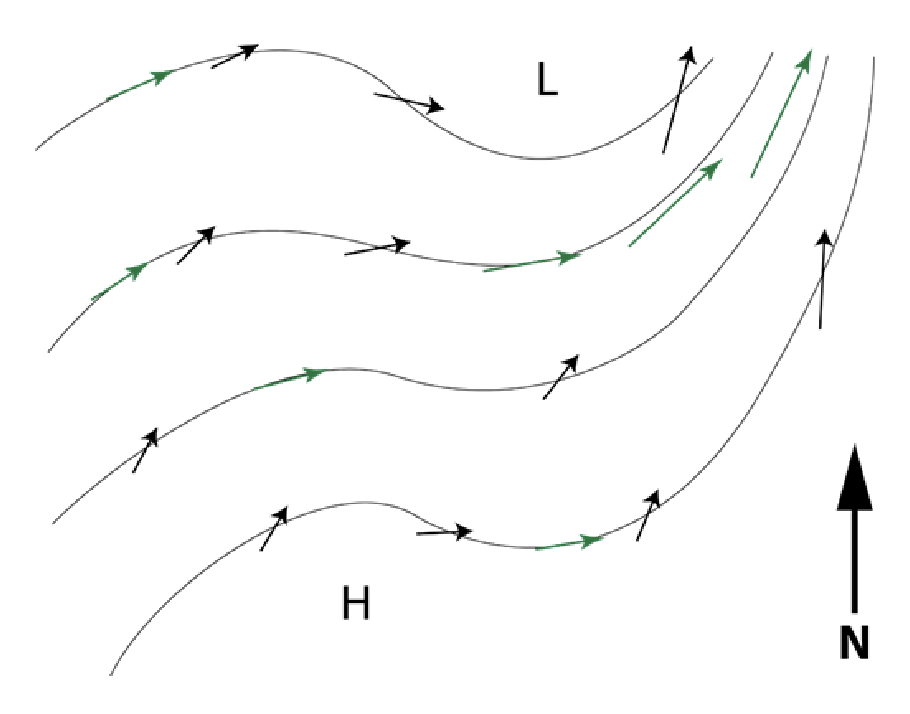
This map is the same as the last one, except that the pressure arrows have been removed, and the friction arrows have been added.
The green arrows show wind without friction, and the black arrows show slower winds, now crossing isobars toward lower pressure.
How to determine wind direction on any pressure map.
Look for areas of higher pressure and lower pressure. The pressure gradient will be perpendicular to isobars, and pointing toward lower pressure.
Imagine an arrow pointing down on the pressure gradient.
Now turn the arrow to the right (if this is a place in the northern hemisphere) until the arrow is parallel to the nearby isobars. This is the geostrophic wind.
If this is a surface map, there is friction to consider. Take your geostrophic wind arrow and turn it slightly (about 30°) toward lower pressure.
09/24/2025
Use cos(x) to solve circumferences of latitudes
cos(60°) = 0.5
0.5 * [Earth’s circumference] 40,000km
20,000 km is the circumference at 60° latitude
Week 6
09/29/2025
A few words about wind terminology.
Winds are always named for where they come from, usually a direction.
Wind from the north is a north wind or northerly
A wind from the south is a south wind or southerly.
If a shoreline or a slope faces into the wind, then it is windward.
If it is a side facing away from the wind, then it is leeward.
Winds that dominate from a particular direction are called prevailing winds.
For example, we live in a zone of prevailing westerlies, meaning that most of the time the winds come from somewhere out of the west.
In the tropics, the winds are prevailing easterlies: the Trade winds.
Circulation around northern hemisphere low pressure.
Notice the circulation patterns around the northern hemisphere (low pressure):
Counterclockwise and converging towards the center.
Remember 1-2-3 rules for determining wind direction:
(1) Point down the pressure gradient.
(2) Turn to the right (Geostrophic wind)
(3) Back off about 30° (surface wind)
Circulation around northern hemisphere high pressure.
Notice the circulation patterns around the northern hemisphere (high pressure)
Clockwise and diverging away from the center.
In the northern hemisphere:
Clockwise is anticyclonic (highs)
Counterclockwise is cyclonic (lows)
Facts about centers of low pressure.
The are zones of rising air.
They are associated with clouds and precipitation.They are cyclonic.
They are centers of convergence at the surface.
They are associated with divergence aloft.
Facts about centers of high pressure.
They are zones of subsiding air.
They are associated with clear skies and calm weather.
They are centers of divergence.
They are associated with convergence aloft.
Circulation around centers of high and low pressure.
Around high pressure, circulation is said to be anticyclonic.
Around low pressure, circulation is said to be cyclonic.
In the northern hemisphere, cyclonic is counterclockwise; anticyclonic is clockwise.
Southern hemisphere
Cyclonic is clockwise
Anticyclonic is counterclockwise
Ridges and troughs.
These are places where pressure reaches a high (ridge) or low (trough) in a zone that does not quality as a center of high or low pressure.
Ridges.
The pressure goes down on both sides of the ridge.
The ridge marks a line of relatively high pressure in between two lows.
Just as with any zone of high pressure, a ridge is a zone of divergence and subsidence.
Troughs.
The pressure goes up on both sides of the trough.
The trough marks a line of relatively low pressure in between two highs.
Like any zone of low pressure, a trough is also a line of convergence and rising air.
Cyclones.
Vertical direction of air is rising or upward.
Centers of low pressure.
Rotation is counterclockwise in Northern Hemisphere.
Rotation is clockwise in Southern Hemisphere.
Horizontal direction of flow is converging or inward to center.
Anticyclones.
Vertical direction of air is subsiding, descending, or downward
Center of high pressure
Rotation is clockwise in northern hemisphere.
Rotation is counterclockwise in southern hemisphere.
Horizontal direction of flow is diverging or outward from center.
10/01/2025
Jet Streams.
Subtropical Jet (STJ)
Located above the STH
Zone of convergence aloft
Polar Front Jet (PFJ)
Located above the polar front
Produced by steep Pg aloft (200-300mb level)
Upper level winds and jet streams
Pressure gradient aloft is controlled by air temperatures: warmth in tropics; cold in polar regions.
Warm air = high pressure aloft
Cold air = low pressure aloft
10/03/2025
Jet Streams.
Subtropical Jet
Located above the STH
Zone of convergence aloft
Polar Front Jet
Located above polar front
Produced by steep Pg aloft (200-300 mb level)
Upper Winds and Jet Streams
Pressure gradient aloft is controlled by air temperatures: warmth in tropics; cold in polar regions.
Warm air = high pressure aloft
Cold air = low pressure aloft.
Kansas has clear skies in the powerpoint photo
Week 7
10/06/2025
Principal monsoon areas of the world
Monsoons are seasonal reversing wind systems.
They are most well developed in the vicinity of large continental land masses.
Maximum Poleward Positions of the ITCZ
Large continents also cause the ITCZ to migrate far from the equator during the summer season in each hemisphere.
Typical maximum poleward positions of the inter tropical convergence zone at its seasonal extremes.
The greatest variation variation in location is associated with monsoon activity in Asia and Australia.
We are focusing on the Eastern hemisphere since our action on the western hemisphere isn’t as strong.
December - February
Northeast trade winds bring stable, dry conditions to southern Asia during the winter months.
It is very cold in central Asia during the winter.
Asia does have a very dry winter though. 1=
June - August
Wet summer monsoon
Summer rains are brought to Southern Asia by the Equatorial Westerlies. Note the extreme latitudinal position of the ITCZ during the summer monsoons.
Monsoon Precip in India
Sudden onset and a more gradual end of summer monsoon rains.
African Monsoon System
Very unstable and rainy winds.
Drops a lot of the precipitation on the coast than decreases the more central Africa you go.
In the winter time
Wind coming from the north east (no water coming from that direction)
No water coming from the Middle East, no moisture.
Around 30° S is very dry because that belt of latitude is typically very dry.
NE trade winds during the winter.
Northern Australia Monsoon
Summer
North west trade winds
Equatorial north westerlies bring rainy summer.
South
South easterlies trades bring dry weather in winter.
Sea and Land Breezes
Sea Breeze
In the afternoon, the land is warmer than the ocean surface, and warm air rising from the land is replaced by an onshore sea breeze.
Land Breeze
At night, as the land cools, the air over the ocean is now warmer than the air over the land.
The ocean air rises. Air flows offshore to replace it, generating an offshore flow (a land breeze).
Valley and Mountain Breezes
Valley Breeze
Air rises from the valley up warm slopes.
Mountain Breeze
Air cools and flows down from the mountain peaks.
Any cold, dense, down-slope wind is called a katabatic wind.
Chinook Winds
Wind blows against a mountain range.
Air is forced up windward slopes, causing condensation and precipitation.
Latent heat is released and becomes sensible during condensation.
This warms the air on the leeward sides.
Leeward slopes are warm and dry.
Principle Ocean Currents.
North Atlantic
Gulf Stream
North Atlantic Draft
Canary
North Equatorial
South Atlantic
Brazil
Benguela
South Equatorial
North Pacific
Kuroshio (Japan)
North Pacific Drift
10/08/2025
The Water Cycle
In a single minute, through precipitation or condensation, the atmosphere gives up more than a billion tons of water, and an equal amount of water evaporates and sublimates back to the atmosphere as water vapor.
Heat involved with changes of state of water.
Talking about in lab today
Focusing on liquid to gas and than gas to liquid.
The Hydro Logical Cycle
Follow the energy
Solar energy is absorbed by water molecules.
Water uses that energy to become water vapor, and water vapor carries the energy into the atmosphere as latent heat.
Water vapor condenses as the air cools, so it releases the latent heat as sensible heat into the atmosphere.
The atmosphere loses sensible heat by radiation IR (long wave) to space.
Humidity
What is it?
Its source is evaporation from the earth’s surface.
It is limited in amount by air temperature (primarily).
What controls it?
How do we measure it?
Actual measures
Relative humidity
Proxy measures
Dew point temperatures
Wet bulb temperatures
Water vapor
Is a gas
Percent by volume
varies from 0 to 4 percent
Definitions
An air parcel
has known volume, pressure, temperature and density
Humidity
The amount of water vapor in an air parcel at a particular time and place
Vapor is a gas in air, just like other atmospheric gases.
Air parcels can only contain a certain amount of water vapor - their capacity for vapor is determined by temperature.
Warm air has more rapidly moving molecules, so has low density and high volume compared to cold air - thus is has more “space” for water vapor molecules - it has a high capacity for vapor.
We say warm air has a high capacity for water vapor
Has a lot of room for water vapor
Cold air has high density and low volume, so less room and a low capacity for vapor.
Can’t hold very much water vapor, has a low capacity for water vapor.
“Low capacity for water vapor”
If moisture is available, vapor content will be higher in warm air than in cold air.
Saturation is reached when air has reached its maximum capacity of vapor.
Saturation capacity increases as temperature increases, as seen in the saturation curve.
“As temperature goes up capacity goes up”
Air Parcels
Think of air parcels as containers of air with invisible walls.
Air molecules occupy the space, and their kinetic energy is known by their temperature: faster molecules mean a warmer air parcel.
Faster air molecules would also exert more force on the walls of the container, so that means that the pressure is greater, because pressure is the cumulative force of molecules per unit area.
Molecules has mass, so the mass of molecules in a volume is what we call density.
So we characterize any air parcel by its: (When professor is asking for the air parcel below is what he wants)
Volume (V)
Temperature (T)
Pressure (p)
Density (m/V = p)
p = greek letter rho
How do we measure humidity?
Actual measures
Vapor pressure, e(mb)
Vapor pressure measures the contribution of water vapor molecules to total atmospheric pressure.
It is measured in millibars (or hectopascals) just like any other gas pressure.
They curve (class example) represents the maximum vapor pressure (i.e. saturation vapor pressure) at various temperatures.
Mixing ratio, w (g/kg)
The mixing ratio, w, is the mass of water molecules per kilogram of dry air.
Water Vapor (g) / dry air (kg)
w is the mix of water with the non-water portion of an air parcel
Specific humidity (q, g/kg)
q is the mass of water vapor per kg of air (including the water vapor).
Vapor Density, pv, (g/m3)
Vapor density is the grams of water vapor in a cubic meter of air.
p with a “v” subscript will represent water vapor.
Relative humidity, RH (%)
Actual humidity content / capacity at current air Temperature (x100)
REMEMBER
Week 8
10/15/2025
Review
Dry Bulb Temperature, T (°C):
The ambient temperature of the air.
Dew Point Temperature, Td (°C):
The temperature to which air must be cooled to produce condensation.
Wet Bulb Temperature, TW (°C):
The coolest temperature that can be achieved due to evaporation of water into the air.
Getting air to its dew point
To bring air to its dew point temperature, it must be cooled to the point where its capacity equals its vapor content.
Drier air must be cooled more than air with a higher vapor content.
Two ways to cool the air
Remove sensible heat from the air
Increase its volume (exchanged sensible heat for work).
Remove heat:
This is a diabetic process because it involves a change in the heat content of an air parcel.
Increase its volume:
This is an adiabatic process because there is no change in the heat content of an air parcel. Energy just changes form from thermal to work.
Adiabatic Cooling
When an air parcel rises, the pressure around it is reduced.
This lower pressure allows the air parcel to expand.
The work of expansion is taken from the thermal energy of the molecules, and so the temperature goes down.
The air parcel is cooler, but it still has the same amount of heat as before.
Adiabatic Warming
When an air parcel descends, the air pressure around it increases.
This higher pressure squeezes the air parcel into a smaller volume.
The work done by compression adds to the thermal energy of the molecules, and so the temperature goes up.
The air parcel is warmer, but it still has the same amount of heat as before.
Amount of lifting and cooling to LCL
When vapor content is high, dew point temperature is high: T and Td are close together.
Such an air parcel might be lifted and cooled to dew point temperature easily.
When vapor content is low, dew point temperature is low: T and Td are far apart.
Such an air parcel would have to be lifted a long distance to cool by this many degrees. It may never reach saturation if lifting is insufficient.
Lapse Rates
A lapse rate is the rate of temperature change with altitude.
Lapse rates take the form of: ∆T/∆z
Units are C°/1000m (or °F/1000feet)
Up is cooler
Down is warmer
Two Types of Lapse Rates
Environmental:
Rate of temperature change with altitude in the troposphere. The ELR is measured with altitude in the troposphere. The ELR is measured with a weather balloon. The average environmental lapse rate is 6.5°C/1000m.
Adiabatic:
Rate of temperature change for a vertically moving air parcel due to its change in volume. The ALR is not measured, but calculated based on thermodynamic principles.
Lapse Rate Terminology
High (Or steep lapse rates)
High to low at a steep slope
Low (Or small lapse rates)
High to low at a lower slope
Isothermal (Or no lapse rates)
No slope, straight vertical line
Inversions
Low to high line (increasing slope, not decreasing)
Adiabatic Lapse Rate Changes at the Lifting Condensation Level
When unsaturated air is lifted:
it initially cools at the DALR (the dry rate)
if lifted enough it will reach its level of condensation (LCL)
further lifting will cause condensation and cooling will be at the wet (saturated) rate
10/17/2025
Stability Defined
Stability is the dgeree to which an air parcel resists vertical motion.
Buoyant air parcels will rise. They are unstable.
Buoyancty results from the air parcel being less dense than the surrounding air, and so it rises.
Buoyancy
Buoyancy is caused mainly by temperature difference between the air parcel and the surrounding air.
If the air parcel is warmer than surrounding air, it is less dense, and it will rise.
If the parcel is the same temperature of the surrounding air, it has the same density, and so it will remain in place.If the parcel is colder than the surrounding air, it will be more dense and sink.
Stable Air
When the air is stable, skies and generally clear, or the clouds that do form are flattened.
Unstable Air
When the air is unstable, clouds tend to build upward, and often precipitation will be the results.
Assessing Stability
To assess stability, we need to know about the environmental lapse rate (ELR).
The ELR changes during the day and from place to place, so weather balloons must be sent up frequently so that it can be measured.
Once we know the ELR in an area, then we can find out the stability of the atmosphere in that area.
Compare the ELR to the Adiabatic lapse rate
Remember the ELR is the temperature profile of the troposphere at a particular place and time.
The ALR measures the temperature change of a rising air parcel, and is either 10°/km (DALR) or the WALR (~5°/km), depending on whether the position is below of above the LCL.
Stable Air
If the ELR shows a relatively slow change in temperature with altitude compared to the adiabatic lapse rate, the air is stable.
Under these conditions, if an air parcel is forced upward, it will immediately be colder than the surrounding air.
If it is colder, it is more dense, and it resists upward motion.
Unstable Air
If the ELR shows a relatively fast change in temperature with altitude compared to the adiabatic lapse rate, the air is unstable.
Under these conditions, if an air parcel is forced upward, it will immediately be warmer than the surrounding air.
If it is warmer, it is less dense, and once nudged upward, it continues to rise.
Conditional Stability
Having water vapor and an ELR that is intermediate between the DALR and the WALR can create conditions of conditional stability.
Notice here that the DALR is steeper than the ELR, but the ELR is steeper than WALR.
All Lapse Rates Compared
Stability is determined by the ELR with respect to adiabatic lapse rates.
When the ELR is steeper than adiabatic conditions are unstable.
When the ELR is low or positive, conditions are stable.
Test Question: About conditional stability, where are the environmental lapse rates have to be?
Between dry and wet
Increasing Instability
A steeper ELR creates more unstable conditions. This happens because:
There is cooling aloft and/or
warming at the surface (which usually happens during the day ).
Remember that addition of water vapor also makes air more unstable.
Increasing Stability
Warming aloft increases stability by reducing the amount of cooling with altitude. This happens when air is descending in regoins of high pressure.
An inversion is a more extreme version of this.
Cooling at the surface stabilizes the air. Cold air at the surface has no tendency to rise.
Week 10
10/27/2025
Pre-Cyclone Phase Along the Polar Front
A stationary front marks an air-mass boundary where cold air has come up against warm air.
Wind directions, temperature, and dew points are in contrast across the front.
Cold side: northerly winds; cold air; dry (low Td) if cP; moist (higher Td if mP.
Warm side: southerly winds; moist if mT; dry if cT.
The setting for warm and cold fronts
When a center of low pressure forms along a stationary front, cyclonic circulation beginds. The counterclockwise circulation (NH) means that cold air will begin to advect southward to the west of the low, and warm air will advect southward to the west of the low, and warm air will advect northward to the eat of the low.
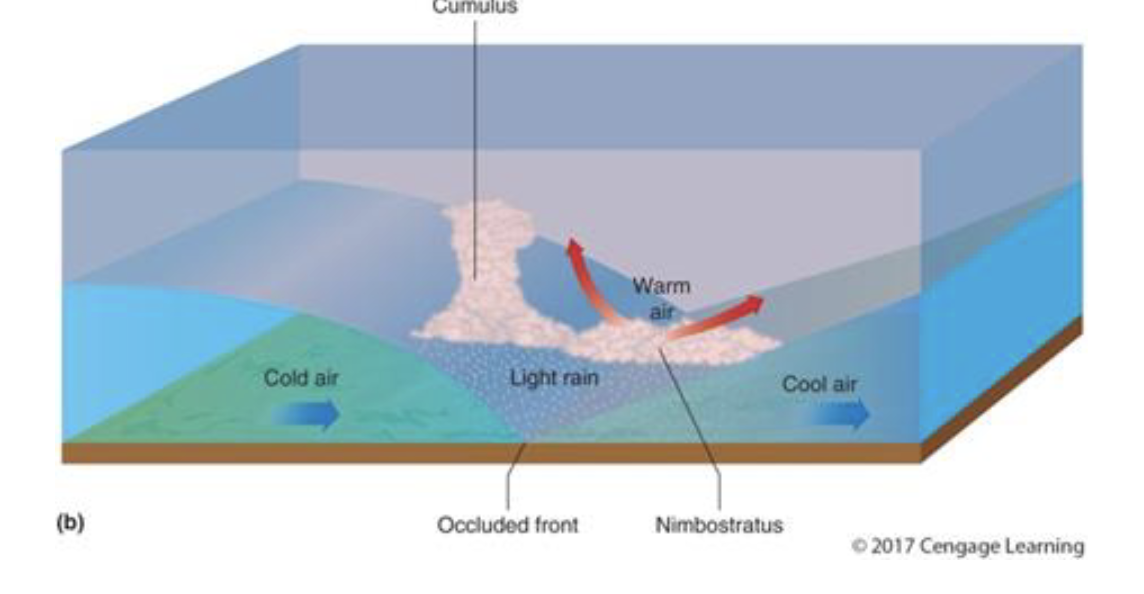
Occulded fronts
Cold fronts eventually overtake the slower moving warm fronts near the center of the low. This forms an occulded front (below and b).
To remove temperature contrast horizonatally but also to move heat vertically to the top of the atmosphere.
A Midlatitude Cyclone
When a center of low pressure forms at the surface along the polar front, cyclonic motion moves cold air southward and warm air poleward.
The warm air also is lifted above the surface, giving up its moisture and heat.
Two fronts typically form on either side of the low: a cold front to the west, and a warm front to the east.
Transect accross the fronts
The cold front advances and lifts warm air quickly.
The warm front moves against the cold air.
It pushes the cold air back slowly.
Warm air is lifted as it rides up the wedge of cold air below.
Cyclone on the day after the last slide: Late mature stage
Motion of the storm is toward the east with the movement of a wave in the jet stream.
Motion of the air is cyclonic (counter-clockwise) around the low.
Cold front is moving faster…
…Than the warmer front
Cyclone on the day after the last slide: occlusion
Cyclone is steered to the northeast by the jet stream.
Cyclonic flow continues around the center of the low
Cold front has caught up with part of the warm front to form an occluded front.
Pre-cyclone stage: stationary front
Air mass contrasts builds over time as the cold air gets colder and the warm air gets warmer.
Cyclone stage one: cold and warm fronts form
A center of low pressure develops along the frontal boundary. This happens due to dynamic lifting above the that location in the Polar Front Jet (PFJ).
Cycloic circulation begins.
Cold air moves against warm air on the west side, and warm air moves against cold air on the east side.
Cyclone Stage 2: fully developed cyclone
Cold front moves rapidly southward and eastward into the warm sector.
Warm air pushes against cold, but mainly just rises up and over the colder air at the surface.
Cyclone stage 3: occluded front forms
The cold front has caught up with part of the warm front to form an occluded front.
Warm air continues to move up and over the colder air to the north of the frontal boundaries.
Occluded low develops further, and the center of circulation moves farther away from the cold and warm fronts.
Lots of warm air has moved northward and aloft by this stage.
Post-Cyclone stage: dissipation
The warm air has been moved northward and aloft where it is losing the last of its heat.
Cold air has been replaced warm air over a large area at the surface.
The temperature contrast at the polar front has been temporarily reduced.
Upper-level flow during the passage of a midlatitude cyclone
Midlatitude cyclones are surface manifestations of flow aloft in the polar front jet stream.
A wave in the jet stream moves from west to east, and takes about 3 days to cross the U.S.
It provides upper-level support (i.e. lift) for the cyclone, just downstream of the trough axis.
The trough represents the cold air advecting southward. The ridges are warm air moving north.
Upper-level control of cyclones and anticyclones at the polar front
Convergence aloft, just downstream of a ridge axis produces dynamic high pressure at the surface.
Just downward of a trough axis there is divergence aloft. This produces a dynamic low, the center of midlatitude cyclone.
The surface low moves with the jet stream wave, from west to east.
10/29/2025
Midlatitude Cyclones
Cyclonic rotation
Rising air
Clouds and precipitation
Moderate wind speeds
Can get some (at higher latitudes) that have extremely high wind speeds “furious”
Air mass boundaries (fronts)
Dynamic low pressure due to divergence aloft
Heat movement is mostly latitudinal
There is some vertical motion but most of the motion is horizontal around the cyclone.
Tropical Cyclones
Cyclonic rotation
Rising air
Clouds and precipitation
High wind speeds
Can get some with not high wind speeds
No air mass boundaries or fronts
Thermal low pressure due to abudance of latent heat at the surface
Heat movement is mostly vertical
Heat is mostly going up.
Circular, cyclonic storms with wind speeds in excess of 74MPH
Form and develop in tropical oceans
Only place they can get the low friction and necessary heat to power that storm.
Steered by pressure and wind systems around a Subtropical High.
No fronts
Thermal low pressure
When we look at the cross section we can look at the inward motion except the eye.
The speed of the eye makes an outware force that balances the pressure gradient force.
The wind dies down in the eye.
From satelite: Clockwise movement and the outflow is high pressure aloft
High pressure doesn’t show too often though.
Requirements for tropical cyclone development
Warm ocean surface of about 80°F (27°C) or higher
Deep layer of moist air — provides instability and energy for convection.
Trough of low pressure — usually an Easterly Wave
Lack of vertical wind shear (favored in La niña years)
el nino years is mainly vertical win sheers
Sufficient distance from equator for Coriolis: >5° latitude (no cyclonic rotation possible if closer to equator than 5°).
If anything is missing from this list won’t have a tropical cyclone.
Easterly Waves
Trough of low pressure in the trade wind zone
Movement is from east to west
Wind-flow through the wave is cyclonic
Tropical Cyclone Hierarchy
Tropical Depression (>20 knots)
Tropical Story (>35 knots)
Named assigned
Alphabetical order of alternating female and male names
Hurricane (>65 knots or 74 MPH)
Other names
Cyclones in South Asia
Typhoons in East Asia
Storm surge
High water is driven by low pressure and wind.
Wind effect is magnified by the forward motion of the storm on the right-front quarter.
Water weighs 1700lbs/cubic yard.
Week 11 [Final starts here]
11/03/2025
Thunderstorms
Ingredients:
Warm Humid Air — fuel for the sotrm
Instability — warm, buoyant air, rises without forcing
A lifting mechanism:
Convection: always
Orographic lifting: in mtns; gets air to LFC
Frontal lifting: in midlatitudes along cold fronts
Stability and Thunderstorms
Stability of an air mass depends on its environmental lapse rate.
When a parcel of lifted air is warmer than the surrounding air (which we difine as the environmental lapse rate), atmosphere conditions are unstable.
Increasing instability by warming near the surface
Solar radiation during the day warms the lower layer of air and causes the environmental lapse rate to become steeper (meaning a faster rate of cooling).
Lightning
When ice and hail particles collide within a cloud, ice crystals are stripped of their electrons and become positively charged. The heavier ice particles with extra electrons move toward the base of the cloud, so now the cloud has positive charge at top and negative at base.
Meanwhile, the negative charges at the cloud base cause a collection of positive charges on the ground.
The first part is called a negatively-charged stepped leader that descends from the cloud, attraced by the positive charges on the ground.
When the electrical potential becomes great enough, the leader connects with an upward positive streamer. This establishes the path and a massive discharge results in lightning stroke.
Thunder
When lightning occurs — there can be a release of over 1,000,000 volts of electricity.
This release of energy immediately heats the surrounding air to upwards of 25,000°C (45,000°F)
This rapidly and instantaneously and explosively expands the air — creating the sonic shock we know as thunder.
Outflow and Squall lines
The downdraft from rain falling from a thunderstorm creates a mini-cold front out in advance of the approaching storm. You first see it as a shelf cloud, and then you feel the gust of cool air. Air this point, you usually have several minutes to get under cover
Mesoscale Convective System
Roughly oval or circular systems.
Downdrafts from a storm hit surface, flowing outward as an outflow boundary. When these encounter other outflow boundaries, new updrafts (and thus new storms flow).
Squall Lines
A line of strong-severe storms ahead of a cold front - usually at a distance of about 180, 300 miles ahead of the front.
Frontal lifting is key.
Strength of storms hinges on temperature gradient and moisture content.
Derechos
Widespread; long-lived; destruction similar to tornadoes
Typically from cluster of thunderstroms — creating cluster of organized outflow boundaries.
Results is logically high straight-line winds, spreading outward from the line of thunderstroms.
Tornadoes
Small, intense cyclonic storms with extremely low pressure, violent updrafts, and powerful converging winds most often associated with severe thunderstorms.
Only 1% of t-storms produce a tornado, but 80% of tornadoes are associated with t-storms and midlaitutde cyclones. Remaining 20% associated with landfalling tropical cyclones.
11/5/2025
Outline
Definitions
What is a classification? Why do we classify things?
Classification Schemes
Historial
Thornthwaite
Köppen
Major Climate Types
Some Definitions
Weather
Atmospheric conditions, at a given time, in a specific location.
Climate
Accumulated and averaged weather patterns of a locality or region; the full description is based on long-term statistics and includes extremes or deviations from the norm.
Climate classification system: a method for determining categories of climate types based on climatic and weather data and charachteristices.
Cimate region: a region defined by the similarity of cimatic conditions in the area within its boundaries.
Purpose of classification
A classification is:
any arrangement of something into “like” groups.
The procedure or acgtion of placing things into siimilar groups.
Why?
To create order
Easier to understand, to learn, and to teach
A good way to compare and contrast, see similarities and differences
Allows mapping, so that patterns are visible, and causes can be realized.
Ancient Greek Climate Classification
The original greek climate classification scheme was expanded and correlated with Earth’s five astronomical zones to depict a world comprising five climate zones.
Why do modern climate classifications use?
Temperature data
Precipitation data
Seasonal and annual statistics
Long-term records
Extreme Events
Many generalizations
Variations are likely to occur accross a climate region
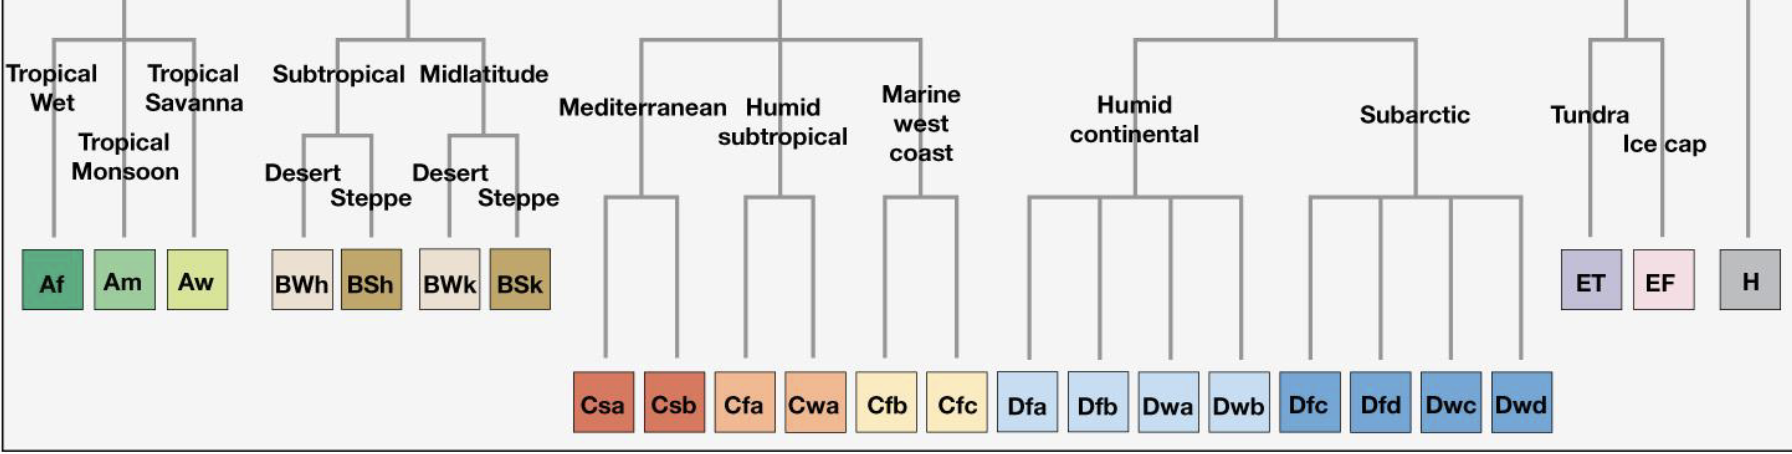
The Köppen System
Most widely used climate classification system.
Based on regional temperature and precipitation patterns.
Just temperature and precipitation
Advantages and limitations of the Köppen System
Advantages
Temperature and precipitation relatively easy to measure.
Measured most often and in more parts of the world.
Most important and effective weather elements.
Linked to vegetation (10°C/50°F isotherm)
Disadvantages
Considers only average monthly temperature and precipitation
Ignores wind, cloud cover, precipitation intensity, and daily temperature extremes.
Köppen System
Divided into six major climate zones
A = Humid Tropical
C = Humid Mesothermal (mild winter)
Middle temperature, not tropical, not cold either
D = Humid Microthermal (Severe winter)
E = Polar
B = Arid and semiarid
H = Highland
Köppen System
A: humid tropical (no cold winter: Tmin ≥ 18°C
Tmin = the average temperature of the coldest month
10°C = 64°F
C: humid mesothermal (mild winter: Tmin≥0°C)
0°C = 32°F
D: Humid microthermal (cold winter: Tmin<0°C)
E: Polar (no warm summer: Tmax < 10°C)
10°C = 50°F
Tmax = average temperature of the warmest month
Arid climates, B (annual P<PET)
Highland climates are H and can be found at high elevation all over the world.
Climate Subtypes
A, C, D have subtypes denoted with lowercase letters:
2nd: f = wet year round
m = monsoon
w = winter dry
s = summer dry
3rd:
a = hot summer
AF = hot summer forrest
Am = monsoon
b = warm summer
c = mild summer
CF = fredericksburg climate (mild winter with no real dry season)
d = cold winter
B climates have two main types: BS and BW
a third letter where h = hot and k = cold
E climates just have one second letter, where T = tundra (ET) and F = ice sheet (EF)
Learn for quiz
Main definitions of the things
Need to know what PET is
Lab
Weather forecaster
Quiz 9 Studying
1. What is the relative humidity at and above the LCL? (1 pt) 100%
2. With respect to stability, what happens above the LFC? (1 pt) Air parcel becomes warmer and less dense than the surrounding air.
3. Lifted air cools at what rate above the LCL? (1 pt) 5°C/1000m
4. The Köppen system is an empirical system, which means that it is
based on data. These data come from weather stations, and have
been collected for decades, if not centuries, around the world.
What two variables, collected by weather stations, are necessary
to classify a climate in this system? (2 pts) Temperature and precipitation
5. Give the descriptive names of these Köppen climate types: (3 pts)
A Humid Tropical
C Humid Mesothermal (mild winter)
D Humid Microthermal (servere winter)
6. What is the definition of an “arid” climate in the Köppen system?
(2 pts) Having annual precipitation (P) less than its potential evapotranspiration (PET)
7. If the tropospheric temperature goes from 23°C at 0 m to 5° at
3000 m, what is the value of the ELR? (1 pt extra credit)
-6°C/1000m
11/7/2025
Tropical (A) Climates
High temperature year round
Near equator
No winter season (average temperature of coldest month above 18°C; Tmin≥18°C)
Incluenced by ITCZ and its movement with the subsolar point.
The A climate types
Af: Tropical Rainforest
Within 5°- 10°C of equator
Rainfall ocurrs year round.
Aw: Dry “winter” tropical savanna
Seasonal rainfall with migration of ITCZ.
Rain in high-sun season; dry in low-sun season.
Am: Tropical monsoon
Wet/dry due to monsoon
Arid (B) Climates
Year round moisture deficiency
Precipitation received is less than potential ET (P < PET)
15° N/S to 30° N/S
Subtropical high
BS - steppe
BW - dessert
Mesothermal (C) Climates
Mild winter
Coldest month is above freezing (Tmin ≥ 0°C)
Snow is possible in some places, but usually melts off fast.
Three main types:
Dry summer (Csa, Csb) along west coast
California’s main climate
Moist, hot summer along east coast (Cfa)
All of east coast but southern florida where it is tropical
Moist, mild summer along northwest coast (Cfb)
Pacific northwest
Washington, Oregon, Northern California type shit
Csa and Csb: Mediterrian
Cfa: Humid subtropical
Cfb: Marine west coast
Microthermal (D) Climates
Severe winters with at least 1 month averaging below freezing (≤0°C)
Tmin ≤ 0°C
Df: wet all year
Dw: dry winter
Humind continental microthermal
Hot summer (Dfa, Dwa)
Ukraine is an example of a Dfa
Mild summer (Dfb, Dwb)
Subartic (Dfc, Dwc, Dfd, Dwd)
Polar (E) Climates
No month has an average temperature exceeding 50°F (10°C)
Tundra (ET)
Summer thaw (Tmax > 0°C)
Ice sheet
Below freezing all year (Tmax < 0°C)
Highland (H) Climates
Can change air mass movements
Create adrupt climate divides
Microclimates related to elevation, clouds, and exposure
Leeward side is drier.
Climographs
A standard climograph showing average monthly temperature (curve) and rainfall (bars)
Horizontal index lines are 0°C, 10°C, 18°C, and 22°C. These are the Köppen temperature parameters by which climate data are classified.
Scales must always be the same so that every climograph can be compared to every other climograph.
Week 12
11/12/2025 Lab
Week 13
11/17/2025
Quiz 9 Studying
Quiz 9
Fall 2024
1. What is the relative humidity at and above the LCL? (1 pt)
2. With respect to stability, what happens above the LFC? (1 pt)
3. Lifted air cools at what rate above the LCL? (1 pt)
4. The Köppen system is an empirical system, which means that it is
based on data. These data come from weather stations, and have
been collected for decades, if not centuries, around the world.
What two variables, collected by weather stations, are necessary
to classify a climate in this system? (2 pts)
5. Give the descriptive names of these Köppen climate types: (3 pts)
A
C
D
6. What is the definition of an “arid” climate in the Köppen system?
(2 pts)
7. If the tropospheric temperature goes from 23°C at 0 m to 5° at
3000 m, what is the value of the ELR? (1 pt extra credit)
Random
Csa + Csb
Mesothermal climate + a dry summer
Cfa
Mesothermal Hot summer
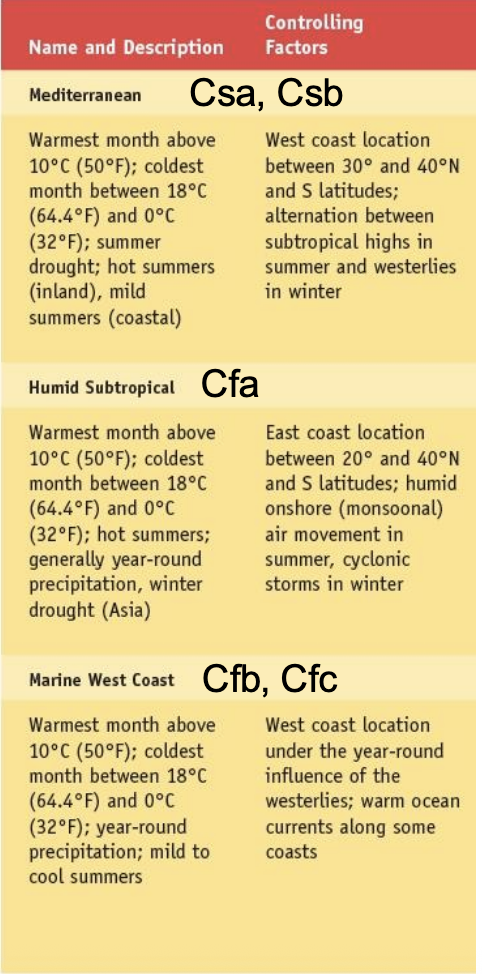
All C Climates Experience Seasonality of Temperature
Mild but cool winter (the average temperature of the coldest month is still at or above freezing)
Tmin ≥ 0°C
Distinct, long summer (the warmest month’s average Temperature is above 50°F
Tmax > 10°C (50°F)
Cwa/Cwb: The missing climate from textbook
Cw climates have a cool, dry winter and a hot or mild summer.
Cw is a cooler version of Aw
Cooler = Latitude (Asia)
Cooler = Altitude (Africa)
They are found mostly in Asia and in Africa
In Asia, they are associated with the monsoon system, being wet in the summer dry in the winter and too cool to be an Aw or Am.
In Africa, they are found where you’d normally look for an Aw climate, but in these places the higher altitudes make the temperatures just a bit too cool to be an A climate
Humid Mesothermal Climates: The C Climates
Mediterranean - Csa, Csb
Mild winter (C), dry summer (s), hot (a) or mild summer (b)
Humid subtropical - Cfa
Mild winter, no dry season, hot summer
Marine west coast - Cfb, Cfc
Mild winter, no dry season, mild or cool summer
Mediterranean Climate (Csa and Csb)
Associated with subtropical west coasts.
Warm, dry summer (STH and cool ocean surface)
Moist winters (polar front cyclones)
Fog along coast (advection fog)
Frost possible, but mild winter
Inland (Csa) has hot summer
Coastal (Csb) has miled summer (marine influence)
Dry Summers: Influence of the Subtropical High
In the summer, the polar front jet is off to the north (its poleward-summer position), and the subtropical high keeps conditions along the west coast sunny and dry
Summer-dry:
Weak polar front jet/no midlatitude cyclones
Strong subtropical high pressure
Wet winters: Influence of the Polar-Front Cyclones
In the winter, the polar front jet further south (its equator-ward-winter position), and so is the subtropical high.
The STH is weaker and is not blocked midlatitude cylones.
Winter-wet:
Strong polar front jet/lots of midlatitude cyclones
Weak STH influence
Mediterranian Vegetation: Adapted to Dry Summers
Long frost-free period
Adapted to summer drought: lack of water during growing season
Sclerophyllous (Thick evergreen leaves)
Fire adapted - plants grow back from reoots or have thick bark to protct the plant.
Chaparral is the name for the scrub woodland in the Mediterranean (Cs) climates.
Humid Subtropical Climates - Cfa
Subtropical east coasts and inland locations between 20° and 40°N and S
Wet year-round
Summer - convection
Winter - cyclonic storms on polar front
Annual Temperature ranges are moderate (low midlatitude location)
Mild winter
Hot summer
Cfa summer pattern: Convectional Precipitation
Humid subtropical
Influx of humid, unstable maritime tropical air during the summer fuels convective thunder-storms accross the Southeastern U.S. during the summer months.
Cfa winter pattern: Midlatitude Cyclone Precipitation
Midlatitude cyclones provide the lifting mechanism for winter precipitation.
Moisture still comes from maritime tropical air off of warm oceans.
Cfa — A productive Climate
Abundant Rainfall
Convection in the summer
Front in the winter
High temperatures
Long growing season
Soils have limited fertility (rapid decomposition and leaching of nutrients due to high precipitation)
Same principle, just less extreme than the tropical rainforest. Not as much leaching.
Cfa — Temperature Forest Biome
Deciduous and evergreen
Mixed broudleaf and needle-leaf
Adapted to cool winters and frequent dry conditions in summer
11/19/2025
Humid Mesothermal Climates: The C Climates
Marine West Coast — Cfb, Cfc
Mild winter, no dry season, mild or cold summer
All C Climates Experience Seasonality of Temperature
Mild but cool winter
Tmin ≥ 0°C
Distinct, long summer
Tmax > 10°C (50°F)
Marine West Coast (Cfb and Cfc)
Associated with middle to high latitude west coasts.
Mild, moist summers (cool ocean surface and polar front cyclones)
Moist winters (polar front cyclones)
Freezing and snow possible, but mild winter
Marine West Coast Ocean Influence
Abundant source of moisture (in the westerlies on west coasts)
Maritime (This causes small diurnal and annual temperature ranges.)
Frost and snow occur fairly regularily in winter due to high latitude, winter is mild
Locations at the same latitude with a continental climate are much colder in winter.
Slight dryness in summers: Influence of the subtropical high
If there is a dry season, it will be in the summer
Weak polar front jet and cyclones
Strong subtropical high pressure
Higher latitudes experience less dryness in summer due to cooler temperatures.
Wet Winters: Influence of the Polar Front Cylclones
In the winter, the polar front jet is further south (at its equatorward-winter position), and so is the subtropical high. The STH is weaker and is not blocking midlatitude cyclones.
Winter-wet because of:
Weak STH influence
Strong polar front jet/lots of midlatitude cyclones
More Marine West Coast Characeristics
Lots of clouds and precipitation
Cloudy Climate
Cyclonic storm
Especially in winter
Local Topograghy can enchance precipitation
Fjords
Humid Microthermal climate regions — the D climates
For all D climates:
Warmest month is above 10°C (50°F): Tmax>10°C
Coldest month is below freezing: Tmin < 0°C
Large annual T range
D climates have warm or hot summers and cold, snowy winters
Comparison of C and D climates
Summer
C: Tmax > 10°C
D: Tmax > 10°C2
Winter
C: Tmin ≥ 0°C (mild)
D: Tmin < 0°C (Cold)
Both climates have warm summers. The difference is the winter.
D Climates: The microthermal climates
Located between 35° and 75°N
None in the southern hemisphere
Westerlies, Polar Front, Polar High Pressure
Only in contenintal locations
Extreme seasonality in temperatures
Three microthermal climate types:
Humid Continental, hot summer (Dfa, Dwa)
Humid continental, mild summer (Dfb, Dwb)
Subartic (Dfc, Dfd, Dwc, Dwd)
Cool summer and, in extreme cases, a long, bitterly cold winter (-d)
Dfa/Dwa — Humid continental, hot summer
Warmest month above 10°C (50°F). Coldest month below freezing (large T range)
Hot summers and cold, snowy winters
Precipitation all year except in Asia
Convection in summer, midlatitude cyclones in winter
Seasons and Agriculture in the Dfa Climate
Most productive of the microthermal climates
Agricultural potential
Mid atlantic and midwest in U.S.
Length of growing season is the limiting factor on productivity
Trees are deciduous because of dry, cold winter
Grasslands on drier margin of climate zone
Seasonal Changes
Winter
Cold and snowy
Prolonged invasion of cold, dry air interrupted occasionally by thaws
Spring
Warmer with frequent showers and threat for frost
Summer
Hot and humid with occasional thunderstroms
Fall
Clear anf rainy, mild days and frosty nights
Dfb/Dwb climate — humid continental, mild summer
Close similarity to humid continental, hot summer
More continental with severe-winters
Poleward of humid continental, hot summer
Distinct seasonality
Variable weather
Comparing Dfa with Dfb (or Dwa with Dwb)
Less precipitation in this climate
colder and further from moisture sources
Shower summer
Less convection
Colder winters
Short days and low sun angles, high continentality
Greater snow accumulations
11/21/2025
Quiz 11 Studying
Why is the tropical savanna climate (Aw) wet in summer (the high-sun season)? Aw is wet in summer because ITCZ migrates poleward bringing seasonal rainfall.
Why is the Mediterranean climate (Cs) dry in the summer? Cs is dry in the summer because of strong STH pressure system.
What is the lifting mechanism for rain in a Cfa climate in the summer? ... in the winter? Cfa climate, summer rain is primarily from convection, winter is midlatitude cyclones.
What biome contains exclusively plants with xerophytic characteristics? Dessert biome
What biome would probably have the lowest proportion of plants with xerophytic adaptations? Tropical Rainforest biome
What climate type is transitional from a humid climate to a true dessert climate? Steppe (BS) climate type
Identify two reasons for aridity in the Western Sahara Desert. STH and Cold Ocean Currents
What causes aridity in both Patagonia and the Great Basin (U.S.)? Rain Shadow Effects
Quiz 11 Studying
Based on the definition of C climates, what are the temperature criteria for their mild winters and long summers?
Mild Winter: The average temperature of the coldest month is at or above 0∘C0∘C (Tmin≥0∘CTmin≥0∘C).
Long Summer: The warmest month's average temperature is above 10∘C10∘C (Tmax>10∘CTmax>10∘C).
What two primary factors contribute to the Mediterranean climate (Cs) having warm, dry summers?
Strong subtropical high (STH) pressure systems and cool ocean surface temperatures.
Explain why Mediterranean climate (Cs) regions experience wet winters.
During winter, the polar front jet shifts southward, and subtropical high influence weakens, allowing midlatitude cyclones to bring moisture.
What type of vegetation is characteristic of Mediterranean (Cs) climates, and what are its key adaptations?
Chaparral (scrub woodland) is characteristic. Plants are sclerophyllous (thick evergreen leaves) and fire-adapted, growing back from roots or having thick bark.
For Cfa (Humid Subtropical) climates, identify the primary lifting mechanism for precipitation in the summer and in the winter.
Summer: Convection (convectional thunderstorms).
Winter: Midlatitude cyclones (cyclonic storms on the polar front).
Why are D climates (Humid Microthermal) found exclusively in the Northern Hemisphere?
They are only found in continental locations, and the Southern Hemisphere lacks sufficiently large continental landmasses at the necessary middle to high latitudes to develop these extreme continental temperature patterns.
W1hat is the defining temperature difference distinguishing C (Mesothermal) climates from D (Microthermal) climates, particularly concerning their winters?
In C climates, the average temperature of the coldest month is at or above freezing (Tmin≥0∘CTmin≥0∘C), indicating a mild winter. In D climates, the average temperature of the coldest month is below freezing (Tmin<0∘CTmin<0∘C), indicating a cold winter.
In Dfa/Dwa (Humid Continental, hot summer) climates, what is generally considered the limiting factor for agricultural productivity?
The length of the growing season.
Describe how Cwa/Cwb climates primarily differ from Aw climates in terms of temperature, and where these Cw climates are typically found?
Cwa/Cwb climates are a cooler version of Aw climates, too cool to be classified as A climates. They are typically found in Asia (associated with monsoon systems) and Africa (at higher altitudes).
What is the primary characteristic of the Marine West Coast (Cfb, Cfc) climate regarding its annual temperature range, and what causes this?
It has small diurnal and annual temperature ranges. This is due to the moderating influence of the ocean, providing a maritime climate.
Identify the biome associated with Cfa (Humid Subtropical) climates and describe its typical tree characteristics.
The biome is the Temperature Forest Biome. It typically features mixed broadleaf and needle-leaf trees, including deciduous and evergreen species, adapted to cool winters and frequent dry conditions in summer.
11/21/2025
Subartic Climate: Dfc, Dwc, Dfd, Dwd
Found on the northern hemisphere
Farthest poleward and most extreme of microthermal climates
Short, cool summer - But at least 1 month with an average temperature above 10°C
Poleward limit roughly coincides with the 10°C isotherm for the warmest month of the year
Limited precipitation amounts (less than 50cm or 20 inches)
Occasional passage of cyclones
POlar high pressure and cold air limit precipitatioo
Subartic Climographs Indicate Effects of High Laititude and Continentality
Severe winters
Seasonal Extremes
Largest annual temperature range on earth
Subartic: A limiting environment
Plants and animals: Low NPP (Net primary Productivity)
Very short gorwing season (50-75 days)
Taiga (boreal forest)
Cone-shaped confers are good at shedding snow
Lots of xerophytic characteristics because of physiological drought
Permafrost: permanently frozen ground
Permafrost varies greately in thickness and is often discontinuous
Freeze/thaw cycle
Patterned ground (frost poloygraphs)
Little to no agriculture
Building permafrost
Heat from buildings moves through the foundationand melts the underlying permafrost.
This causes buildings to differently settle.
Building on permafrost
Modern buildings are elevated, and/or have refrigerated supports, to prevent the permafrost from melting
Polar climate regions - E climates
Two climate types:
ET (Tundra)
EF (Ice Sheet)
Polar (E) Climates CHaracteristics
No month averages above 10°C
No warm summer
No trees
Day/Night Pattern
Extreme annual changes in daylight period
Large annual net loss of radiation
Tundra (ET) Climate Characteristics
Extremely short, cool “summer” with regular frosts
Average temperatrure of 4°C to 10°C
Winter temperatures not as severe as subartic
Maritime location
Muskeg
Ice Cap (EF) Climate
Tmax < 0°C
No months averaging above freezing
Extremely low precipitation due to cold air and dominating high pressure3
Testing climate types
A/L: Polar
B/D/J/V/P/S: Humid/Subtropical?
U/F/G: Subtropical Rainforest?
W/R/Q/E/K: Desset
Z/M/N: Subartic
A: Polar
B
C:
D
E
F
G
H
I
J
K
L
M
N
O
P
Q
R
S
T
U
V
W
X
Y
Z
Week 15
12/01/2025