Public Health Midterms
Part 1: Pharmacoepidemiology Notes
PHARMACOEPIDEMIOLOGY
under Pharmacology
subparts:
Clinical Practice
Epidemiology
study of the use and effect of medicine in large number of people
it can be defined as the study of the therapeutic effect(s), risk and use of drugs, usually in large populations, using epidemiological methods and/or reasoning
study of the relationships between diseases or any other biological phenomenon and various factors which can influence their frequency, distribution and evolution
PHARMACOEPIDEMIOLOGY: BRIDGING BETWEEN PHARMACOLOGY & EPIDEMIOLOGY
Application of the principles of epidemiology to drug effect and drug use
Better assessment of risk/benefit balance for the use of any particular drug in any particular patient
CLINICAL PHARMACOLOGY vs PHARMACOEPIDEMIOLOGY
Clinical Pharmacology
Drug effect in individual patient
drug usage pattern and appropriateness of drug use in groups
Pharmacoepidemiology
relation between drug exposure and health outcomes in defined population
ADVERSE EFFECT
a noxious and unintended response to a medicine that occurs at normal therapeutic doses used in humans for prophylaxis, diagnosis, or therapy of disease, or for the modification of physiological functions.
the word "effect" is used interchangeably with "reaction"
Types of ADVERSE EFFECT:
Px injury caused by a medicine taken in therapeutic doses:
A - Augmented (Dose-related)
Exaggerated pharmacological response
pharmacodynamic (e.g., bronchospasm from beta blockers)
toxic (e.g. deafness from aminoglycoside overdose)
B - Bizarre (Non Dose Related)
Nonpharmacological, often allergic, response
medicine-induced diseases (e.g, antibiotic-associated colotis)
allergic reaction (e.g, penicillin anaphylaxis)
idiosyncratic reactions (e.g, aplastic anemia with chloramphenicol)
C - Chronic or Continuous (Dose Related and Time Related)
Osteoporosis with oral steriods
Paracetamol can cause hepatotoxicity
D - Delayed (Lag time)
Time-related
Teratogenic effects of Anticonvulsants or Lisinopril
E - Ending of Use (Withdrawal)
Withdrawal syndrome with benzodiazepines
F - Failure of efficacy (Unexpected/failure of therapy) (no response)
Resistance to antimicrobials
Decrease of clearance in dialysis
SIDE EFFECTS
any unintended effect of a pharmaceutical product occuring at normal therapeutic dose and is related to its pharmacological properties
such effects may be well-known and even expected and require little or no change in patient management
SERIOUS ADVERSE EFFECT
any untoward medical occurrence that occurs at any dose and results in death, requires hospital admission or prolonged hospital stay, results in persistent or significant disability or is oife threatening.
ex. Viagra — Sildenafil, originally made to cure hypertension now for erectile dysfunction
CAUSALITY
the probability that a particular medicine is responsible for an isolated effect of an ADR
SIGNAL
reported information on a possible causal relationship between and adverse event and medicine, the relationship being previously unknown or incompletely documented
usually more than one signal report is required to generate a signal, depending on the seriousness of the event and the quality of the information
Ex. Domperidone
DRUG RE-INTRODUCE
when drug have unique benefit and risk can be managed
Isotretinoin, Cancer drugs etc.
DRUG UTILIZATION REVIEW
Authorized, structural and continuuing program that review, analysis and interprets pattern of drug use against predetermined standards
DUR studies focuses on drugs:
To evaluate the appropriateness of the therapy using approved criteria
To develop program to intervene and correct deficiencies in drug use process
TYPES OF HYPOTHESIS
Most common:
Null - negative
no connection between the given variables;
there is no significant relationship
MOST OFTEN USED
ACCEPT OR REJECT.
significance level = 0.5
higher than 0.5 = the null hypothesis is rejected
Alternative
there is a connection between given variables
there is a significant relationship
Hypothesis Testing
Require the use of comparison group to determine whether there is a difference in variable of interest (risk factor, trait, characteristic, drug exposed, or clinical conditions)
Statistic methods are used to assess whether the observed difference could have occurred by chance alone
Conclusions about the relation b/w exposure to a drug and clinical event thus based in the ability to reject the null hypothesis, postulating that the 2 group are no difference with regard to either the drug exposure or the clinical event.
AIMS OF PHARMACOEPIDEMIOLOGY
Signal Generation:
Most commonly associated with ADR but also use to detect new applications
Example:
Minoxidil 1st indicated for hypertension, but case report (signal generation) soon identified it causes hirsutism in a number of patients, side effect was investigated and now it is marketed for purpose mainly stimulatiin of hari growth.
Risk Quantification:
ADR often require large sample size
Reasons to Perform Pharmacoepidemiology Studies:
A. Regulatory
Required
to obtain an earlier approval for marketing
as a response to a question by regulatory agency
to assist applications for approval for marketing elsewhere
B. Marketing
To assist penetration by documenting the safety of the drug
To increase name recognition
To assist in repositioning the drug
a. different outcomes (quality of life and economic)
b. different types of patients (elderly, young)
c. new indications
d. less restrictive labeling
To protect the drug from accusations about adverse effect
C. Legal
In anticipation of future product liability litigation
D. Clinical
HYPOTHESIS TESTING
A. Problem hypothesized on the basis of drug structure
B. Problem suspected on the basis of preclinical or premarketing human data
C. Problem suspected on the basis of spontaneous reports
D. Need to better quantitate the frequency of adverse reactions
HYPOTHESIS GENERATING - needs to depends on:
A. Whether it is a new chemical entity
B. The safety profile of the class
C. The relative safety of the drug within its class
D. The formulation
E. The disease to be treated, including
i. Duration
ii. Prevalence
iii. Severity
iv. Whether alternative therapies are available
APPLICATIONS OF PHARMACOEPIDEMIOLOGY
Estimation of risk of drug use
Use in patient counseling
Formulation of public health policy decision
Formulation of therapeutic guidelines and discovery of new indications
Facilitation of pharmaco-economic evaluation
POTENTIAL CONTRIBUTIONS OF PHARMACOEPIDEMIOLOGY
A. Information which supplements the information available from premarketing studies-better quantitation of the incidence of known adverse and beneficial effects
(a) Higher precision
(b) In patients not studied prior marketing (elderly, children, pregnant women)
(c) As modified by other drugs and other illnesses
(d) Relative to other drugs used for the same medication
B. New types of Information not available from premarketing studies
Discovery of previously undetected adverse and beneficial effects
a. Uncommon effects
b. Delayed effects
Patterns of Drug Utilization
The effects of drug overdoses
The economic implications of drug use
C. General contribution of pharmacoepidemiology
Reassurance about drug safety
Fulfillment of ethical and legal obligations
SCOPE OF PHARMACOEPIDEMIOLOGY IN DRUG REGULATION
Stage in Life Cycle | Examples of Possible Applications of Pharmacoepidemiology |
|---|---|
DRUG DISCOVERY | Identification of potential markets through study of disease distribution and medicines utilization. |
DRUG DEVELOPMENT | Estimation of potential market size, unmet medical needs, demonstration of efficacy and safety, demonstrating significant benefit. |
ORPHAN DRUGS | Estimation of prevalence of disease, providing information on other treatments, demonstration of efficacy and safety, demonstrating significant benefit. |
Pharmacoeconomics | Estimation of costs of therapy and benefits in economic terms to support reimbursement or inclusion in formularies. |
PHARMACOEPIDEMIOLOGY IN PRACTICE
The basic idea of pharmacoepidemiology is to measure the source, diffusion, use, and effects of drugs in a population and to determine the frequency and distribution of drug use outcomes in that population
Focus Questions:
What is being used?
An assessment of specific drugs being used in certain situations.
How it is being used?
An assessment of the patterns of use, including how much, where and when, and by whom
Why it is being used?
An assessment of the reasons for drug-taking behaviors and the functions that drugs serve in society).
WORLD HEALTH ORGANIZATION
Focuses its pharmacoepidemiologic efforts on ensuring the quality, safety, and efficacy of drugs and their use in specific populations
Studies are performed to:
Describe current patterns of drug use in specific patient populations
Determine changes in drug use over time
Measure the effects of information, education, promotional activities, media accounts, and price on drug use
Detect inappropriate drug use and associated problems
Estimate drug needs in terms of disease patterns and outbreaks
Plan the selection, supply, and distribution of drugs
RESEARCH METHODS USED BY PHARMACOEPIDEMIOLOGISTS
Cross-sectional study:
a prevalence survey of health and illness in the population at one point in time
Ex. Prevalence of cancer among defined population
Case-control study:
a retrospective analysis comparing subjects with the condition (cases) to those without it (controls) with respect to possible risk or causative factors
Ex. One researcher studies rare cancer or the Kaposi sarcoma
Cohort study:
an incidence study that follows a population free of health problems over time, examining subsequent development of problems and factors associated with them
Ex. Cohort study of Psoriasis and Depression, Cohort study of HIV
Clinical trials:
an experimental approach that tests the value of a new treatment or intervention compared with a standard treatment or a placebo, are also considered to be an epidemiological method
SOURCES OF DATA
Institutional record systems and databases
System wide databases
National databases
Field data
Experimental data
Source of Data | Examples |
|---|---|
Institutional record systems and databases |
|
System wide databases |
|
National databases |
|
Field data |
|
Experimental data |
|
PROBLEM SOLVING WITH PHARMACOEPIDEMIOLOGY
Medical drug use
Beneficial effects of drug therapy
Risks (e.g., adverse reactions, side effects) of drug therapy
Inappropriate prescribing behaviors
Patient noncompliance Irrational self-medication practices
Poor drug use outcomes
Cost-effectiveness of drug therapy
Nonmedical drug use
Social-recreational drug use and associated problems
Acute incidents of drug toxicities (e.g., overdoses)
Chemical dependencies
Outbreaks and sources of drug epidemics
HEALTH (REVIEW)
Health is a state of complete physical, mental and social well-being, and not merely the absence of disease or infirmity (World Health Organization, 1948)
FACTORS DETERMINING HEALTH
Clinical care is less important than many people think whereas socioeconomic factors and the physical environment are quite influential on health and well-being.
Genetic characteristics are also less significant than many people think.
Whether people are healthy or not, is determined by their circumstances and environment - the social, economic and environmental conditions which affect the health of the population.
PRIORITY RECOMMENDATIONS: THE GLOBAL COMMISSION
The World Health Organization's Commission on Social Determinants of Health final report (2008) contains three overarching recommendations:
Improve daily living conditions: the circumstances in which people are born, grow, live, work, and age
Tackle the inequitable distribution of power, money and resources: the structural drivers of those conditions of daily life globally, nationally, and locally
Measure and understand the problem and assess the impact of action: expand the knowledge base, develop a workforce that is trained in the social determinants of health, and raise public awareness about the social determinants of health
GLOBAL CHALLENGES AND HEALTH DYNAMICS
Globalization
Urbanization
Poverty
Socioeconomic inequality
Food insecurity
Environmental degradation
Demographic transition
GLOBALIZATION: TRADE, MIGRATION AND INDUSTRIALIZATION
Increases risks of global epidemics such as severe acute respiratory syndrome (SARs) and the spread of health hazards including contaminated foods and products
Rapid economic growth places pressure on the labor force, infrastructure and environment
URBANIZATION
Urbanization is the process of the population moving from rural areas to urban areas, which leads to many changes in economic, social and physical environments.
With rapid economic growth, urbanization can place strain on infrastructure resulting in poor living conditions and an inability to properly access social services like education and medical care.
ECONOMIC GROWTH, POVERTY AND GOVERNANCE
Economic growth is the most powerful instrument for reducing poverty and improving quality of life.
Health is traditionally viewed as an end product of the growth process. However, in the other direction, a healthy population is also a driver for economic growth
FOOD INSECURITY
Food security exists when all people at all times have physical, social and economic access to sufficient, safe and nutritious food to meet dietary needs and food preferences for an active and healthy life.
New shocks related to climate change, conflict, pests (such as locusts) and infectious diseases are hurting food production, disrupting supply chains and stressing people's ability to access nutritious and affordable food
ENVIRONMENTAL DEGRADATION
Conserving the earth's ecosystem on which human society depends is a precondition for economic and social development, including good health
Environmental factors - polluted air, built environment hazards, agricultural practices, occupational hazards, radlation, climate change, chemical exposures and inadequate water and sanitation - were associated with 12.6 million deaths (23% of deaths worldwide) in 2012.3
DEMOGRAPHIC TRANSITION
Demographic transition is the transition from high birth and death rates to lower birth and death rates as a country or region develops from an agricultural society to an industrialized economic system.
Other demographic processes undergoing change include women's fertility and increasingly older populations in the developed world
HEALTH INEQUALITY MONITORING
Health equity is considered as a normative, aspirational concept, like the 'right to health'.
It is measured through the measurement of health inequalities - observable differences between subgroups within a population.
Health inequalities can thus be measured and monitored and serve as an indirect means of evaluating health inequity.
Health inequality monitoring is undertaken to provide information for policies, programs and practices to reduce health inequity
EQUITY STRATIFIERS
Also called "dimensions of Inequality"
Health inequalities tend to stem from social inequalities
Equity stratifies typically reflect social conditions
There are several equity stratifies that are used to distinguish groups and individuals:
Socioeconomic status
Education
Place of residence (rural, urban etc.)
Race or ethnicity
Occupation
Gender
Religion
Part 2: Morbidity, Mortality, Prevalence (notes, formulas)
MORTALITY RATE
A mortality rate is the number of deaths due to a disease divided by the total population
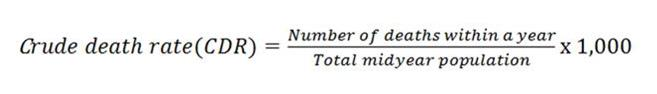
CRUDE DEATH RATE
Calculated as the number of deaths in a given period divided by the population exposed to risk of death in that period
Crude death rate (CDR) sometimes called force of mortality is defined as the rate with which mortality occurs in a given population:
Factors that affect CDR;
age and sex composition of the population
adverse environmental
occupational
the peace and order conditions
SPECIFIC MORTALITY RATES
Specific Mortality Rate = (Number of deaths in a specified group in a calendar year) / (Midyear population of the same sepcified group) × F
** F = 100, 1000, etc.
CAUSE-OF-DEATH RATE
Cause of Death Rate = (Number of deaths from specific cause / Midyear population) x F
** F = 100, 1000, etc.
INFANT MORTALITY RATIO
Infant Mortality Rate = (Number of deaths under 1 year old in a calendar year / Number of live births in the same year) x 100
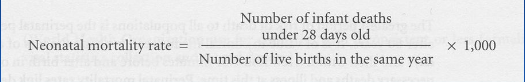
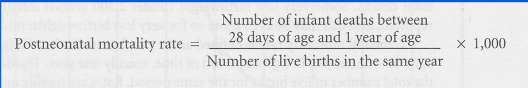
NEONATAL MORTALITY RATE (NMR) and POSTNEONATAL MORTALITY RATE (PNMR)
MATERNAL MORTALITY RATIO
Maternal death: "Death of a female from any cause related to or aggravated by pregnancy or its management (excluding accidental or incidental causes) during pregnancy and childbirth or within 42 days of termination of pregnancy, irrespective of the duration & the site of the pregnancy".
A measure of obstetric risk;
Affected by maternal health practices, diagnostic ascertainment, and completeness of registration of births.
Maternal Mortality Ratio = (Number of maternal deaths / Number of live births) x 100
CASE FATALITY RATE (CFR)
Proportion of cases that end up fatally
Gives the risk of dying among persons afflicted with a particular disease
Higher for hospital cases compared to cases from the community since the hospitalized cases are usually the more severe cases of the disease
Case Fatality Rate = (Number of deaths from a specified cause / Number of cases of the same disease) x 100
MORBIDITY RATE
the rate at which an illness or disease occurs withing a population
Formula:
Morbidity Rate = (Number of cases of a disease in a specific period / Total population during the same period)
Age/sex specific mortality rate | number of deaths in a year in a specific age/sex group mid-year population of age or sex group | x 1000 |
|---|---|---|
Birth rate | number of births in a year mid-year population | x 1000 |
Fertility rate | number of live births in year mid-year population of women aged 15-44 | x 1000 |
POINT AND PERIOD PREVALENCE
Point prevalence = [(Number of cases in a defined population at a specific point in time) / (Total population at that specific point in time)] x 1000
Period Prevalence = [(Number of new and preexisting cases during a specified time period) / (Total population at risk during the same time period)] x 1000
Example
There were 120 cases of typhoid fever in a small city (50000 population) at 1st Jan.2002. At the end of this year there were 30 added cases of that disease. At April of that year 60 cases (old and recently diagnosed). Calculate the point prevalence (at April, 2002) and period prevalence for the year 2002).
Solution:
Point Prevalence Rate= (60/50,000) x 1000
Point Prevalence Rate= 1.2 cases = round off = 1 cases
Point Prevalence Rate = 1 case of typhoid fever per 1000 population at Aprol 2002.
Period Prevalence Rate = [(120 + 30)/50,000] x 1000
Period Prevalence Rate = 3 cases of typhoid fever per 1000 population during 2002.