U0 Psych In-Class Notes
Correlation: expresses a relationship between two variables
No relationship
Random, unrelated points (flat line)
Correlation does NOT equal causation
As more ice cream is eaten more people are murdered. Does ice cream cause murder, or murder causes people to eat ice cream?
Positive Correlation
The variables go in the same direction. (Positive line)
Negative Correlation
The variables go in opposite directions (Negative line)
|___________________________________|_______________________________________|
-1 0 +1
Correlation Coefficient
A number that measures the strength of a relationship
Range is from -1 to +1
The relationship gets weaker the closer you get to zero
Greater the absolute value, the stronger the correlation coefficient
Illusory Correlation
The perception of a relationship where none exists
Example: more babies are born during a full moon
Experiment
Can explain cause and effect when properly conducted
Manipulate one or more factors in a controlled environment
Survey method
Most common type of study in psychology
Measures correlation
Cheap and fast
Need a good random sample
Low-response rates
Correlation does NOT = causation: Experiments show causation
Experimental Method
Shows that cause = effect
Laboratory vs Field Experiments
Theory: an explanation using an integrated set of principles that organizes and predicts observations.
Hypothesis: A testable prediction
If …, then … statements are helpful because they make sure you include the IV and DV
IV is what you change
What's being manipulated in the experiment
If there is a drug in the experiment, the drug is usually the IV
Brings about change
DV is the measured thing being changed by the independent variable
Would be the effect of the drug
Expresses a relationship between two variables
A variable is anything that can that can vary among participants in a study
Operational Definition (be careful to remember and do this)
Explain what you mean in your hypothesis
How will the variables be
How you operationalize the variables will tell us if the study is valid and reliable
Defining the variable
How the variables will be measured in “real life” terms
Description
Population: All the cases in a group from which samples may be drawn for a study
Sample: a fraction group from all of the population
Have to get a random sample to represent the bigger population
Identify the population you want to study
The sample must be representative of the population you want to study
Random Assignment
Once you have a random sample, randomly assig
Experimentation
Experimental Group
Condition of an experiment that exposes participants to the treatment, that is, to one version of the independent variable
Control group
Condition of an experiment that contrasts with the experimental treatment
Beware of confounding variables
The object of an experiment is to prove that A causes B
A confounding variable is anything that could cause a change in B that is not A
If I wanted to prove smoking causes heart issues confounding variables are
Lifestyle
Genetics
Experimenter Bias (Another confounding variable)
If I spend more time watching one group because I know which one is being tested I will have bias
Non conscious act
To avoid this don't tell the researcher or the participant: Double-blind Procedure
Hawthorne Effect
Even the control group may experience changes
Knowing can cause the experiment to change
Placebo effect
Just knowing there is a treatment can have a therapeutic effect
Order effect
How treatments are presented can change the outcome
Full metal jacket
The hotzone
Harvard Bias test
APA Ethical GUidelines for Research
IRB - Internal Review Board
Both for humans and animals
Animal Research:
Clear purpose
Treated in a humane way
Acquire animals legally
Least amount of suffering possible
Human Research:
No Coercion (must be voluntary)
Informed consent
Anonymity (needs written permission)
No significant risk
Must debrief
Deception Can be used if you debrief
Right to withdraw
Statistics:
Recording results from our studies
Must use a common language so we all know what we are talking about
Descriptive Statistics
Just describes sets of data
you might create a frequency distribution
Frequency polygons or histograms
Central Tendency
Mean
Median
Mode
Range
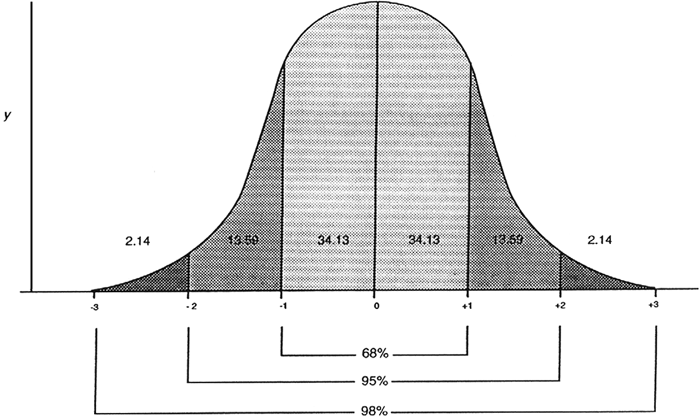
normal distribution
Memorize numbers ^^^^
One starting deviation from the mean is 68%^
standard deviation
Measures averages and difference between each score and the mean of the data set of a measure of how much scores vary around the mean
Higher the variance or SD the more spread out the distribution is
statistical significance
A statistical statement of how likely it is that an obtained result occurred by chance
Watch for extreme scores or outliers
Outliers skew distributions
If group has one high score, the curve has a positive skew (contains more low scores)
If a group has a low outlier, the curve has a negative skew (contains more high scores)
Z score WHAT IS Z SCORE
Inferential statistics
The purpose is to discover whether the finding can be applied to the larger population from which the sample was collected. (forming conclusions
P-value equal to or less than .05 for statistical significance
This means 5% likely the results are due to chance
Things to remember:
Random Sampling vs Random Assignment: Random sampling is about selecting a representative sample from a population, while random assignment is about placing those sample members into different groups within an experiment
Effect size vs correlation coefficient: Effect size and correlation coefficients are related measures that quantify the strength of relationships between variables, but they differ in their specific applications and interpretations. Effect size generally refers to the magnitude of an effect (e.g., a difference between groups), while a correlation coefficient, like Pearson's r, specifically measures the strength and direction of a linear relationship between two variables.
Correlation coefficient vs correlation: Correlation refers to the statistical relationship between two or more variables, indicating how much they change together. A correlation coefficient is a specific numerical value that quantifies the strength and direction of that relationship, typically represented by "r".