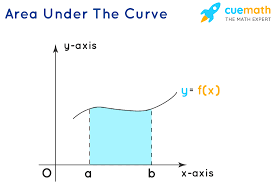
Area under curves
Areas
- You need to be able to estimate the area under a curve
- You can do this by drawing trapeziums in equal intervals undernearth the graph
Examiners report
The area under a velocity-time graphs tells you the distance travelled
Divide the area into four equal intervals and draw trapeziums
If you label your trapeziums it will make your working clearer
The formula for the area of a trapezium is
- Area = 1/2(a+b)h
- It’s easiest to think of the width of the trapezium as h and a and b as the height of the endpoints

Look at the shape of the curve
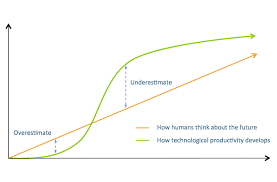
- Underestimate and Overestimate

Understanding the meaning of the area
- Showed how the units can be used to identify the meaning of the gradient: by dividing the vertical axis units by the horizontal axis units.
- The meaning of the area under a graph can be found by multiplying the units.
- For example,
- m/s x s = metres/second x seconds/1 = metres
So the area represents distance in metres.