1.1 Introduction to Maps Notes
TYPES OF MAPS
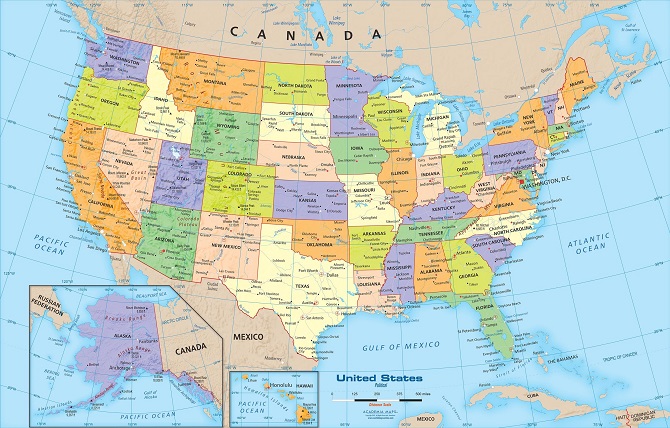
Reference Maps are informational and show boundaries and place names. Examples of this include:
- World Map
- Map of a City
- Evacuation Map
These maps can also display man-made features.
Thematic Maps show the density and distribution of quantitative data (quantitative refers to numerical data; anything that can be collected with numbers). Some thematic maps include:
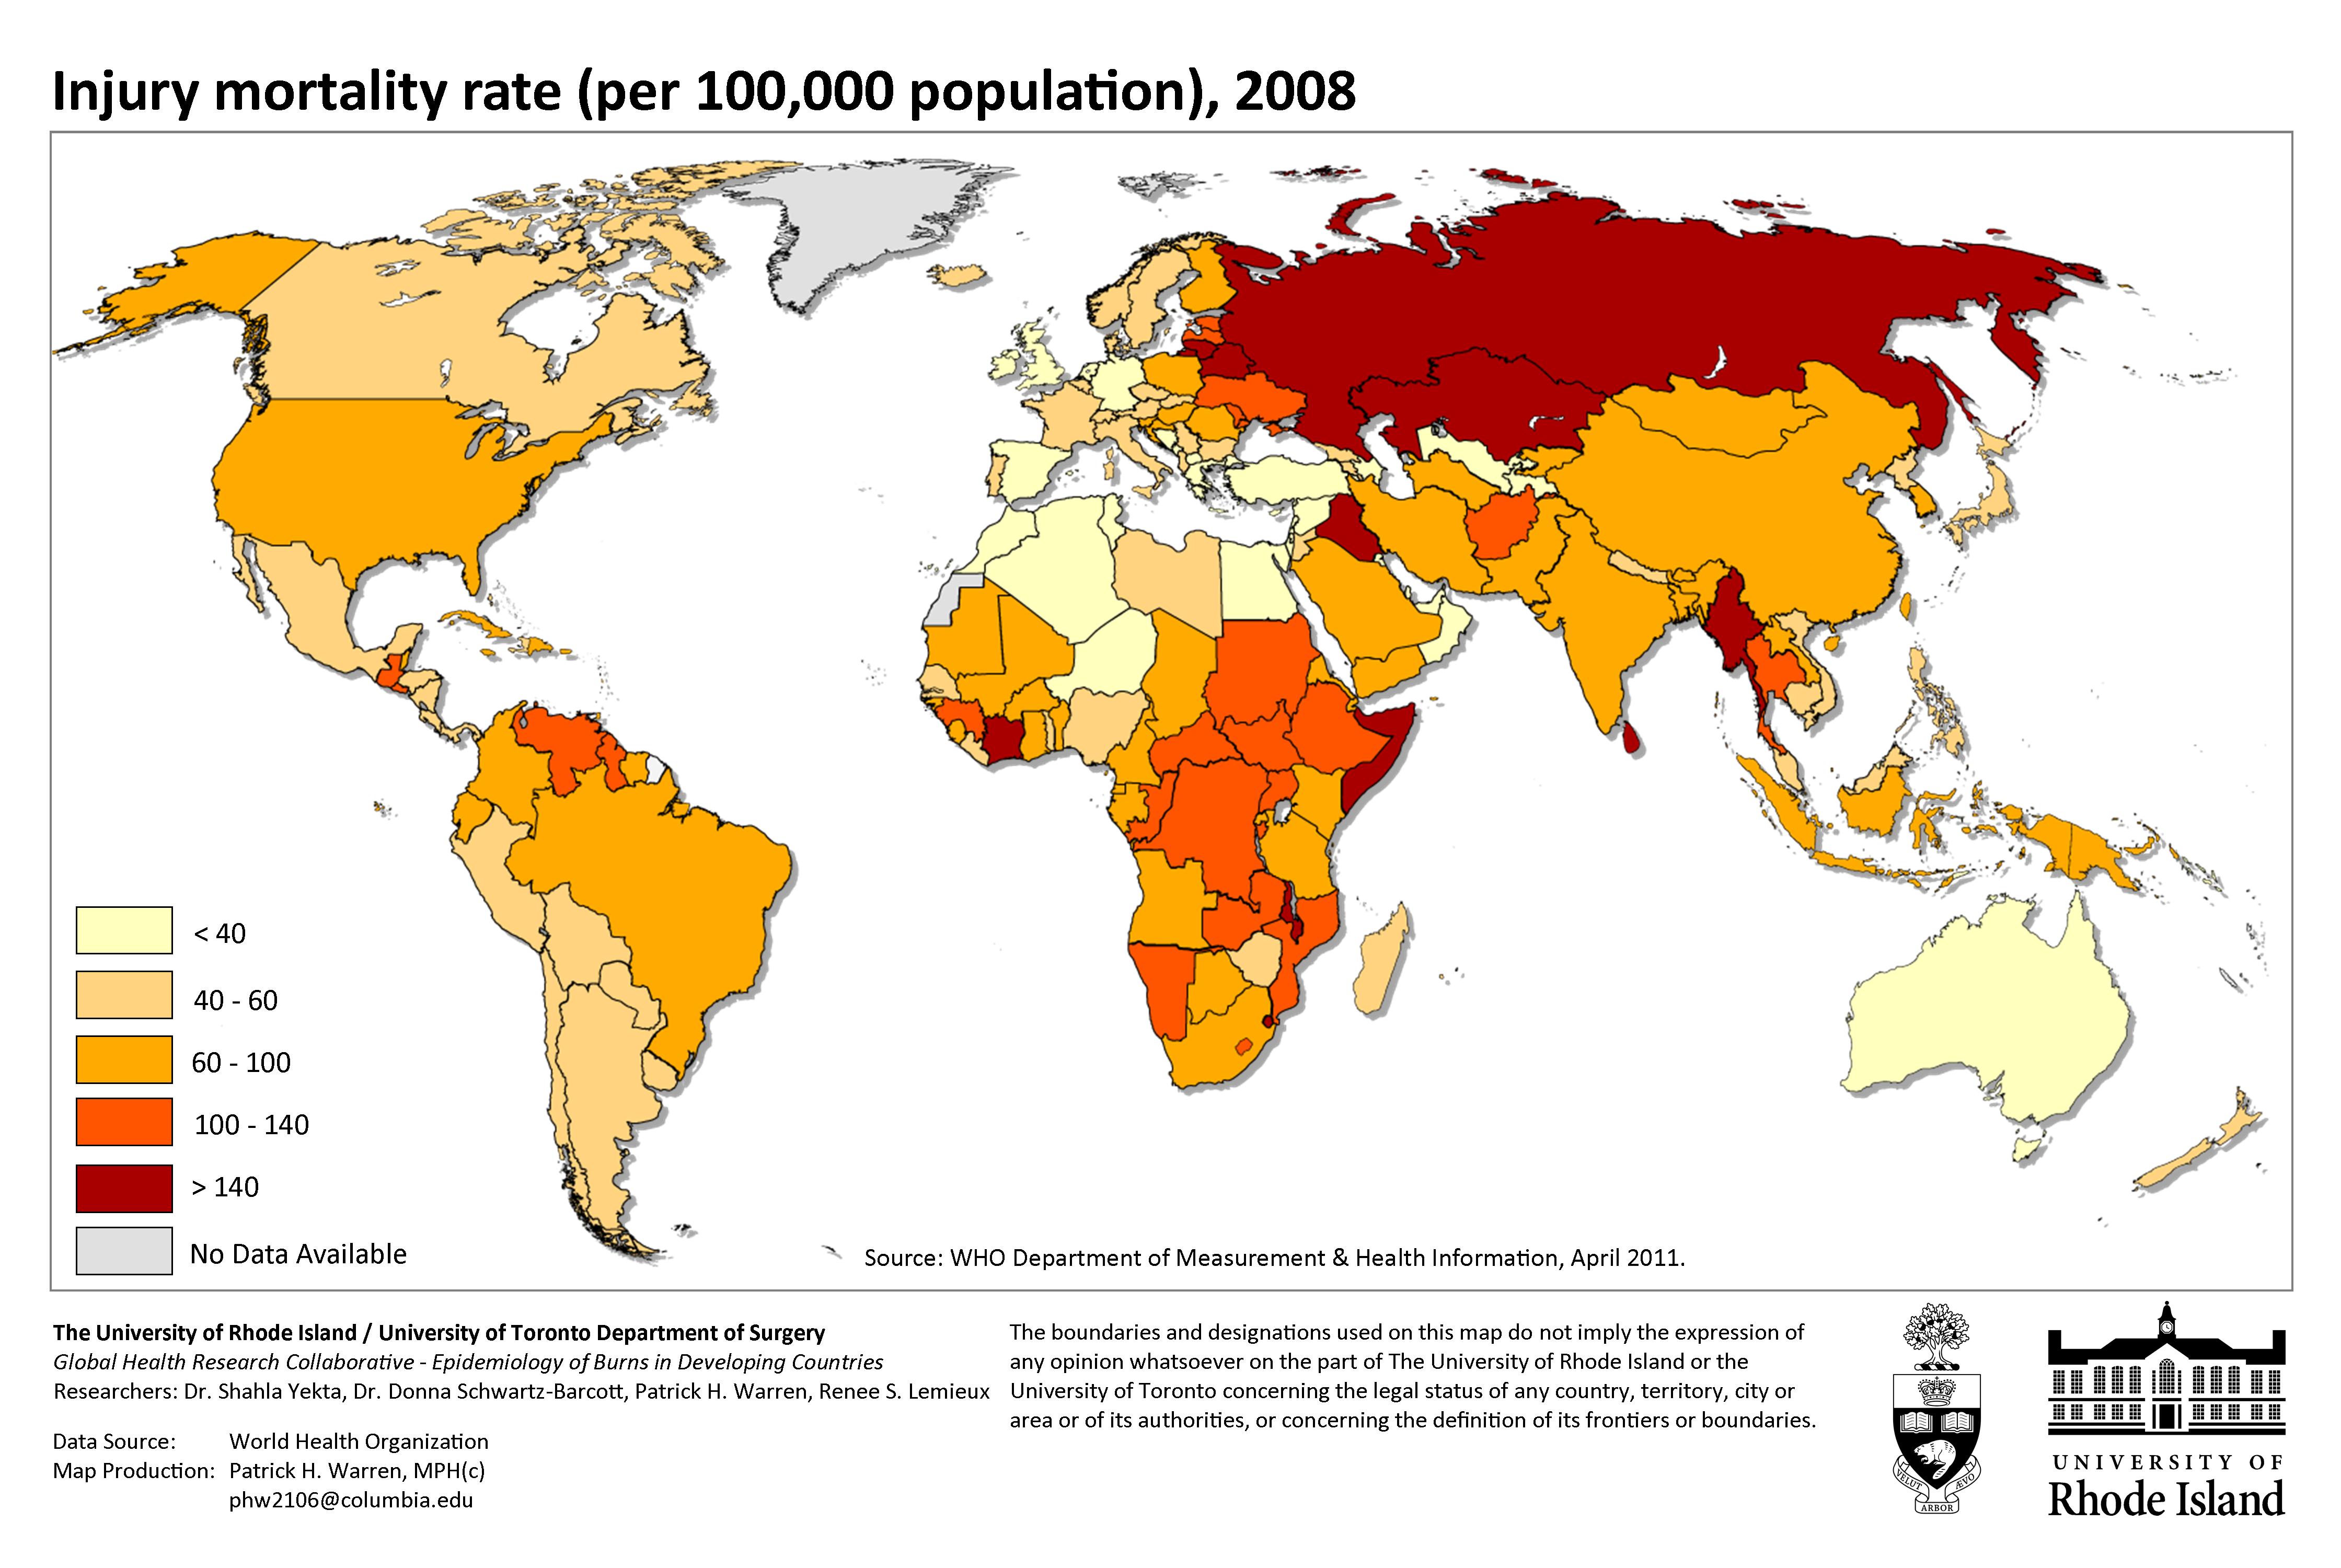
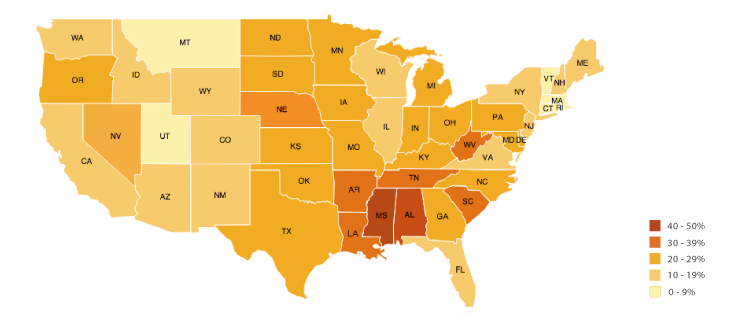
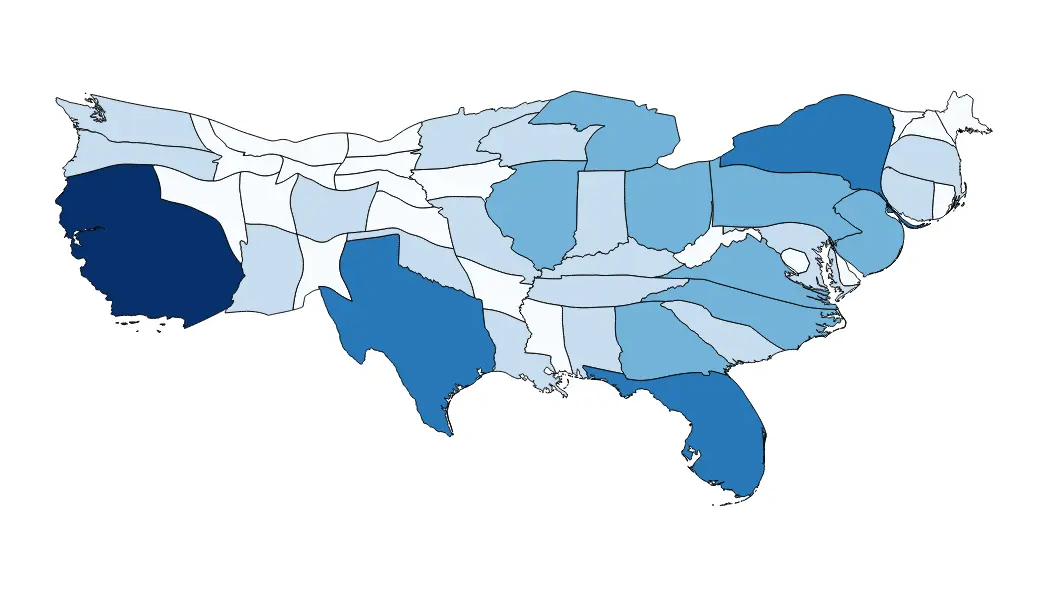
Choropleth Maps- Include colors or shading to represent quantitative data. Usually darker colors mean more. This type of map shows density but does not show distribution.
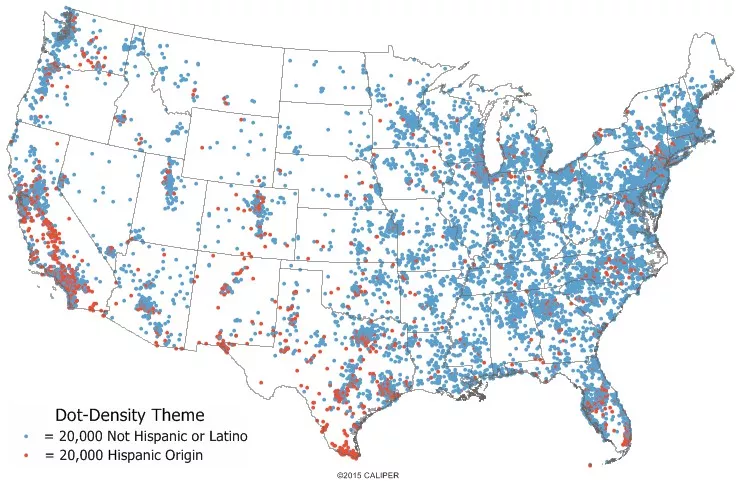
- Dot (Distribution) Maps- Maps that have dots placed to represent a value in its approximate location. These maps show distribution but do not show density.
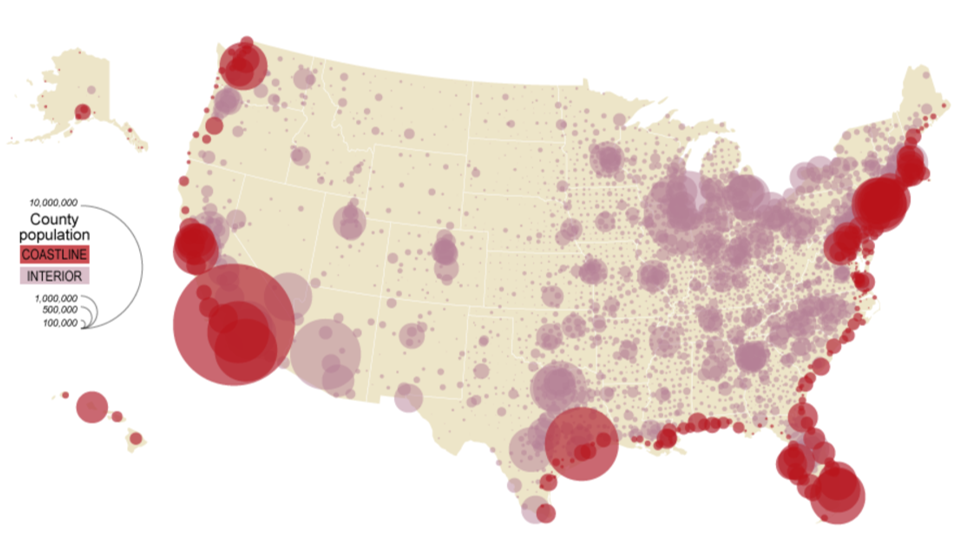
- Graduated Symbol Maps- These maps feature symbols proportional in size to the actual value of the data. These maps do not show density
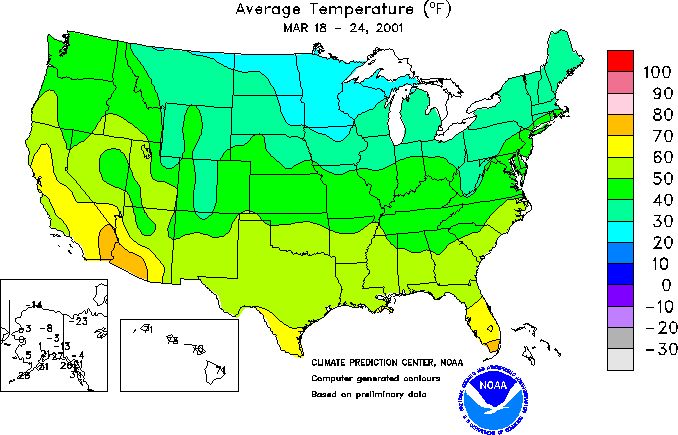
- Isoline Maps- Maps that connect areas of equal value with lines. These maps are not good for interpretation.
- Cartograms- Maps that distort the appearance of places on a map to represent their value.
ABSOLUTE AND RELATIVE DISTANCE
Absolute distance is a quantitative measure (numerical). For example, the location of Boca Raton, Florida being 26.3683 degrees North and 80.1284 degrees West.
Relative distance is a qualitative measure (not numerical). For example, the statement “my house is near the beach” would be relative because it is not a precise location.
PATTERNS
- Clustered- (grouped, nucleated, clumped, concentrated)
- Dispersed- (distributed, scattered, spread out)
- Uniform- (Evenly spaced)
- Random- (No discernable pattern)
MAP PROJETION
Map projection takes the spherical shape of the Earth and displays it on a flat surface. The map projection distorts the Earth’s spherical shape. Some examples of projections are:
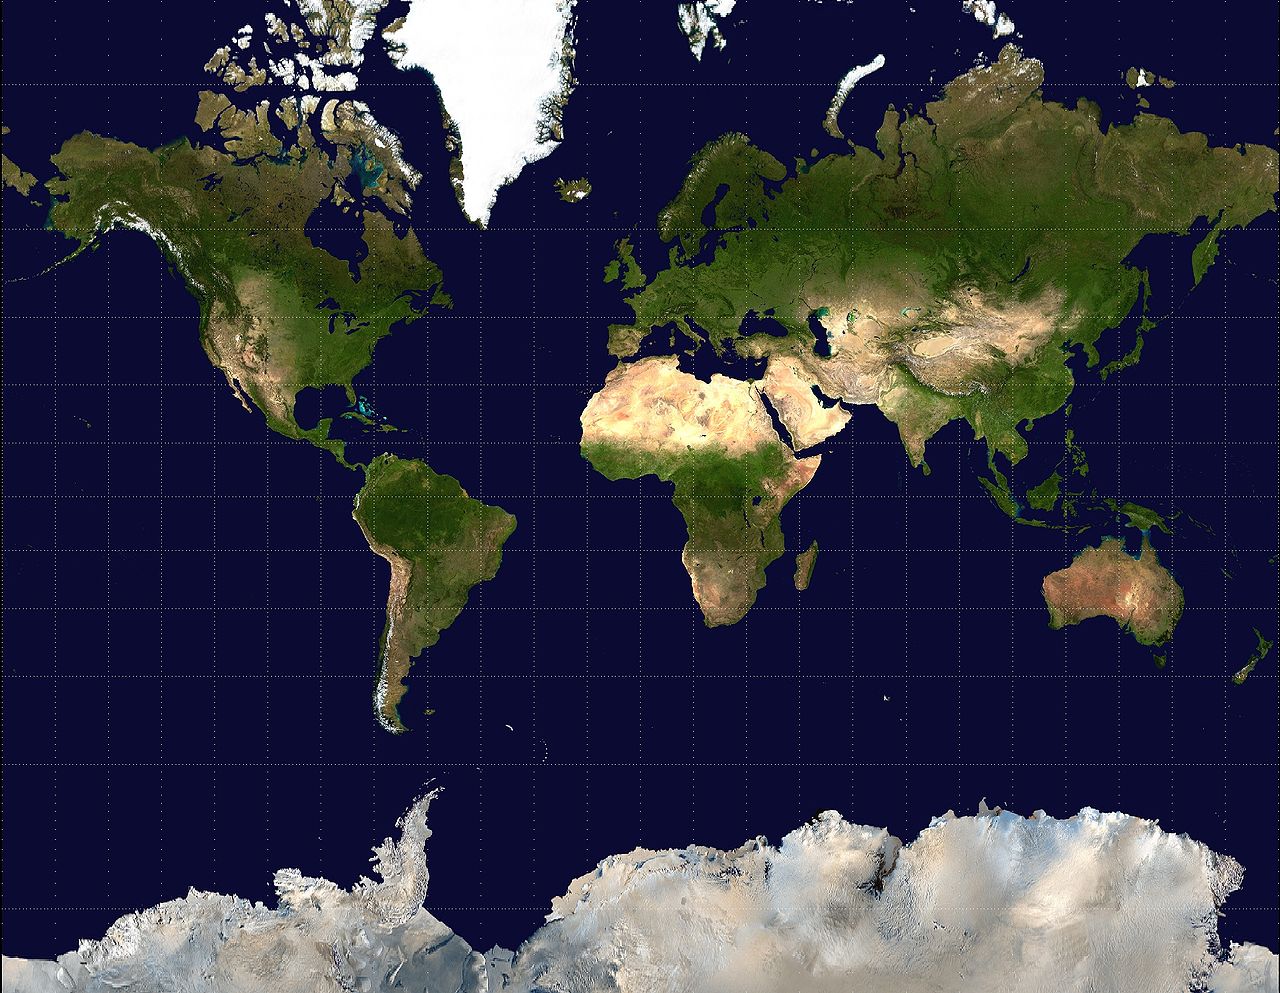
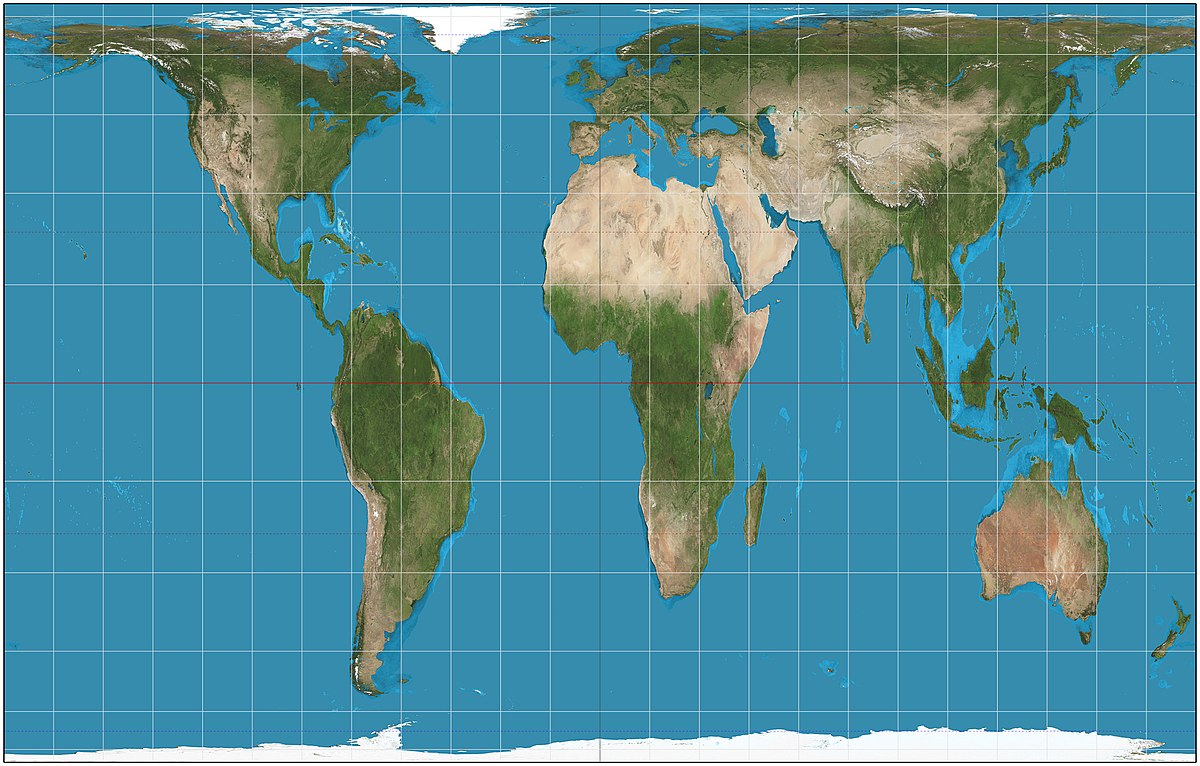
- Mercator Projection- Latitude and longitude shown at light angles, preserves shape but distorts size massively at higher latitude, commonly used for navigation.
- Gall Peters Projection- Preserves size but distorts shape, image appears opposite of Mercator
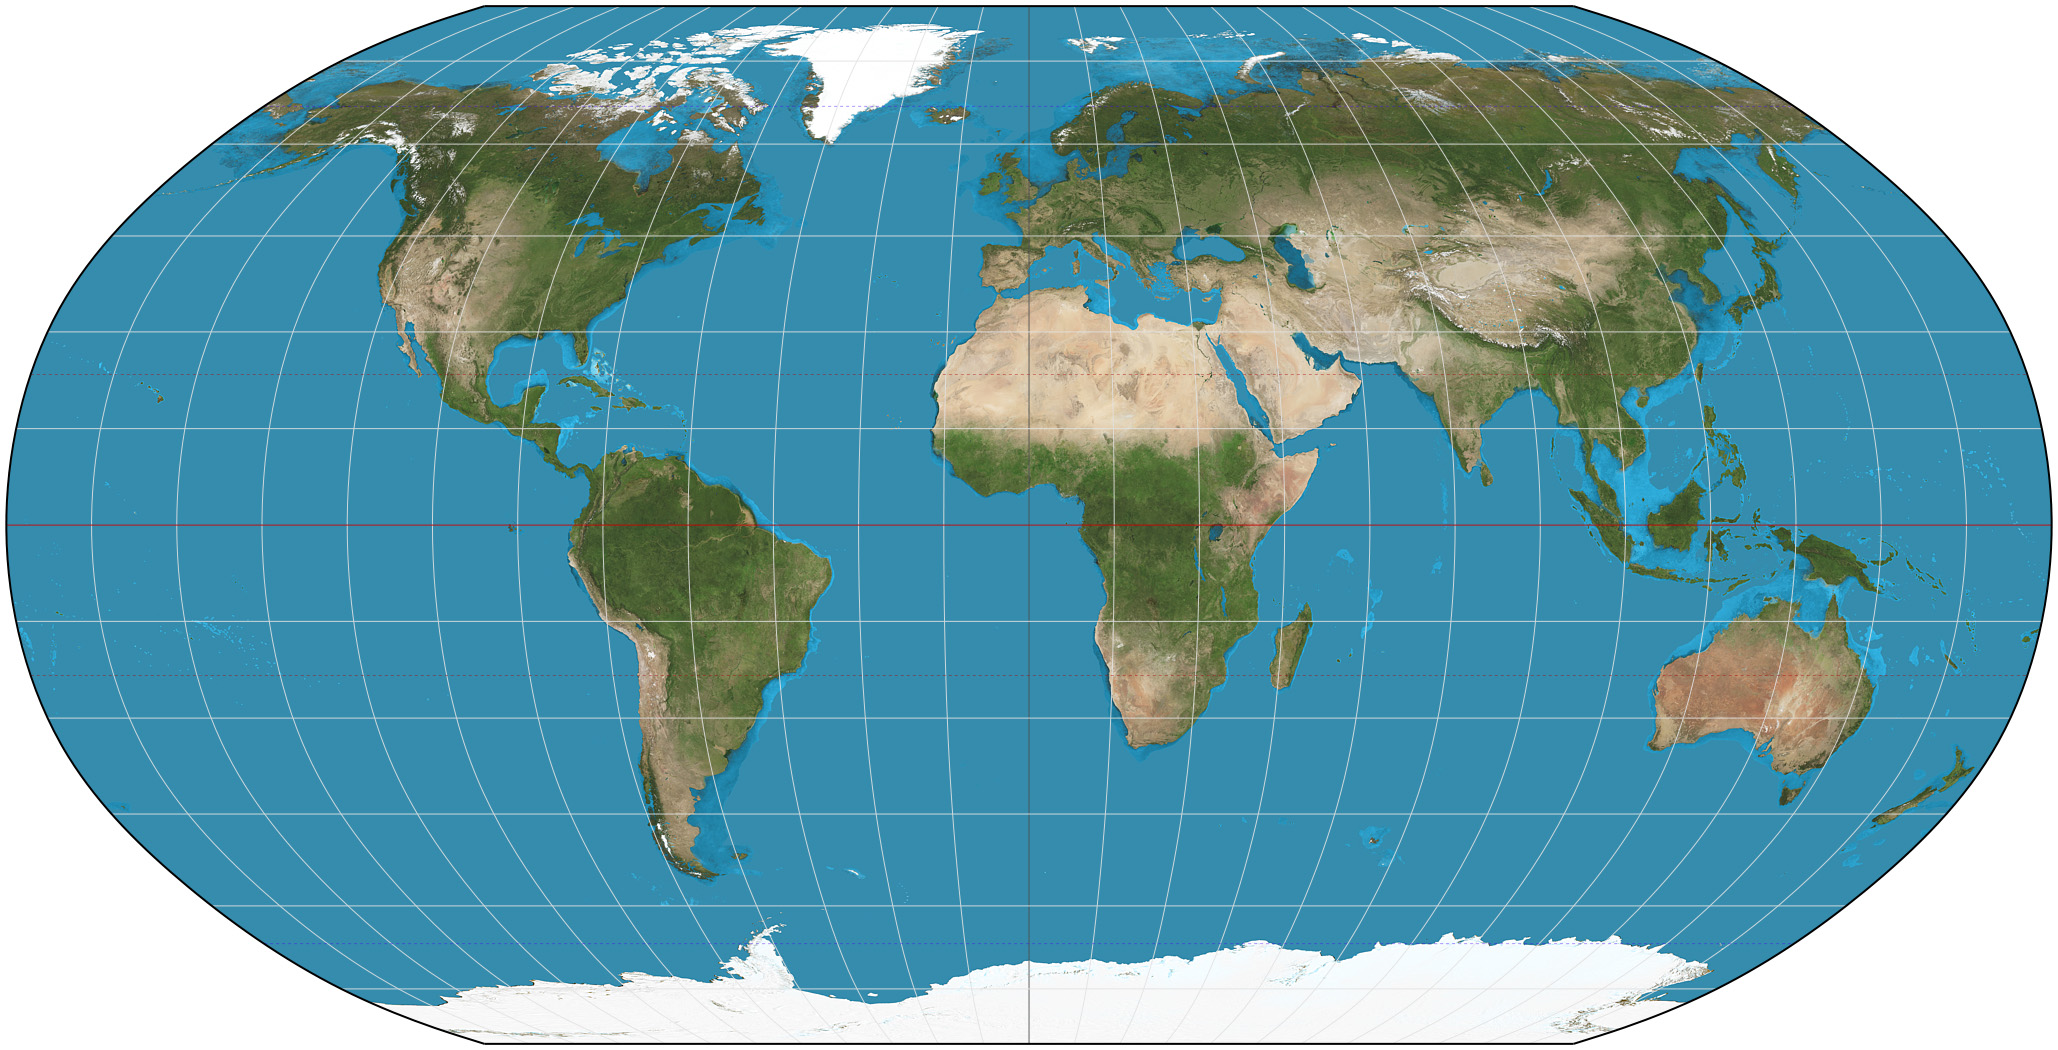
- Robinson Projection- Preserves size and shape of continents but distorts polar areas, compromises the projection in order to be used in published areas.
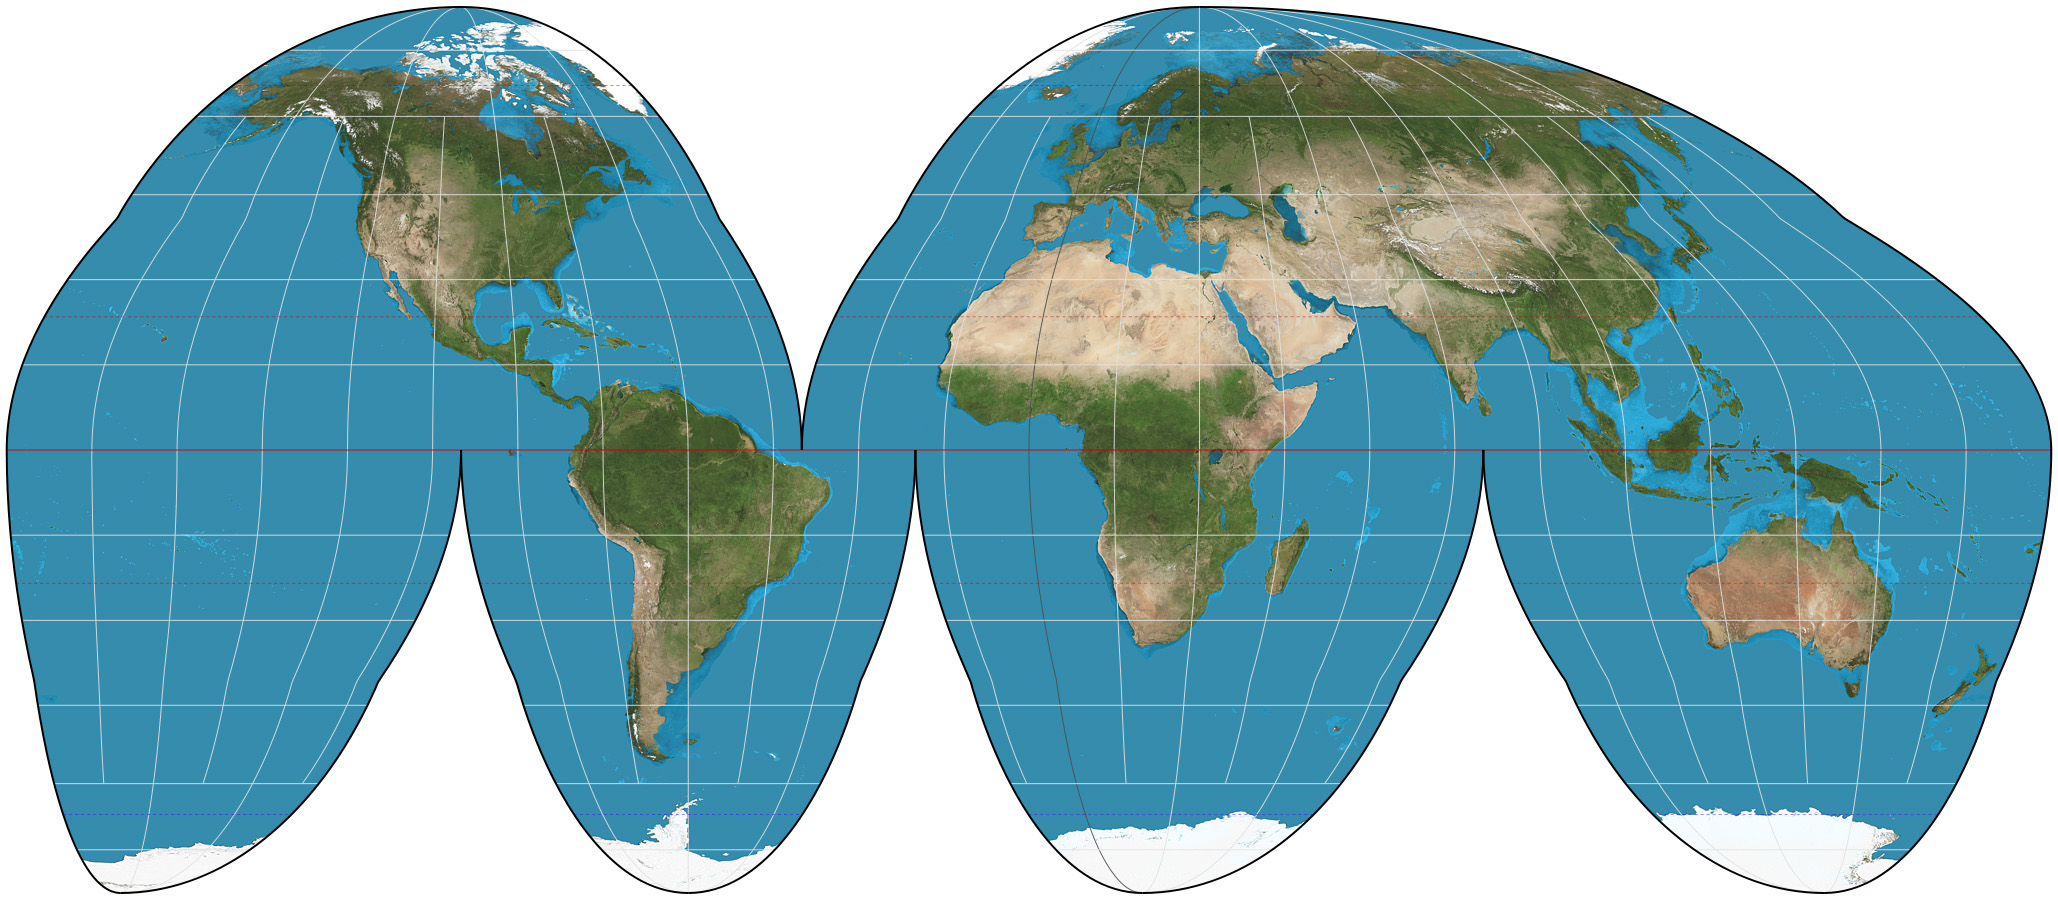
- Goode’s Projection- Interrupted projection removes much of the oceans to preserve size and shape of land masses, often used for thematic maps.
1.1 IMPORTANT VOCABULARY
Reference Maps- Designed for people to refer to for general information about places
Political Maps- Show and label human-created boundaries and designations, such as countries, states, cities and, capitals
Physical Maps- Show and label natural features, such as mountains, rivers and deserts
Road Maps- Show and label highways, streets, and alleys
Plat Maps- Show and label property lines and details of land ownership
Thematic Maps- Show spatial aspects of information or of a phenomenon
Choropleth Maps- Use various colors, shades of one color, or pattern to show the location and distribution of spatial data, often show rates or other quantitative data.
Dot Distribution Maps- Show the specific location and distribution of something across a map. Each dot represents a specified quantity. Any kind of symbol can be used for these types of maps.
Graduated Symbol Maps- Use symbols of different sizes to indicate different amounts of something. Larger sizes indicate more and smaller sizes indicate less. They make it easy to see where the largest and smallest of some phenomena are by comparing the symbols to each other.
Isoline Maps- Lines that connect points of equal value to depict variations in the data across space. Where lines are close together, the map depicts rapid change, and where the lines are farther apart, the phenomenon is relatively the same.
Topographic Maps- Points of equal elevation, creating contours that depict surface features
Cartogram- The sizes of countries (or states, counties, or other areal units) are shown according to some specific statistic.
Scale- Ratio between the size of things in the real world and the size of those same things on a map
Small-scale Maps- A larger amount of area with less detail
Large-scale Maps- Smaller amount of area with greater amount of detail
Absolute Location- Precise spot where something is according to a system
Relative Location- Description of where something is in relation to other things
Connectivity- How well two locations are tied together by roads or other links
Accessibility- How quickly and easily people in one location can interact with people in another location
Direction- Are used to describe where things are in relation to each other. Cardinal ______ such as north, east, south, or west or intermediate _____ such as southeast, or southwest are commonly used to describe _____.
Patterns- General arrangement of things, in the distribution of phenomena across space that gives clues about causes or effects of the distribution
Absolute Distance- Usually measured in terms of feet, miles, meters, or kilometers. Exact measurement of how far or how near things are to one another
Relative Distance- Indicates the degree of nearness based on time or money and is often dependent on the mode of travel
Distribution- The way a phenomenon is spread out over an area
Clustered (Agglomerated)- Phenomena that is arranged in a group or concentrated area
Linear Distribution- Phenomena that is arranged in a straight line
Dispersed Distribution- Phenomena that is spread out over a large area
Circular Distribution- Phenomena that is equally spaced from a central point, forming a circle
Geometric Distribution- Phenomena is in a regular arrangement
Random Distribution- Phenomena that appears to have no order to their position