a) Equilibrium price and quantity
a) equilibrium price and quantity and how they are determined
b) the use of supply and demand diagrams to depict excess supply and demand
c) the operation of market forces to eliminate excess demand and excess supply
price → determined by the laws of supply and demand
market equilibrium = quantity demanded of a product = quantity supplied of a product
market disequilibrium = quantity demanded of a product =/= quantity supplied of a product
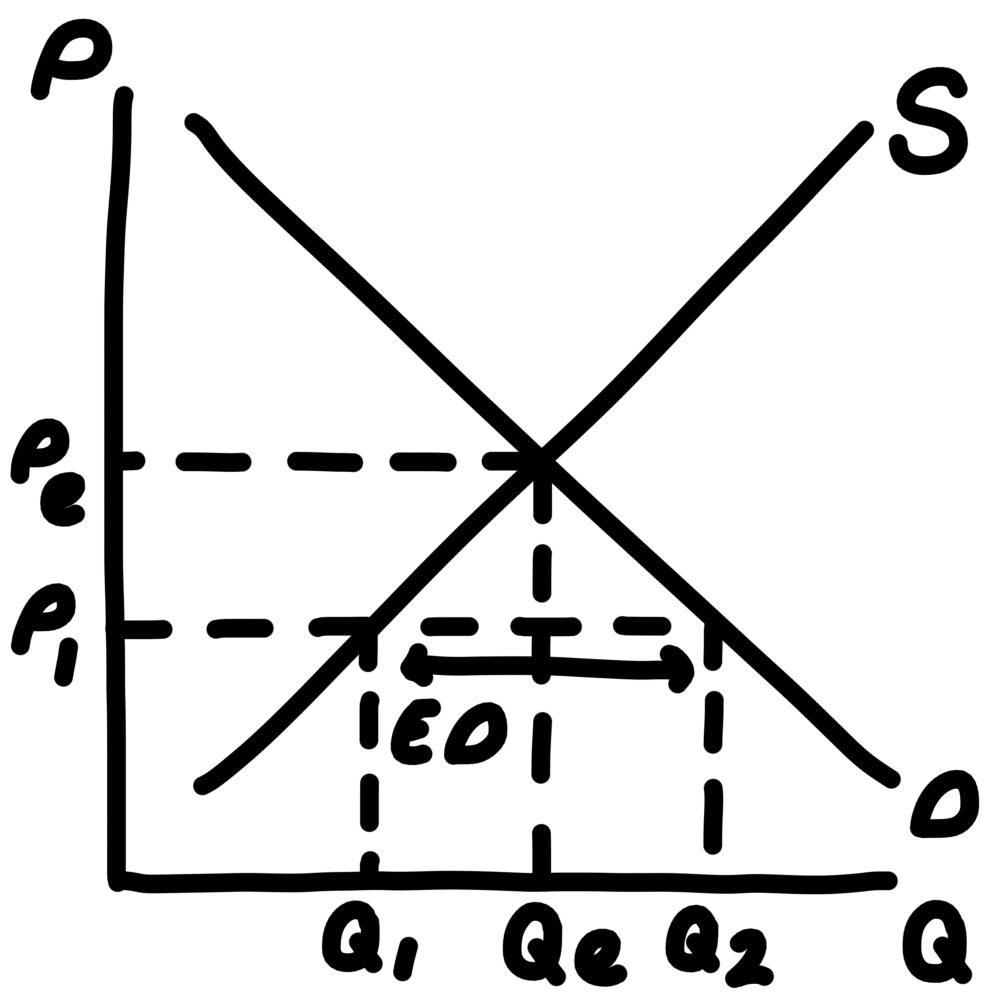
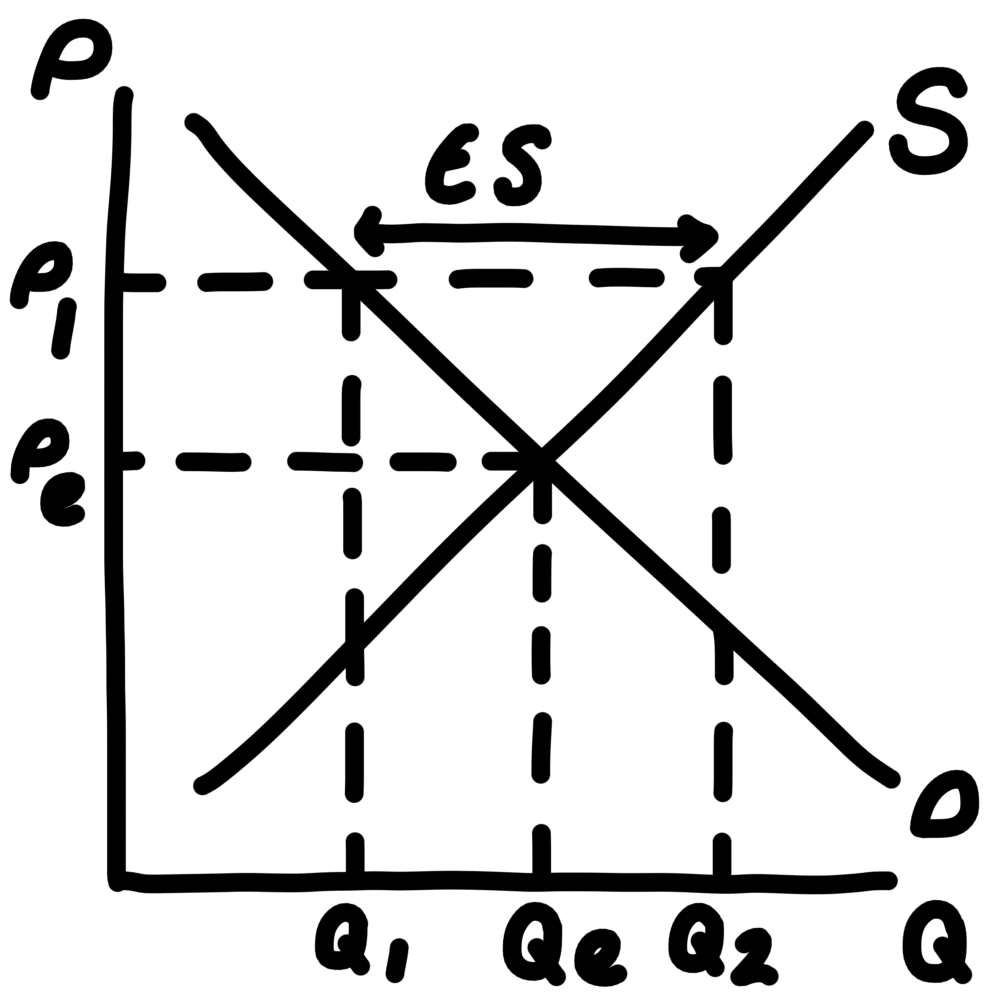
causes an excess demand OR excess supply
price = below equilibrium price OR above equilibrium price
excess demand = quantity demanded > quantity supplied
price = too low
excess supply = quantity supplied > quantity demanded
price = too high
market forces will eliminate excess demand and excess supply
when there is excess demand
firms increase prices to increase profit
contraction in quantity demanded + extension in quantity supplied
when there is excess supply
firms decrease prices to increase profit
contraction in quantity supplied + extension in quantity demanded