Absorption spectroscopy
Concept of spectroscopy
==Spectroscopy== is the examination or viewing of colour.
Purpose: Qualitative/quantitative cognition of matter and follow time scaled change of matter.
A spectrum is when one intensity-like quantity is represented as a function of an energy-like quantity.
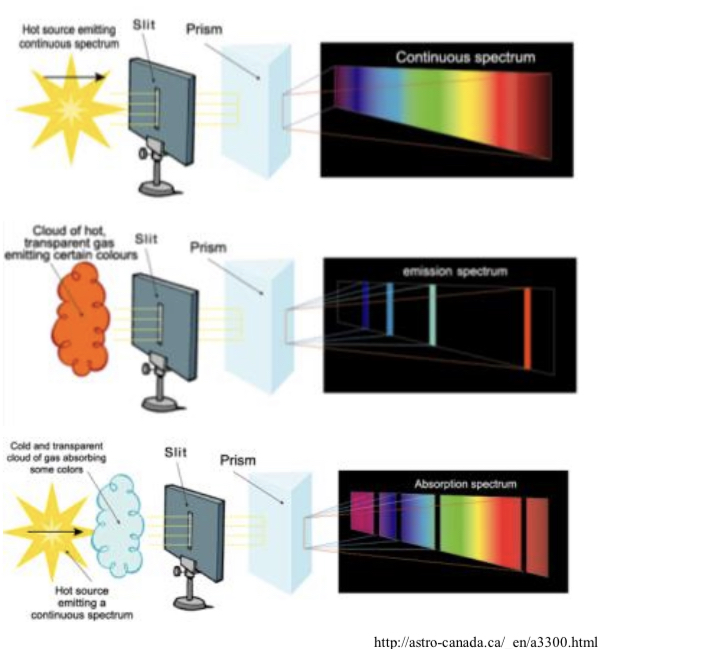
Types of spectrum
Continuous emission: Glowing hot solid and liquid source.
Emission line-type: Hot rarefied gas at low pressure.
Absorption line-type: Absorption of cooler gas.
Concept of absorption
If an electron in ground state is transmitted enough energy to excite it to certain excited level, it will be in excited state. This is called ABSORPTION. When light is propagated in materials this is how it loses its intensity.
Decrease in intensity in dilute solutions can be described by the ==Lambert-Beer law==:
𝐼 = 𝐼0 𝑒−𝜀(𝜆)𝑐𝑥
Where 𝐼 is intensity leaving the solution, 𝐼0 is intensity entering the solution, 𝜀(𝜆) is absorption coefficient at certain wavelengths, 𝑐 is concentration and 𝑥 is thickness.
Absorbance is the negative log of light leaving.
𝐴 = 𝑂𝐷 = 𝑙𝑔 𝐼0/𝐼 = 𝜀(𝜆)𝑐𝑥
𝑐=𝐴/𝜀(𝜆)𝑥
Wavelength dependence of absorption
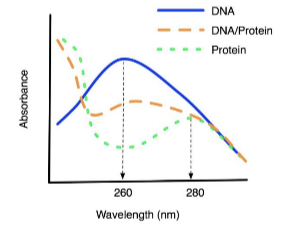
Interaction of light is in a wavelength dependent manner so light absorption will also be a function of wavelength. Wavelengths matching the system substance will be absorbed and non-matching won’t go through.
Tryptophan, tyrosine and phenylalanine have spectra in the UV range, majority of proteins contain these amino acids so have absorption maximum of 280nm. The peptide bonds give absorption peak at 220nm and nucleic acids have 260nm due to pyrimidine and purine bases.
Transmission is the quotient of intensity of incident light.
𝑇=𝐼/𝐼0
* Not an additive parameter.
Recording absorption spectrum
Absorption spectrum is gotten by recording wavelength dependence of absorbance. It is not suitable for qualitative identification alone due to wide bands.
It can be recorded with a spectrophotometer which contains:
• Light source (F): illuminates in the wavelength range of 200-800 nm
• Monochromator (M): selects wavelength range
• Sample holder (S - sample solution, R - reference solution)
• Photodetector (D): measures intensity (using a photoelectron multiplier)
• Electronic unit (E)
• Computer (C)
• Mirrors (T)
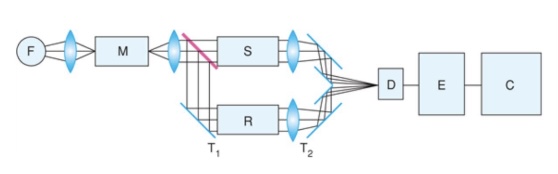 The arrangement can be ==single beam== where there is only one curette so intensity of reference and sample solution is measured one after the other or it can be ==double beam== where there are two curette’s so they can be measured at same time.
Application of absorption spectrum
Spectrophotometry is commonly used in biochemistry for fast measurement of small amounts of materials. The material gets coloured if absorption spectrum is in visible range.
Interaction of light with matter
We can’t see molecules but on the basis of spectrum we can estimate their shape.
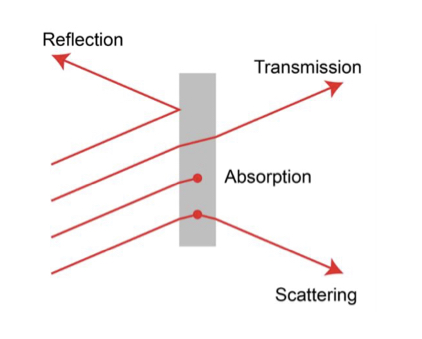
Interaction occurs by; reflection, absorption, transmission and scattering.
Jablonski schematic
Shows different energy states S0, S1, S2 and their quantized vibrational states. It shows how an electron may accept and dissipate energy from photon of certain wavelength.
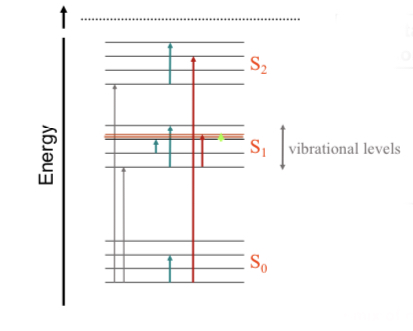
Depending on the photon energy there can be:
•Electric transition
•Vibrational transition: molecules vibrating at certain frequencies determined by molecules shape.
•Rotational transition: molecules rotating around an axis with quantized frequency. Requires energy in micro to nano electron volt(eV).
• Mix of all 3
Application of absorption photometry
This is used in pulse oximeters that measure the arterial oxygen saturation by absorption of light by haemoglobin.
Transmission — Reflectance