ECMT1020_Lecture_Week_5
How many types of data are there?
Types of Data:
Cross-sectional data: Observations at a single point in time.
Time series data: Repeated observations over time on the same entities.
Panel data: Combines features of both cross-sectional and time series data, with repeated observations on the same entities over time.
What are the 6 assumptions for regression models with nonstochastic regressors?
Importance of Assumptions: Necessary to examine the properties of the regression model.
Key Assumptions:
A.1: The model is linear in parameters and correctly specified.
A.2: There is variation in the regressor within the sample.
A.3: The disturbance term has zero expectation.
A.4: The disturbance term is homoskedastic (constant variance).
A.5: The values of the disturbance term have independent distributions.
A.6: The disturbance term has a normal distribution.
How to find the Unbiasedness of the OLS Regression Coefficients?
Random Components: Essential for understanding the behavior of OLS estimators.
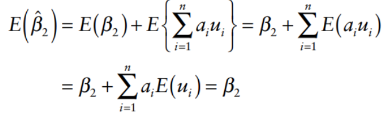
Unbiasedness:
The OLS regression coefficients are unbiased if the assumptions hold.
Normal distribution of regression coefficients occurs if the disturbance term is normally distributed.
Fitted regression coefficient:
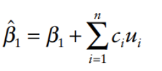
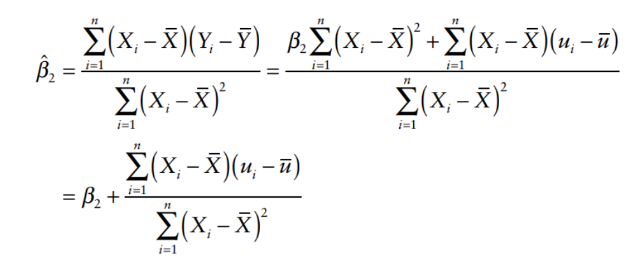
Finding unbiasedness using fitted regression coefficient:

How do you define the precision of the regression coefficients?
Variances of the Regression Coefficients: Important for understanding the reliability of estimates.

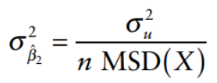
Define the mean square deviation MSD of X:
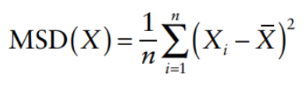
Rewrite variance of b2 as:
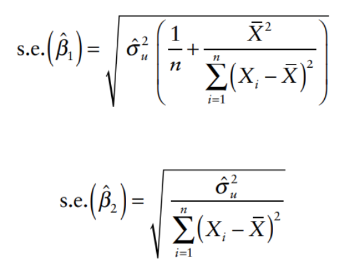
Standard Errors: Measure the precision of the estimated coefficients.
How to test for hypotheses relating to the regression coefficients?
Hypothesis Testing: Involves testing the significance of regression coefficients.
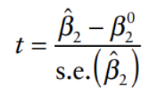
T-statistics formula:
Degrees of Freedom:
In simple regression, degrees of freedom = n - 2 (where n is the number of observations).
For multiple regression, a more general expression is required.
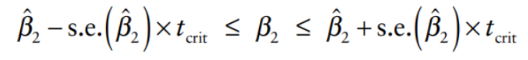
Confidence Intervals: Used to assess the range of values for the regression coefficients.
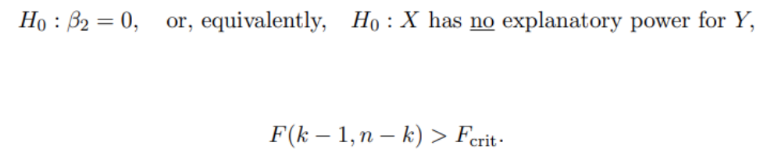
2.7 The F Test of Goodness of Fit
Purpose: To test the overall
significance of the regression model.
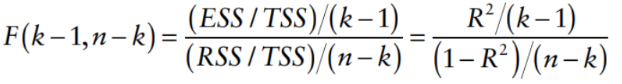
How to compute the F-statistic (2 ways):
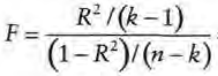
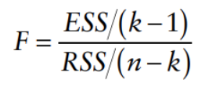
k: number of parameters in regression
n: number of observations
F statistics is an increasing function of R2 (dividing both numerator and denominator by TSS):
Key Concepts: Involves comparing the model with a null hypothesis to determine if the model explains a significant amount of variance in the dependent variable.
the F-statistic is equal to the square of the t-statistic.
Key Terms
Ordinary Least Squares (OLS): A method for estimating the parameters in a linear regression model.
Homoskedasticity: The assumption that the variance of the error terms is constant across all levels of the independent variable.
Normal Distribution: A probability distribution that is symmetric about the mean, indicating that data near the mean are more frequent in occurrence.