L7: Characterization Methods for Crystalline and Amorphous Polymers
1. Crystallinity Determination
Techniques for determining crystallinity:
Density determination (Densimetry): Measures the density difference between crystalline and amorphous regions.
Thermal analysis (DSC/DTA): Measures heat flow during phase transitions (e.g., melting, crystallization).
Wide-angle X-ray scattering (WAXS): Distinguishes crystalline peaks from the amorphous halo.
Other techniques (less quantitative): Raman, IR, and NMR spectroscopy.
2. Wide-Angle X-Ray Scattering (WAXS)
Principle: X-rays are scattered by the crystalline regions, producing diffraction peaks, while amorphous regions produce a diffuse halo.
Degree of crystallinity (Xc):
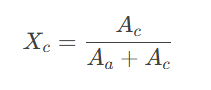
Ac: Area under crystalline peaks.
Aa: Area under the amorphous halo.
Example: WAXS curve for medium-density polyethylene shows crystalline peaks and an amorphous halo.
3. Densimetry (Density Gradient Column)
Principle: Crystalline regions have higher density than amorphous regions. The degree of crystallinity is calculated from the density difference.
Formula:
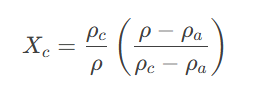
ρc: Density of crystalline component.
ρa: Density of amorphous component.
ρ: Density of the sample.
Advantages: Simple, accurate, requires small samples.
Disadvantages: Sensitive to bubbles and fillers; assumes no interaction between the sample and the solvent (e.g., water/ethanol).
4. Thermal Analysis (DSC and DTA)
Differential Scanning Calorimetry (DSC):
Measures heat flow to maintain the sample and reference at the same temperature.
Provides data on:
Glass transition temperature (Tg): A second-order transition where heat capacity changes.
Crystallization temperature (Tc): Exothermic process.
Melting temperature (Tm): Endothermic process.
Enthalpy of fusion (ΔHf): Used to calculate crystallinity.
Differential Thermal Analysis (DTA):
Measures temperature difference between sample and reference.
Provides similar information to DSC but does not measure enthalpy directly.
Example DSC thermogram: Shows Tg, Tc, and Tm peaks.
5. Glass Transition Temperature (Tg)
Definition: The temperature at which an amorphous polymer transitions from a glassy to a rubbery state.
Characteristics:
Second-order transition: Discontinuity in heat capacity (Cp), thermal expansion coefficient (α), and compressibility (κ).
Affected by: Chemical structure, composition, and phase separation.
DSC can detect Tg: Indicated by a step change in heat flow.
6. Degree of Crystallinity by Thermal Analysis
Formula:
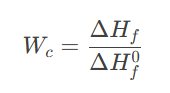
ΔHf: Enthalpy of fusion for the sample.
ΔHf0: Enthalpy of fusion for 100% crystalline material.
Wc: Weight fraction of crystallinity.
7. Relationship Between Tg and Tm
General trend: Tg is typically between 0.5 and 0.8 of Tm (in Kelvin).
Examples:
Polyethylene (LDPE): Tg=−110∘C Tm=115∘C.
Polystyrene (PS): Tg=100∘C Tm=240∘C.
Nylon 6,6: Tg=57∘C Tm=265∘C.
8. DSC for Phase Separation and Miscibility
Miscible blends: Show a single Tg between the Tg values of the individual components.
Immiscible blends: Show separate Tg values for each component.
Example: DSC thermograms of poly(ethyl methacrylate) (PEMA) blends with styrene-cinnamic acid copolymers (PSCA) show miscibility.
9. Summary of Key Points
WAXS: Provides quantitative crystallinity by distinguishing crystalline peaks from the amorphous halo.
Densimetry: Measures crystallinity based on density differences between crystalline and amorphous regions.
DSC/DTA: Provides information on phase transitions (Tg, Tc, Tm) and enthalpy changes.
Glass Transition (Tg): A second-order transition detected by DSC, affected by polymer structure and phase separation.
Crystallinity Calculation: Can be determined from enthalpy of fusion (ΔHf) using DSC.
Phase Separation: DSC can detect miscibility or immiscibility in polymer blends.
Learning Outcomes
By the end of this lecture, you should be able to:
Understand the techniques used to determine crystallinity in polymers, including WAXS, densimetry, and DSC.
Interpret WAXS data to calculate the degree of crystallinity.
Explain the principles of densimetry and calculate crystallinity from density measurements.
Understand how DSC works and interpret DSC thermograms to identify Tg, Tc, and Tm.
Calculate the degree of crystallinity using enthalpy of fusion (ΔHf) from DSC data.
Explain the relationship between Tg and Tm and how they are affected by polymer structure.
Use DSC to determine phase separation and miscibility in polymer blends.