Kin 310 Exam 3/Final - KSU
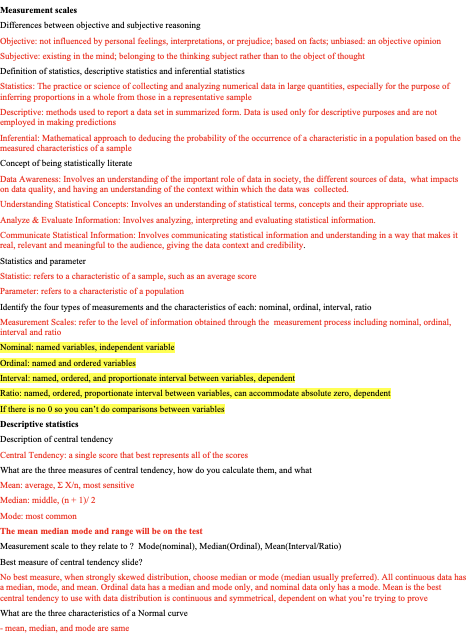
Measurement scales
Differences between objective and subjective reasoning
Objective: not influenced by personal feelings, interpretations, or prejudice; based on facts; unbiased: an objective opinion
Subjective: existing in the mind; belonging to the thinking subject rather than to the object of thought
Definition of statistics, descriptive statistics and inferential statistics
Statistics: The practice or science of collecting and analyzing numerical data in large quantities, especially for the purpose of inferring proportions in a whole from those in a representative sample
Descriptive: methods used to report a data set in summarized form. Data is used only for descriptive purposes and are not employed in making predictions
Inferential: Mathematical approach to deducing the probability of the occurrence of a characteristic in a population based on the measured characteristics of a sample
Concept of being statistically literate
Data Awareness: Involves an understanding of the important role of data in society, the different sources of data, what impacts on data quality, and having an understanding of the context within which the data was collected.
Understanding Statistical Concepts: Involves an understanding of statistical terms, concepts and their appropriate use.
Analyze & Evaluate Information: Involves analyzing, interpreting and evaluating statistical information.
Communicate Statistical Information: Involves communicating statistical information and understanding in a way that makes it real, relevant and meaningful to the audience, giving the data context and credibility.
Statistics and parameter
Statistic: refers to a characteristic of a sample, such as an average score
Parameter: refers to a characteristic of a population
Identify the four types of measurements and the characteristics of each: nominal, ordinal, interval, ratio
Measurement Scales: refer to the level of information obtained through the measurement process including nominal, ordinal, interval and ratio
Nominal: named variables, independent variable
Ordinal: named and ordered variables
Interval: named, ordered, and proportionate interval between variables, dependent
Ratio: named, ordered, proportionate interval between variables, can accommodate absolute zero, dependent
If there is no 0 so you can’t do comparisons between variables
Descriptive statistics
Description of central tendency
Central Tendency: a single score that best represents all of the scores
What are the three measures of central tendency, how do you calculate them, and what
Mean: average, Σ X/n, most sensitive
Median: middle, (n + 1)/ 2
Mode: most common
The mean median mode and range will be on the test
Measurement scale to they relate to ? Mode(nominal), Median(Ordinal), Mean(Interval/Ratio)
Best measure of central tendency slide?
No best measure, when strongly skewed distribution, choose median or mode (median usually preferred). All continuous data has a median, mode, and mean. Ordinal data has a median and mode only, and nominal data only has a mode. Mean is the best central tendency to use with data distribution is continuous and symmetrical, dependent on what you’re trying to prove
What are the three characteristics of a Normal curve
- mean, median, and mode are same
- symmetrical about midpoints
- tails of curves are asymptotes
What are the rules of percent of population within 1, 2 and 3 SD above and below the mean on a normal distribution
X + 1SD = 68%
X + 2SD = 95%
X + 3SD = 99.7%
Sketch a negatively, positively skewed curve and a leptokurtic and platykurtic distribution
Given two different distributions, compare them by changing them to a standardized z value
like example from class, and use this Z score to calculate a T score
Mean of 50 and a standard deviation of 10. Can easily change Z scores to T scores by using formula
T = 10* (Z score) + 50
Define concept of Confidence Interval
Provides an expected upper and lower limit for a stat at a specified probability level
List the three assumptions of a parametric distribution
population from which the sample is drawn must be normally distributed on the variable of interest, samples drawn from a population must have the same variances on the variable of interest, the observations made must be independent
Parametric versus non-parametric statistical test
Non-parametric: any number of statistical tests that do not meet the assumptions of the parametric test.
Correlations: CORRELATIONS ARE NOT CAUSAL
What is a correlation, the range of values is from -1 to 1
A statistical technique used to determine the relationship between two or more variables
n -1 strong negative relationship (as one variable increases, the other decreases)
n 0 no relationship between variables
n +1 strong positive relationship (as one variable increases, the other increases)
2 correlations, one is -.85 and the other is 0.75, which is the stronger relationship = -0.85
Be able to do a scattergram or scatter plot of a data set
Scatterplots allow for the visual recording of a relationship and can be used to see if the data follows a positive or negative trend
Give some examples of variables that would have positive and negative correlations
Arm and grip strength have a strong positive, exercise and cholesterol strong negative, fitness and resting heart rate is strong negative
What are some cautions to remember or consider when working with correlations
1. Correlation is specific to the group, time, and conditions under which it is obtained (small groups show less correlation)
2. Correlation coefficient does not imply a cause-and-effect relationship
3. The correlation coefficient only estimates the linear relationship between variables, they may be related in another way (curvilinearity)
4. Learning curves and fatigue curves are typically curvilinear
Calculate a correlation using the formula for the Pearson product moment correlation
Calculate the coefficient of determination and give an explanation of its meaning
Indicates the portion of the total variance in one measure that can be explained or accounted for by the variance in the other measure
Calculate a regression equation and make a prediction from your calculations for a given X value
Regression equation models the dependent relationship of two or more variables, it is a measure of the extent to which researchers can predict one variable from another, speficially how the dependent variable typically acts when one of the independent variables is changed
Y=a+bX (b is slo0pe of the line, A is the y-intercept)
Describe what we mean by a multiple regression- problems with multiple regression
Have one dependent variable (criterion of some sort), and two or more predictor variables (independent variables). By using several predictors, you can increase accuracy of prediction.
Problems: shrinkage-tendency for the validity to decrease when the prediction formula is used with a new sample, population specificity-phenomenon whereby a regression equation that was developed with a particular sample loses considerable accuracy when applied to others
What is true score theory, what do we mean by random and systematic error, and how do random and systematic error affect the average and variability of the data
True score theory: every measurement is an additive composite of two components, true ability (true measurement of respondent on measure), and random error, a measure with no random error has perfect reliability (not all error is random)
Random Error: caused by any factors that randomly affect measurement on the variables across the sample ex: mood, random error does otn affect average performance, called noise
Systematic error: caused by any factors that systematically affect measurement of the variable across the sample ex: loud noises while testing hurt everyones performance
How can we reduce measurement error
Your score=true score +error
Pilot test instruments, get information on how environment affected performance, train data collectors thoroughly, double check data and entry, use statistical procedures to adjust for measurement error, use multiple measures of the saem construct
Define reliability and the four different types
Reliability: consistency or dependability of measurement, if measured twice in the same indivudial, scores would be similar, reduction of measurement error
Calculating reliability: the conditions under whicih scores are collected and time between collections introduce differing error components, reliability can range from 0 to 1 with 0 meaning no reliability, 0.5 meaning half of variabnce is due to truth and half to error, and 1 meaning that 100% of variability is due to true score
True score/(true score+error)
If there is no error, there is perfect reliability. As error increases, reliability decreases
4 classes of reliability:
Inter-Rated or Inter-Observer Reliability: used to assess the degree to which different raters/observers give consistent estimates of the same phenomenon, best way to estimate reliability when measure is an observation
Test-Retest Reliability: used to assess the consistency of a measure from one time to another, useful if learning is not an issue (anxiety)
Parallel-Forms Reliability: Used to assess the consistency of the results of two tests constructed in the same way from the same content domain, exam with too many students (versions)
Internal Consistency Reliability: used to assess the consistency of results across items within a test, commonly used in measurements (Cronbach’s Alpha)
Define objectivity and give examples of objective and subjective measurements
Objectivity: Form of reliability in which difference in test administrators is examined, some tests are pretty objective: height, distance, strength. Some are subjective: blood pressure, skin-folds. Objectivity is examined by having more than one tester gather data, then score are analyzed with intra-class correlation techniques to get inter-tester reliability coefficient
Define validity and describe the five types : face, content, concurrent, predictive, and construct
Face Validity: On its face does test measure what it is suppose to measure and does research examine what it si supposedly examining ex: anxiety questionnaire-does it look like an anxiety questionnaire, doe sit measure the things that seem to indicate anxiety
Content Validity: degree to which a measuring instrument or process contains tasks that provide evidence about traits or capabilities being measured, almost always related to learning in educational settings, supported by logical evidence, evaluated by logically examining actions required to complete measurement, ex: does your research and measurement quiz test the content covered in the course
Concurrent Validity: Establish validity versus some criterion measurement, ability to distinguish between grousp that it should distinguish between, ex: test a new measurement against an existing gold standard type of instrument, ex: skinfolds vs underwater weighing, do results found in doing skinfolds correlate with the results found in the underwater weighing tests
Predictive Validity: Scores will have high correlation to some future measure, measure indivudials with instrument than wait and look at future performance, does measure predict what it should be able to predict, ex: lifestyle and coronary heart disease, does lifestyle behaviors correlate with incidence of heart disease? This is how we have reached many conclusions about smoking behavior
Construct Validity: Constructs like athletic ability, anxiety, and self-esteem are believed to exist because they explain observable behavior. Do these constructs really exist and can they be measured? Translating ideas and theories into measures, conduct experiments in which specific outcomes are hypothesized, does your test measure this construct and how valid is this construct
Ex: Self-esteem: Is self-esteem different from self-confidence and self-concept, or do they all represent the same thing?
Reliability is a necessary but not sufficient condition for validity. If the needle of the sale is 5 pounds away form zero, I always over-report my weight by 5 punds. Is the measurement consistent? Yes. But it is consistently wrong. Is the measurement valid? No
Inferential statistics
Mathematical approach to deducing the probability of the occurrence of a characteristic in a population based on the measured characteristics of a sample
What is inference and how is it done (null hypothesis)
Define significance (in statistics) and power
Statistics "significant" means probably true
Significance: Infers that the relationship is not simply due to randomness or chance, but that there is truly a relationship between the variables
Power: increase chances of rejecting a false null hypothesis
What is probability
Likelihood of something occurring
What are type I and type II errors and what do we mean by p<.05 or p<.01
Type 1: we reject the null hypothesis in our sample, even though the null hypothesis is true for the population, false positive
Type 2: we retain the null hypothesis in our sample, even though the null hypothesis is false for the population. False negative
P <.05: Significance level given is how willing we are to make a type I error
What is done to control error
Reduce type I error by reducing significance level
Trade off is increasing risk of type II error and losing power
General Linear Model : basis for most statistical analyses in social research
A system of equations that is used as the mathematical framework for most the statistical analyses used in applied social research
Be able to complete a t-test, look for statistical significance, and explain the results
T test: good statistical procedure to see if means of two groups are significantly different. Significant relationship between a nominally scaled independent variable with two levels and a dependent variable that is interval or ratio in scale, are means of groups different enough?
Explain how to increase the power of a t-test
Increase probability of rejecting null hypothesis when null hypothesis is actually false
1. Show a greater difference in the means of the two groups by using a better and stronger treatment
2. Reduce variance in groups by applying treatments more consistently
3. Increase number of sunjects in study
(When T is found to be significant, we are saying that the true variance exceeds the error variance)
Check to see if a correlation is significant
If correlation is less than critical value, correlation is not significant
Factors in using correlations to infer (sample size, p level, coefficient of determination)
Sample size: need a higher correlation to be significant at 0.01 level vs 0.05 level, coefficient determination gives a good idea of strength of a relationship
Have a basic understanding of an ANOVA and the F-data treatment
ANOVA: Analysis of variance, 1 interval or ratio dependent variable and 1 nominal independent variable with 3 or more levels, a t-test is a special type of ANOVA with just 2 levels of the independent variable, helps keep significance level at p<.05 or p<.01
F values and rejecting the null
If the null hypothesis is rejected it is because the F value is significantly larger than 1, if the null hypothesis is true, we expect an F value of 1.0
Do a Chi-square calculation and determine significance of the research
One nominally scaled independent variable, one nominally scaled dependent variable, data classified by category (gender, age, grade level..), interest is whether the number of cases in each category is different from what would be expected on the basis of chance, a test of significance of discrepancy between discovered and expected results, non- parametric test used for statistical significance,
Restrictions in using the Chi-Square test
Accepts weaker, less accurate data as input (in comparison to parametric tests), less status in the pantheon of statistical tests. More ‘forgiving’ in the data it will accept, it can be used in a wide variety of research contexts, observations must be independent and mutually exclusive, observation can only be placed in one category, chi square is not usually applicable for small samples, expected frequency should be logical and established before data is collected
Concept of significance versus meaningfulness
1. Statistical significance is not meaningful unless the study has a sound conceptual base that leads to some meaning to the significance of the outcome
2. Statistical significance cannot be interpreted independently of the context within which it occurs
3. While statistical significance is important as a concept, it is not the end all and not the only goal of scientific research. We test hypotheses, we don’t try to prove them