Applied Methods of Sociological Enquiry
Introduction to Sociological Research Methods
Sociological research methods are tools and techniques used to investigate societies, social behaviors, and cultures. They enable sociologists to collect data, analyze it, and draw conclusions about social phenomena. Methods are chosen based on the research question, objectives, and the nature of the data needed.
The Research Process
Planning Research
Formulating the Research Question or Hypothesis: Clearly define what you want to investigate. This can be a specific question or a hypothesis that can be tested.
Literature Review: Review existing research to understand the current state of knowledge on your topic and to identify gaps your research could fill.
Choosing a Research Design: Decide on the overall strategy for collecting and analyzing data. This includes choosing between qualitative and quantitative methods, or a mixed methods approach.
How Do Sociologists Make Choices About Research?
When sociologists plan their research, several factors influence their choices:
Cost, Funding, and Time Available:
Cost: The financial resources required for conducting research can be substantial. Sociologists must consider if they have the necessary funding to support their study. Funding can come from universities, government grants, non-profit organizations, or private sector sponsors.
Funding: The source and amount of funding can influence the scope and scale of the research. For instance, a well-funded project may allow for a larger sample size or more comprehensive data collection methods.
Time Available: The duration allocated for the research also affects the planning process. Short-term projects may necessitate simpler methods and smaller sample sizes, while long-term studies can afford more complex designs.
The Sociologist’s Personal Interests:
Researchers often choose topics that align with their personal interests or areas of expertise. This intrinsic motivation can drive a more passionate and thorough investigation.
Availability of a Sample:
The accessibility of a suitable sample population is crucial. Researchers need to ensure that they can gather data from a representative group that meets the study’s requirements.
Society’s Current Problems:
Sociologists frequently focus on contemporary societal issues, aiming to address pressing problems. Current social, economic, or political issues can direct the focus of the research to provide relevant insights and solutions.
Process of Planning:
Deciding on an Aim, Hypothesis, or Research Question:
Aim: The general purpose or goal of the study. It outlines what the researcher hopes to achieve.
Hypothesis: A testable statement predicting the relationship between variables. Hypotheses are more common in quantitative research.
Research Question: A clear, focused question that guides the study. It is crucial for both qualitative and quantitative research and helps in narrowing down the scope of the investigation.
Choosing Method(s):
Planning Questions:
Researchers need to develop specific questions that align with their aims, hypotheses, or research questions. These questions guide data collection and help in structuring interviews, surveys, or observational studies.
Quantitative or Qualitative Data – Reasons for Choice:
Quantitative Data: Involves numerical data and statistical analysis. It is often chosen for its ability to generalize findings to larger populations and to identify patterns or correlations.
Qualitative Data: Involves non-numerical data such as interviews, observations, and textual analysis. It is chosen for its depth and ability to provide rich, detailed insights into complex social phenomena.
Ethical Issues – May Help Decide the Type of Research:
Ethical considerations play a significant role in research design. Researchers must ensure the privacy and confidentiality of participants, obtain informed consent, and avoid harm. Ethical guidelines can influence the choice of methods; for instance, sensitive topics may require more anonymized and less intrusive data collection methods.
Sampling Methods
Selection of Sampling Techniques
Target Population:
The target population is the entire group that the researcher is interested in studying. This group is defined by specific characteristics relevant to the research question, such as age, gender, socioeconomic status, or geographic location.
Sampling Frame:
A sampling frame is a list or database that includes all members of the target population. This frame is essential for selecting a sample and ensuring that every individual in the population has a chance of being included in the study.
Representative Sample:
A representative sample accurately reflects the characteristics of the target population. This ensures that the findings from the sample can be generalized to the larger population. Achieving a representative sample is crucial for the validity of the research.
Reasons for Choosing a Sample Type
Opportunity Sample:
Definition: This method involves selecting participants who are readily available and willing to take part.
Reason for Choosing: It is convenient, quick, and cost-effective. However, it may not be representative of the target population, which can limit the generalizability of the results.
Random Sampling:
Definition: In random sampling, every member of the target population has an equal chance of being selected. This can be done using random number generators or drawing names from a hat.
Reason for Choosing: It minimizes selection bias and increases the likelihood of obtaining a representative sample. This method is highly valued for its ability to produce generalizable findings.
Systematic Sampling:
Definition: Systematic sampling involves selecting every nth member from a list of the target population. For example, if you want a sample of 100 from a list of 1000, you would select every 10th person.
Reason for Choosing: It is simpler and quicker than random sampling while still providing a level of randomness and representativeness. However, if the list has a hidden pattern, it might introduce bias.
Quota Sample:
Definition: In quota sampling, researchers divide the population into subgroups (quotas) based on specific characteristics (e.g., age, gender) and then select participants from each subgroup to meet a predefined quota.
Reason for Choosing: This method ensures that subgroups of interest are represented in the sample, making it useful for studies that require a diverse range of participants. However, it relies on non-random selection within quotas, which can introduce bias.
Snowballing Sample:
Definition: Snowball sampling starts with a small group of initial participants who then refer others to the study. This process continues until a sufficient sample size is reached.
Reason for Choosing: It is particularly useful for studying hard-to-reach or marginalized populations. It leverages social networks to find participants, but it can introduce bias as the sample may become homogenous, reflecting the initial participants' characteristics.
Pilot Study
What is a Pilot Study?
A pilot study is a small-scale preliminary study conducted before the main research project. It serves as a trial run to test the feasibility, time, cost, risk, and adverse events involved in the larger study. Essentially, a pilot study helps researchers identify potential problems and refine their methods and procedures. It is conducted on a smaller sample size and is not intended to provide definitive answers to the research question but rather to improve the design and methodology of the main study.
Reasons for Carrying Out a Pilot Study
Feasibility Assessment:
To determine if the planned methods and procedures are practical and workable.
To assess whether the research design is realistic and manageable in terms of time, resources, and logistics.
Identifying and Addressing Problems:
To detect any issues in the research design, such as ambiguous questions, problematic procedures, or logistical challenges.
To anticipate and mitigate potential risks and complications that could affect the main study.
Testing Data Collection Instruments:
To evaluate the effectiveness and reliability of data collection instruments, such as questionnaires, surveys, or interview guides.
To ensure that the questions are clear, unbiased, and capable of eliciting the required information.
Assessing Data Collection and Analysis Techniques:
To determine if the methods for data collection and analysis are appropriate and effective.
To ensure that the data collected will be sufficient and suitable for addressing the research question or hypothesis.
Training Research Team:
To provide an opportunity for the research team to practice and refine their skills.
To ensure that all team members are familiar with the procedures and can perform their roles effectively.
Establishing Protocols and Procedures:
To develop and standardize protocols and procedures for the main study.
To ensure consistency and reliability in data collection and handling.
Types of Improvements Made After a Pilot Study
Revising Data Collection Instruments:
Modifying questions to eliminate ambiguity, bias, or complexity.
Adding, removing, or rephrasing questions to ensure they are relevant and comprehensive.
Adjusting Sample Size and Selection:
Altering the sample size to ensure it is sufficient for the main study.
Refining the sampling method to improve representativeness and reduce bias.
Refining Research Methods:
Changing the data collection methods if they prove to be ineffective or impractical.
Adopting alternative techniques or tools that may yield better results.
Improving Procedures and Protocols:
Streamlining procedures to reduce time, cost, or complexity.
Developing clearer guidelines and protocols for the research team to follow.
Enhancing Data Analysis Techniques:
Revising the data analysis plan to address any issues identified during the pilot study.
Ensuring that the analysis methods are suitable for the type and volume of data collected.
Addressing Ethical Concerns:
Identifying and mitigating any ethical issues that arose during the pilot study.
Ensuring that participants’ rights and well-being are protected in the main study.
Training and Preparing the Research Team:
Providing additional training to the research team based on the findings of the pilot study.
Ensuring that all team members are adequately prepared for the main study.
Practical Issues
Access to a Sample
Availability of a Sample:
Researchers need to determine whether they have access to a sample that is representative of the target population. Without access to a suitable sample, the research cannot be conducted effectively.
Access might depend on factors such as location, demographic characteristics, and the willingness of individuals to participate.
Gatekeepers:
Definition: Gatekeepers are individuals or organizations that control access to the sample population. They can facilitate or hinder the researcher’s entry into a community or group.
Role: Gatekeepers can help researchers gain access by providing introductions, vouching for the researcher, or granting permission to conduct the study within their domain.
Challenges: Gaining the support of gatekeepers may require negotiation and building trust, and there is a risk that gatekeepers might influence the sample or the data collected.
Personal Characteristics of the Researcher
Fitting in with the Group:
Researchers need to consider whether their personal characteristics (such as age, gender, ethnicity, and social status) will allow them to integrate smoothly with the group being studied.
Compatibility can facilitate rapport-building and encourage open and honest responses from participants.
Impact on Data Collection:
The researcher’s characteristics can influence the dynamics of data collection, potentially affecting participants' willingness to share information.
Researchers must be aware of their own biases and how their presence might shape the data collection process.
Types of Improvements Made After a Pilot Study
Revising Data Collection Instruments:
Modify questions to eliminate ambiguity or bias.
Add or remove questions to ensure they are relevant and comprehensive.
Adjusting Sample Size and Selection:
Alter the sample size to ensure it is sufficient for the main study.
Refine the sampling method to improve representativeness and reduce bias.
Refining Research Methods:
Change data collection methods if they prove ineffective or impractical.
Adopt alternative techniques or tools that may yield better results.
Improving Procedures and Protocols:
Streamline procedures to reduce time, cost, or complexity.
Develop clearer guidelines and protocols for the research team to follow.
Enhancing Data Analysis Techniques:
Revise the data analysis plan to address any issues identified during the pilot study.
Ensure that the analysis methods are suitable for the type and volume of data collected.
Addressing Ethical Concerns:
Identify and mitigate any ethical issues that arose during the pilot study.
Ensure that participants’ rights and well-being are protected in the main study.
Training and Preparing the Research Team:
Provide additional training to the research team based on the findings of the pilot study.
Ensure that all team members are adequately prepared for the main study.
Dangers and Challenges
Access Issues:
Difficulty in gaining access to the sample population can delay or derail the research. Researchers may face resistance or lack of cooperation from potential participants or gatekeepers.
Bias and Influence of Gatekeepers:
Gatekeepers might exert influence over who participates in the study, potentially leading to a biased sample. They may also influence participants' responses, either directly or indirectly.
Researcher’s Characteristics:
Researchers’ personal characteristics may lead to bias in data collection. For example, a researcher might unintentionally influence participants' responses due to perceived authority or social desirability bias.
Ethical Concerns:
Ensuring the ethical treatment of participants is paramount. Issues such as informed consent, confidentiality, and the potential for harm must be carefully managed.
Researchers must be vigilant about avoiding exploitation or harm, especially when working with vulnerable populations.
Practical Constraints:
Time and budget limitations can constrain the research process. Insufficient resources might lead to compromised data quality or incomplete studies.
Researchers need to balance practical constraints with the need for thorough and accurate data collection.
Usefulness of Mixed Methods Approach
Advantages/Benefits of Using More Than One Method in a Study
Comprehensive Understanding:
Mixed methods combine quantitative and qualitative approaches, providing a more complete picture of the research problem. Quantitative methods offer numerical data and statistical analysis, while qualitative methods provide deeper insights into participants' experiences and perspectives.
Triangulation:
Using multiple methods allows for triangulation, which involves cross-verifying data from different sources. This enhances the reliability and validity of the findings by confirming that results are consistent across different methods.
Complementarity:
Different methods can complement each other by addressing different aspects of a research question. For instance, quantitative data can highlight trends and patterns, while qualitative data can explain the reasons behind those trends.
Flexibility:
Mixed methods offer flexibility in data collection and analysis, allowing researchers to adapt their approach based on emerging findings. This can lead to more nuanced and responsive research.
Richness of Data:
The combination of quantitative and qualitative data provides a richer and more detailed dataset. This can lead to more robust and comprehensive conclusions.
Enhanced Credibility:
Using multiple methods can enhance the credibility and persuasiveness of the research. Different stakeholders may find different types of data more convincing, so a mixed methods approach can appeal to a broader audience.
Things to Consider When Using More Than One Method
Integration of Data:
Researchers need to plan how they will integrate quantitative and qualitative data. This involves deciding whether to combine data at the collection, analysis, or interpretation stage.
Consistency in Research Design:
Ensuring consistency in research design is crucial. Researchers must carefully align their methods with their research questions and hypotheses to maintain coherence throughout the study.
Resource Allocation:
Mixed methods research can be resource-intensive in terms of time, funding, and personnel. Researchers need to ensure they have sufficient resources to effectively implement and manage both methods.
Skill Set:
Conducting mixed methods research requires proficiency in both quantitative and qualitative techniques. Researchers need to ensure they have the necessary skills or seek training or collaboration with experts in both areas.
Ethical Considerations:
Researchers must address ethical considerations for both quantitative and qualitative methods, such as informed consent, confidentiality, and data protection. Different methods may have unique ethical challenges that need to be managed.
Data Management:
Managing and organizing data from multiple methods can be complex. Researchers need robust data management plans to handle the different types of data collected.
Examples of Mixed Methods
Eileen Barker - The Making of a Moonie:
Study: Eileen Barker's study on the Unification Church (commonly known as the Moonies) is a classic example of mixed methods research. Barker combined quantitative surveys with qualitative interviews and participant observation.
Methods: She conducted surveys to gather demographic and statistical data about members and their backgrounds. She complemented this with in-depth interviews and participant observation to understand the personal experiences and motivations of members.
Benefits: The mixed methods approach allowed Barker to quantify patterns within the membership while also gaining rich, detailed insights into the conversion process and personal stories of individual members.
Mac an Ghaill - Work with African-Caribbean Boys in Schools:
Study: Mac an Ghaill’s research focused on the educational experiences of African-Caribbean boys in British schools, exploring issues of race, identity, and educational achievement.
Methods: He used quantitative methods to analyze academic performance and statistical data on school achievement. This was complemented by qualitative methods, including interviews and ethnographic observations, to explore the boys' personal experiences, attitudes, and perceptions.
Benefits: The mixed methods approach enabled Mac an Ghaill to correlate statistical trends with the lived experiences of the boys, providing a holistic understanding of how racial identity and school environments impacted their educational outcomes.
Evaluating the Usefulness of Different Research Methods
Reliability
Definition: Reliability refers to the consistency and repeatability of research findings. A reliable method produces the same results under consistent conditions.
Evaluation:
Quantitative Methods: Often considered highly reliable due to the structured nature of data collection and statistical analysis.
Qualitative Methods: Can be less reliable because they are more subjective and dependent on the researcher's interpretation. However, reliability can be enhanced through strategies like triangulation and inter-rater reliability.
Validity
Definition: Validity measures the accuracy and truthfulness of research findings. It indicates whether the research truly measures what it claims to measure.
Evaluation:
Quantitative Methods: Can achieve high internal validity through controlled variables and precise measurements but may struggle with ecological validity (real-world applicability).
Qualitative Methods: Often have high ecological validity because they explore phenomena in natural settings and provide in-depth insights, though they may face challenges with internal validity.
Representativeness
Definition: Representativeness refers to the extent to which a sample reflects the characteristics of the target population.
Evaluation:
Quantitative Methods: Can achieve high representativeness through random sampling and large sample sizes.
Qualitative Methods: Often use smaller, non-random samples, which can limit representativeness but provide rich, detailed data about specific contexts or groups.
Quantitative Data
Definition: Quantitative data are numerical and can be measured and analyzed statistically.
Evaluation:
Strengths: Enables generalization to larger populations, allows for hypothesis testing, and provides clear, objective measurements.
Limitations: May oversimplify complex social phenomena and lack depth in understanding individual experiences.
Qualitative Data
Definition: Qualitative data are non-numerical and provide in-depth insights into social phenomena through methods like interviews, observations, and textual analysis.
Evaluation:
Strengths: Offers rich, detailed understanding of participants’ perspectives and contexts, and is flexible and adaptable to changing research conditions.
Limitations: Can be subjective and harder to generalize, and data analysis can be time-consuming and complex.
Time and Cost
Evaluation:
Quantitative Methods: Often require significant resources for data collection, especially if large samples are needed. However, data analysis can be more efficient with statistical software.
Qualitative Methods: Generally less costly in terms of equipment but can be time-consuming due to the need for prolonged engagement in the field and intensive data analysis.
Ethical Issues
Evaluation:
Quantitative Methods: Ethical concerns include ensuring informed consent, protecting confidentiality, and avoiding harm. Surveys and experiments must be designed to minimize any potential negative impact on participants.
Qualitative Methods: Ethical issues are paramount due to the close interaction with participants. Researchers must navigate informed consent, confidentiality, and the potential for emotional or psychological harm with sensitivity and care.
Practical Issues
Availability of a Sample:
Quantitative Methods: Often require large, representative samples which can be challenging to obtain. Researchers need access to comprehensive sampling frames.
Qualitative Methods: May focus on smaller, more specific groups which can be easier to access but may still require careful consideration of sample availability.
Gatekeepers:
Role: Gatekeepers can facilitate or hinder access to the sample population. They are critical in contexts where the researcher needs permission to interact with the target group.
Challenges: Researchers must build trust and negotiate access while ensuring that gatekeepers do not unduly influence the research process or findings.
Interpreting Data in Sociological Enquiry
Importance of Data Interpretation
Interpreting data is a crucial skill in sociological research. It involves analyzing and making sense of the data collected to discern patterns, trends, and relationships that inform sociological theories and understandings. Effective data interpretation allows sociologists to draw meaningful conclusions and make evidence-based recommendations.
Types of Data Representations
Graphs:
Line Graphs: Useful for showing changes over time. Each point on the graph represents a data value at a specific time, and the lines connecting the points indicate trends
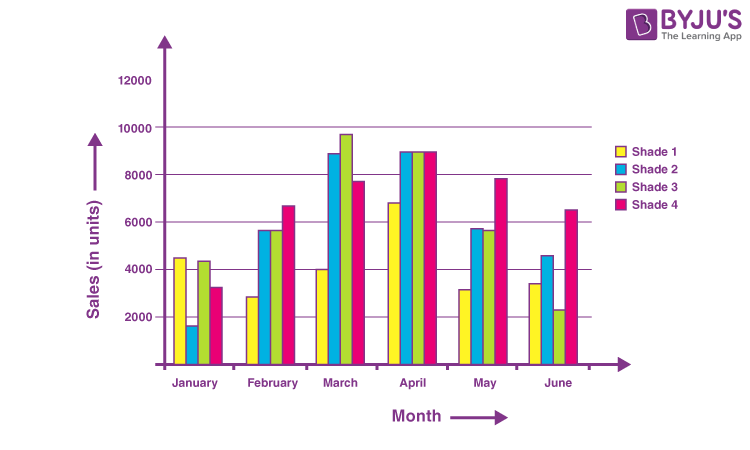
Bar Graphs: Effective for comparing different groups or categories. Each bar represents a category, and the height or length of the bar indicates the value.
Pie Charts: Ideal for showing proportions and percentages. Each slice of the pie represents a category, and the size of the slice reflects its proportion relative to the whole.
Diagrams:


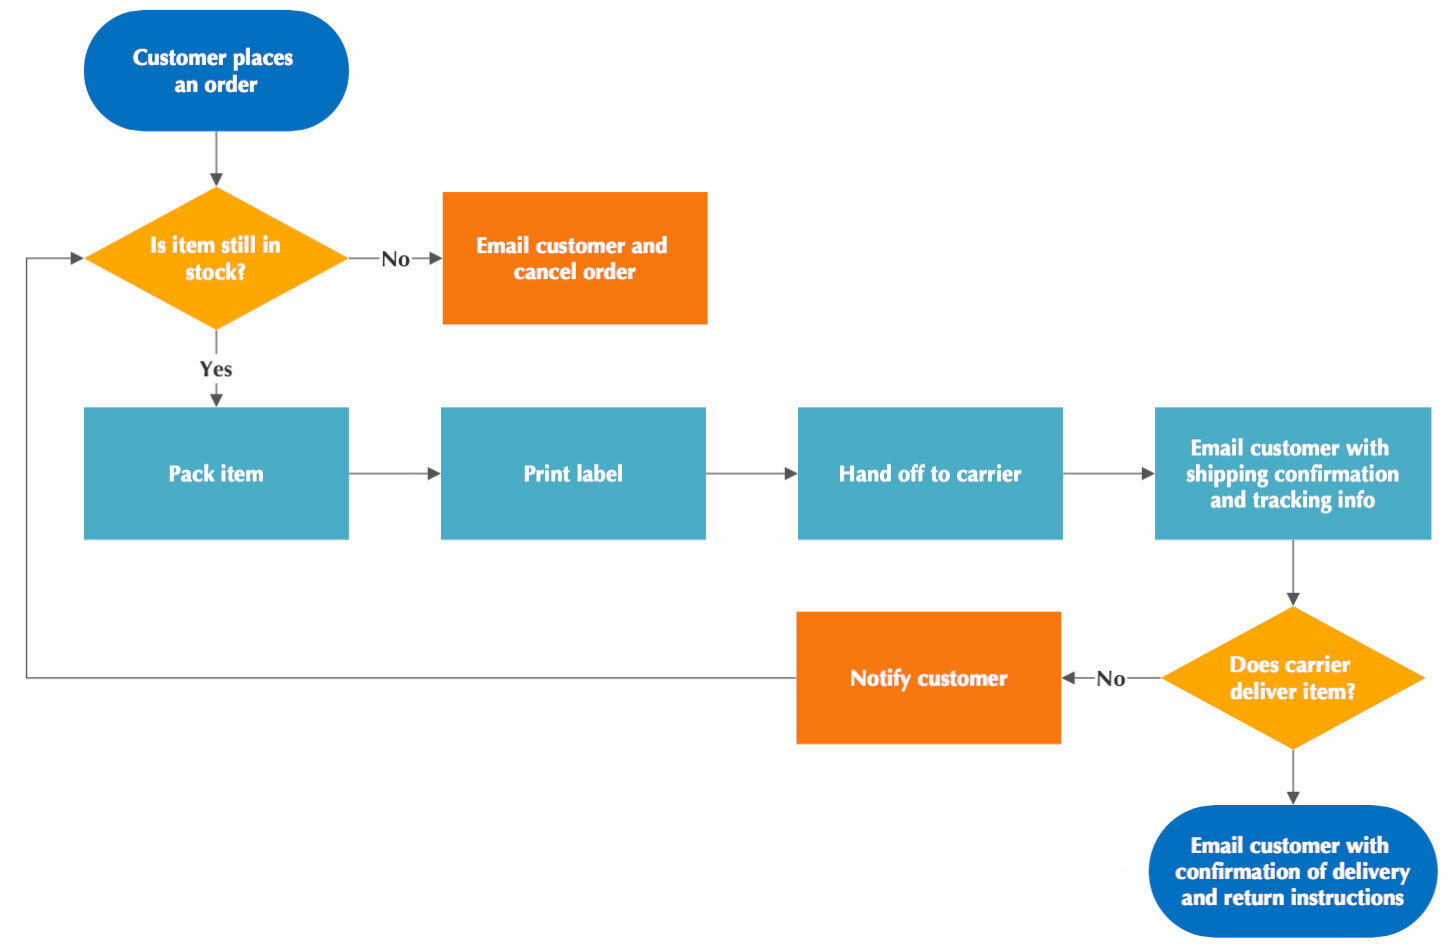
Flow Diagrams: Used to illustrate processes or sequences of events. Arrows indicate the direction of flow, helping to visualize steps or stages in a process.
Venn Diagrams: Useful for showing relationships and overlaps between different sets or groups. Each circle represents a set, and overlapping areas show commonalities.

Charts:
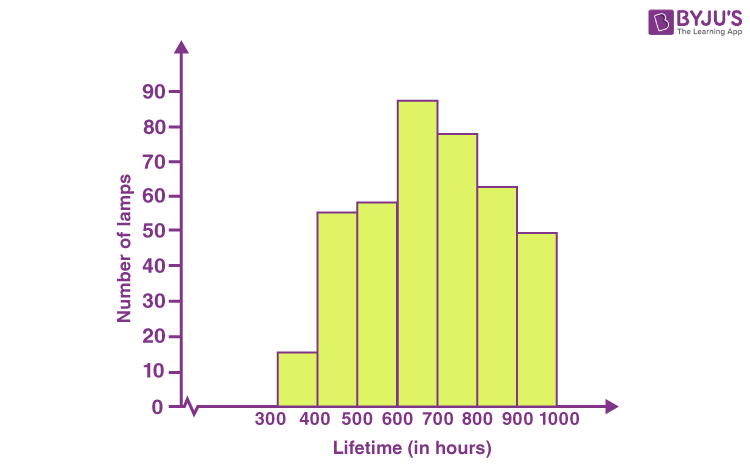
Histograms: Similar to bar graphs but used for continuous data divided into intervals. Each bar represents the frequency of data within an interval.
Scatter Plots: Display the relationship between two variables. Each point on the plot represents an observation, and the pattern of points indicates the nature of the relationship (e.g., positive, negative, or no correlation).

Tables:
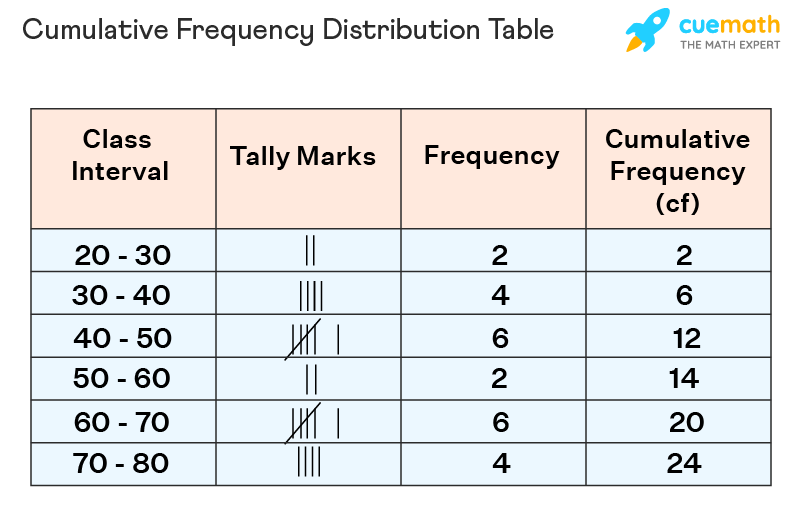
Frequency Tables: List data values and their corresponding frequencies, showing how often each value occurs.
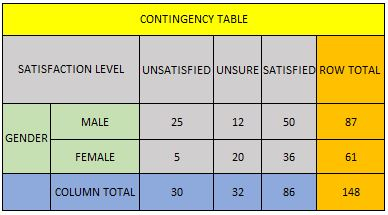
Cross-tabulation Tables: Show the relationship between two or more variables by displaying the frequencies of their combinations in a matrix format.
Steps for Interpreting Data
Understand the Data Representation:
Identify the type of graph, chart, diagram, or table being used.
Familiarize yourself with the axes, labels, legends, and scales.
Identify Key Elements:
Look for titles, headings, and labels that provide context for the data.
Note any units of measurement, time periods, or categories.
Discern Patterns and Trends:
Trends: Observe general directions in the data (e.g., increasing, decreasing, stable).
Patterns: Identify recurring shapes or arrangements in the data points (e.g., cyclical patterns, clusters).
Compare and Contrast:
Examine differences and similarities between groups, categories, or time periods.
Highlight significant variations or anomalies in the data.
Analyze Relationships:
Look for correlations between variables in scatter plots or cross-tabulation tables.
Consider potential causations or factors that might explain observed relationships.
Draw Conclusions:
Summarize the key findings from the data interpretation.
Relate the findings to the research question or hypothesis.
Practical Tips
Practice Regularly:
Regular practice with different types of data representations enhances your interpretation skills. Use practice exercises and real-world examples to build confidence.
Use Visual Aids:
Highlight or annotate key elements in graphs, charts, and tables to make patterns and trends more apparent.
Create your own visual aids to summarize findings.
Check for Consistency:
Verify that the data interpretations are consistent with the data provided. Cross-check values and calculations to ensure accuracy.
Stay Objective:
Avoid making assumptions or drawing conclusions without sufficient evidence. Let the data guide your interpretations.
Seek Feedback:
Share your interpretations with peers or instructors to gain different perspectives and improve your analytical skills.
Classic Studies in Sociological Enquiry
Understanding classic sociological studies is crucial for grasping the foundations of sociological theory and research methods. Here are detailed notes on some landmark studies in sociology:
The Census
Definition: A census is a systematic collection of data about a population, typically conducted by governments at regular intervals (e.g., every 10 years).
Purpose: To gather comprehensive demographic, social, and economic information about a population.
Usefulness:
Policy Making: Provides data for planning and implementing government policies.
Resource Allocation: Informs the distribution of resources and services.
Social Research: Offers a vast dataset for sociological analysis on trends and patterns.
Example: The United States Census, conducted every ten years, collects data on age, gender, race, housing, income, and more, influencing decisions from congressional representation to funding for schools and infrastructure.
Paul Willis - Learning to Labour
Study: "Learning to Labour: How Working Class Kids Get Working Class Jobs" (1977).
Method: Ethnography and participant observation.
Focus: Examines how working-class boys in England accept and perpetuate their position in the class structure.
Key Findings:
Counter-School Culture: The boys develop a counter-school culture that opposes the values of the school.
Class Reproduction: This culture leads them to reject academic success, ultimately reproducing their working-class status.
Significance: Highlights the role of cultural and social factors in the reproduction of social class and challenges the notion that schools are meritocratic.
William H. Whyte - Street Corner Society
Study: "Street Corner Society: The Social Structure of an Italian Slum" (1943).
Method: Participant observation in an Italian-American neighborhood in Boston.
Focus: Examines the social organization of street gangs and social networks.
Key Findings:
Social Hierarchies: Gangs have their own social hierarchies and roles, functioning like small societies.
Community Dynamics: Social ties and loyalties are crucial for understanding behavior and social interactions.
Significance: Demonstrated the importance of qualitative methods in sociology and provided a detailed picture of urban social life.
Pat Carlen - Women, Crime and Poverty
Study: "Women, Crime and Poverty" (1988).
Method: Interviews and case studies of female offenders in the UK.
Focus: Explores the relationship between women’s criminal behavior and their socio-economic circumstances.
Key Findings:
Social Marginalization: Poverty and social marginalization are significant factors driving women into crime.
Pathways to Crime: Women’s pathways to crime differ from men’s, often involving survival strategies rather than aggressive acts.
Significance: Challenged traditional criminological theories that ignored the socio-economic context of female criminality and highlighted the need for gender-sensitive approaches in criminology.
David Hargreaves - Labeling in "Deviance in Classrooms"
Study: "Deviance in Classrooms" (1975).
Method: Ethnographic study in secondary schools.
Focus: Examines how teachers' perceptions and labels affect students' behavior and educational outcomes.
Key Findings:
Labeling Theory: Teachers’ labels (e.g., "troublemaker," "bright student") significantly influence students' self-concepts and behaviors.
Self-Fulfilling Prophecy: Negative labels can lead to a self-fulfilling prophecy where students internalize the label and act accordingly.
Significance: Provided empirical support for labeling theory and highlighted the impact of teacher expectations on student achievement.
Dobash and Dobash - Violence Against Wives
Study: "Violence Against Wives: A Case Against the Patriarchy" (1979).
Method: Interviews with battered women and analysis of historical and legal documents.
Focus: Investigates domestic violence against women within the context of patriarchal social structures.
Key Findings:
Patriarchal Control: Domestic violence is a manifestation of patriarchal control and power over women.
Cycle of Violence: Identified patterns and cycles in abusive relationships, emphasizing the systemic nature of domestic violence.
Significance: Influenced the development of feminist theories on domestic violence and advocacy for legal and social reforms to protect women.