Chapter 2 (2.1): Atomic Theory and Electromagnetic Radiation
Today’s Topic: 2.1 Overview of Atomic Theory and Its Historical Development
Review the fundamental concepts of atomic structure, including atomic models and the evolution of atomic theory over time. In addition, students should prepare to discuss key figures such as Dalton, Thomson, Rutherford, and Bohr, and how their contributions shaped our current understanding of the atom.
Chapter 2: Atomic Theory
A History of the Atom: Theories and Models
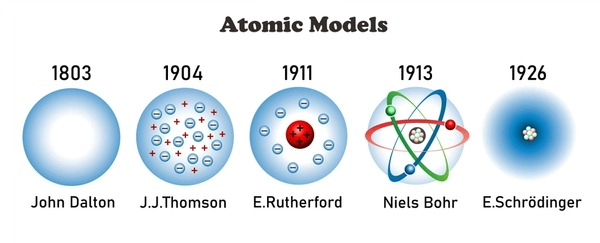
Major atomic models displayed: Solid Sphere Model, Plum Pudding Model, Nuclear Model, Planetary Model, Quantum Model
Timeline highlights (as depicted on the slide):
1803: John Dalton’s ideas (Atom as indivisible, atoms of a given element identical, compounds as combinations of atoms)
1904: J.J. Thomson’s work (electrons discovered; proposed Plum Pudding model; no nucleus in this model)
1911: Ernest Rutherford’s gold foil experiment (nucleus discovered; atom mostly empty space; positive charge concentrated in the nucleus)
1913: Niels Bohr’s model (electrons move in fixed orbits around the nucleus; energy levels are quantized)
1926: Erwin Schrödinger’s quantum model (electrons as waves, probability clouds/orbitals; exact location uncertain; position described by probability distributions)
Dalton’s Theory (as originally stated):
Atoms are indivisible
Atoms of a given element are identical
Compounds are combinations of different types of atoms
Key takeaways from models:
Plum Pudding model (Thomson): electrons embedded in a positively charged sphere; no defined nucleus
Rutherford’s Nuclear Model: nucleus exists; electrons orbit in empty space; could not explain electron stability or spectral lines fully
Bohr Model: quantized orbits explain some emission spectra but fails for heavier atoms
Schrödinger/Quantum Model: electrons described by orbitals (regions of probability) rather than fixed paths; current consensus
Electromagnetic Waves and Light–Matter Interaction
Electromagnetic Waves: relationship among wavelength (λ), frequency (ν), and speed of light (c)
Core relation:
Inverse relationship: longer wavelength implies lower frequency; shorter wavelength implies higher frequencyTypical values: speed of light
Photons and Planck’s Constant
Light can behave as both a wave and particles (photons)
Photon energy:
Planck’s constant:
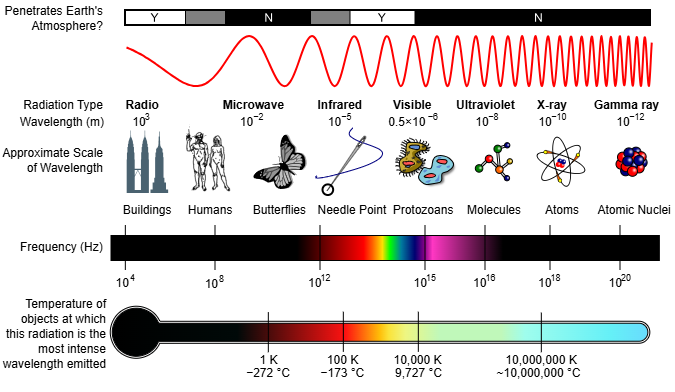
The Electromagnetic Spectrum
Range from gamma rays to radio waves; as energy increases with frequency, gamma rays have the highest energy and radio waves the lowest
Visible spectrum: approximately
Energy relationship: (since and )
Common regions (order by increasing wavelength): Gamma rays, X-rays, Ultraviolet, Visible, Infrared, Microwaves, Radio
Light–Matter Interactions and Photons
When matter interacts with light, atoms/molecules absorb or emit whole photons, leading to discrete energy changes
Example visual cue on page: presence of 11-cis-Retinal as a biological example of photon-induced energy change related to vision
Relative energy chart (Page 19) – key takeaways
Relative energy increases with frequency (shorter wavelength)
Gamma rays > X-rays > Ultraviolet > Visible > Infrared > Microwaves > Radio
Common light sources and their relative energies (daylight, incandescent, fluorescent, halogen, cool white LED) illustrate how material emission and illumination relate to energy output
Hydrogen Spectra and the Balmer Series (Visible Light) / Spectral Clues to Atomic Structure
Hydrogen spectra (Page 20)
Emission spectra from Sun vs Hydrogen spark or discharge
Visible spectrum depicted with emission lines for hydrogen between roughly 400–700 nm
Emission spectrum of hydrogen provides discrete lines; sunlight shows many lines across the spectrum

Light and Atomic Models (Balmer Series reference)
Analysis of emission spectra provided clues to atomic structure
When a photon is absorbed by a system, its energy increases (transition to a higher energy state)
When a system emits a photon, its energy decreases (transition to a lower energy state)
Concept of Balmer Series referenced as the visible emission lines of hydrogen (part of the Lyman, Balmer, Paschen series families depending on transitions to different levels)
White light and spectral lines
White light comprises a continuum spectrum, while specific atomic emissions produce discrete lines (e.g., Balmer series for hydrogen in the visible region)
Quick Reference: Key Equations and Concepts Revisited
Speed of light and basic relationships
Photon energy and Planck’s constant
Atomic models and their essence
Solid Sphere (Dalton): atoms indivisible; identical for a given element
Plum Pudding (Thomson): electrons embedded in a positively charged sphere; no defined nucleus
Nuclear (Rutherford): nucleus exists; atom mostly empty space
Planetary (Bohr): electrons in fixed, quantized orbits around nucleus
Quantum (Schrödinger): electrons as probability clouds/orbitals; position uncertain
Spectral clues to structure
Emission/absorption of photons leads to energy changes in atoms
Spectral lines (e.g., Balmer series) reveal energy-level spacings and atomic structure
Notes and Practical Takeaways
The session covers the transition from classical atomic models to quantum mechanical description of the atom, underpinning modern chemistry explanations for bonding, spectra, and chemical reactivity.
Be comfortable with the core equations and what they imply about light-matter interactions:
Energy levels are quantized; photons carry discrete energy amounts; spectral lines arise from transitions between levels
The visible spectrum is just a small portion of the EM spectrum; many phenomena involve UV, IR, X-ray, and beyond
Practical exam cues:
You may be asked to identify relationships (e.g., increasing frequency implies increasing energy per photon, or conversely, decreasing wavelength yields higher energy)
Be able to relate spectral lines to energy-level transitions (e.g., Balmer series corresponds to transitions to n=2 in hydrogen)
Understand the historical development of atomic theory to explain why modern models moved from definite orbits to orbitals with probability densities