PROBABILITY
Random Processes
Random
The word random suggests an unpredictable result or outcome.
Simulation
A technique for re-creating a random event
Simulations can be tactile or virtual
Tactile = physically flipping a coin
Virtual = using a computer to pretend it is flipping a coin
The simulation’s goal = to measure how often a certain outcome (such as a head in coin flipping) is observed.
Example
To see this idea, suppose we flip a coin 100 times and compute the proportion of heads observed after each toss of the coin.
The 1st flip is tails, so the proportion of heads is
The 2nd flip is heads, so the proportion of heads is
The third flip is heads, so the proportion of heads is
and so on
Plot the proportion of heads versus the number of flips and obtain the graph in Figure (a). We repeat this experiment with the results shown in Figure (b).
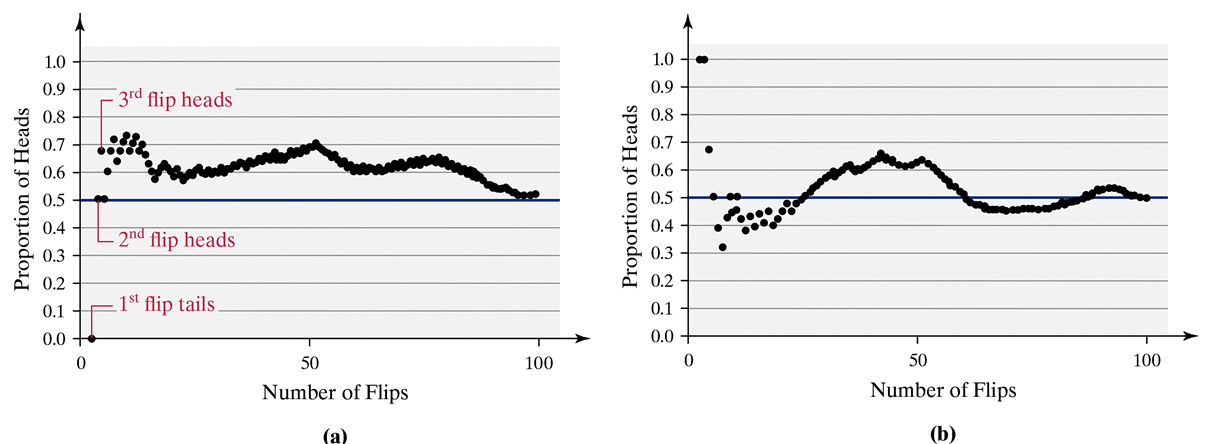
Random Process
The graphs in Figures (a) and (b) illustrate a random process.
Random process: scenarios where you can't predict the result of a single experiment, but if you repeat the experiment many times, the proportion of times a certain result occurs will settle around a specific value.
Probability
A measure of the likelihood of a random phenomenon or chance behavior occurring
Probability deals with experiments that yield random short-term results or outcomes yet reveal long-term predictability.
The long-term proportion in which a certain outcome is observed is the probability of that outcome.
Experiments
Any process that can be repeated in which the results are uncertain.
Sample Space
The collection of all possible outcomes
Sample Space Notation = S
Event
Any collection of outcomes from a probability experiment. An event may consist of one outcome or more than one outcome.
We will denote events with one outcome, sometimes called simple event, e!. Usually, events are denoted using capital letters such as E.
Example
Identifying Events and the Sample Space of a Probability Experiment
A probability experiment consists of rolling a single fair die.
Fair Die = six sides with different numbers
Identify the outcomes of the probability experiment.
There is more than one outcome when rolling a fair dice

Determine the sample space.
The set of all possible outcomes forms the sample space
There are 6 outcomes in the sample space
Define the event E = “roll an even number.”
The event E = “roll an even number” =
Conclusion
A fair die is one where every number (1 to 6) has the same chance of being rolled. For example, rolling a 2 is just as likely as rolling a 5.
A loaded die is different because some numbers are more likely to be rolled than others. For instance, if rolling a 1 happens more often than rolling a 2, 3, 4, 5, or 6, the die is loaded.
The Law of Large Numbers
As the number of repetitions of a probability experiment increases, the proportion with which a certain outcome is observed gets closer to the probability of the outcome.
The Law of Large Numbers is often interpreted as a nonexistent law called the Law of Averages by folks who misunderstand the Law of Large Numbers.
Simple Terms: if you repeat an experiment many times, the average result will eventually be very close to the expected/true value.
Probability Diagrams
Probability diagrams are visual tools used to represent and analyze the likelihood of different outcomes and events. They simplify complex probability problems and make understanding relationships between different events easier. There are different types.
Type of Probability Diagrams
Tables
Used to display the frequency of different outcomes in a two-way classification.
They help in organizing data and calculating probabilities.
Example: A survey of students' favorite subjects is conducted, and the results are recorded in a table:
Math | Science | English | Total | |
Boys | 10 | 15 | 5 | 30 |
Girls | 5 | 10 | 15 | 30 |
Total | 15 | 25 | 20 | 60 |
Tree Diagrams
Used to represent the outcomes of a sequence of events.
They help in visualizing the probabilities of combined events.
Example:
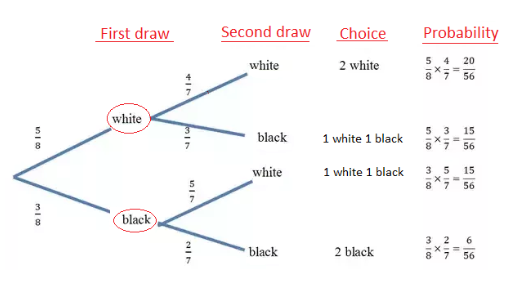
Each branch represents a possible outcome and its associated probability.
Venn Diagrams
Use overlapping circles to represent sets and their relationships.
They help in visualizing unions, intersections, and complements of events.
Useful for problems involving multiple events and their combinations.
Example: In a school of 100 students, a survey was conducted to find out how many students study Math and how many study Science. The results are as follows:
60 students study Math.
20 students study Science.
20 students study both Math and Science.
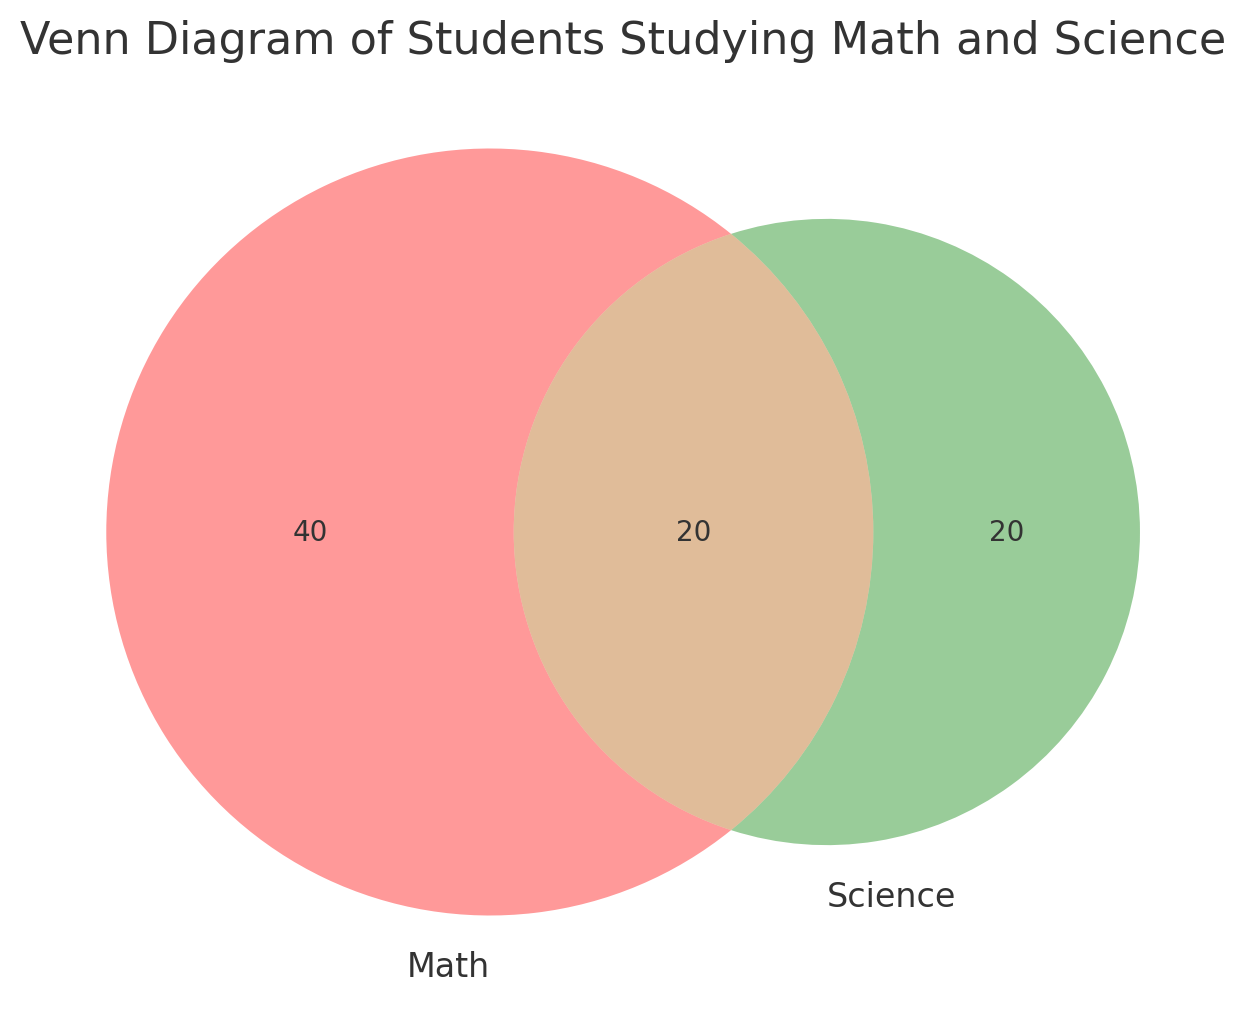
Using this diagram, you can figure out different relationships/situations
How many students study only Math? → 60 – 20 = 40
Students not studying either Math or Science → 100 students – 80 surveyed = 20 students not studying