IB Exam (Unit 4: Ecology)
4.1 Species, Communities and Ecosystems
Understanding
U1 Species are groups of organisms that can potentially interbreed to produce fertile offspring.
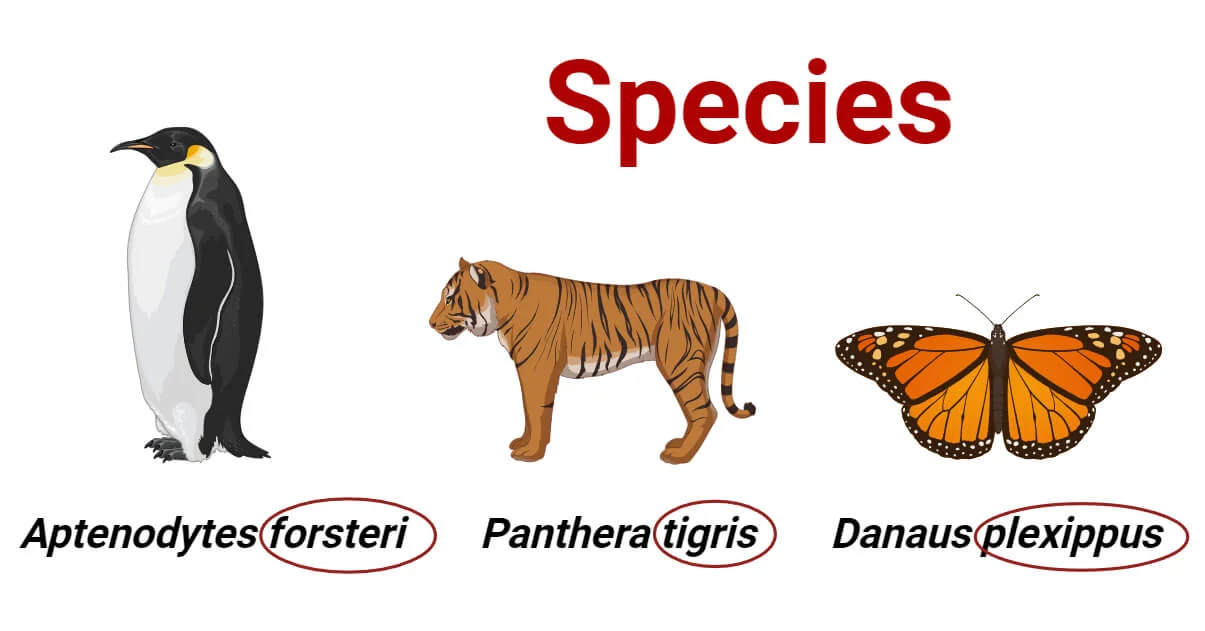
U2 Members of a species may be reproductively isolated in separate populations.
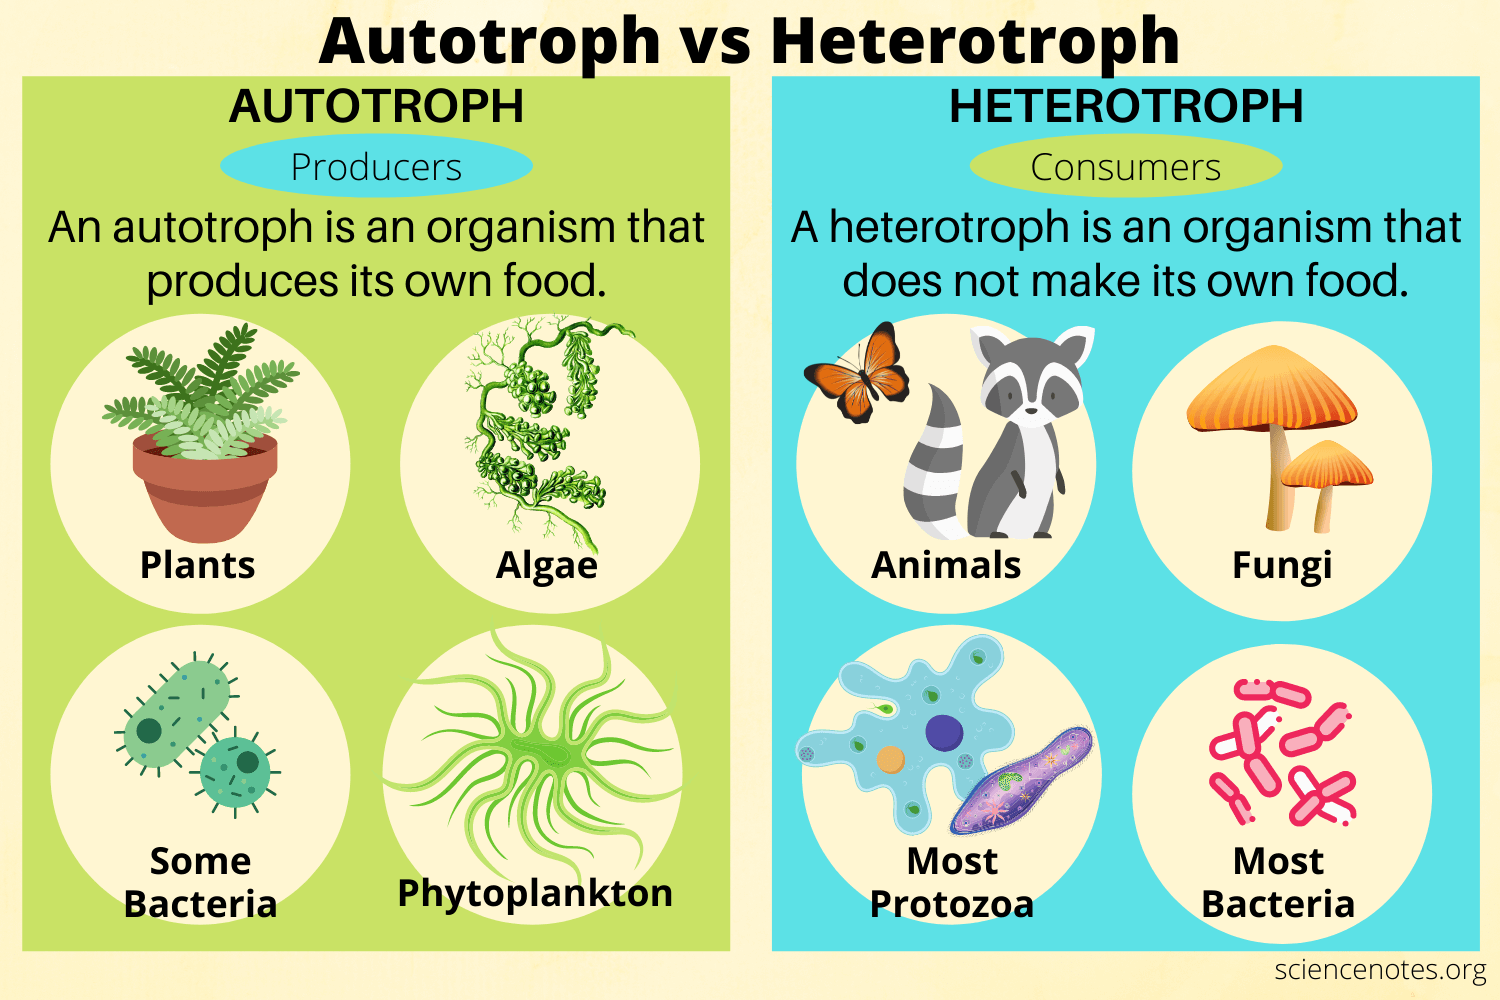
U3 Species have either an autotrophic or heterotrophic method of nutrition (a few species have both methods).
U4 Consumers are heterotrophs that feed on living organisms by ingestion.
U5 Detrivores are heterotrophs that obtain organic nutrients from detritus by internal digestion.
U6 Saprotrophs are heterotrophs that obtain organic nutrients from dead organisms by external digestion.
Consumers | Detritivores | Saprotrophs |
|---|---|---|
an organism that ingests other organic matter that is living or recently killed | an organism that ingests non-living organic matter | an organism that lives on or in non- living organic matter, secreting digestive enzymes into it and absorbing the products of digestion. |
U7 A community is formed by populations of different species living together and interacting with each other.
U8 A community forms an ecosystem by its interactions with the abiotic environment.
U9 Autotrophs obtain inorganic nutrients from the abiotic environment.
U10 The supply of inorganic nutrients is maintained by nutrient recycling.
U11 Ecosystems have the potential to be sustainable over long periods of time.
Skills*
S1 Classifying species as autotrophs, consumers, detrivores or saprotrophs from a knowledge of their mode of nutrition.
Autotrophs | Consumers | Detritivores | Saprotrophs |
|---|---|---|---|
an organism that synthesizes its organic molecules from simple inorganic substances | an organism that ingests other organic matter that is living or recently killed
| an organism that ingests non-living organic matter think:
| an organism that lives on or in non-living organic matter, secreting digestive enzymes into it and absorbing the products of digestion. think:
|
S2 Setting up sealed mecocosms to try to establish sustainability. (Practical 5)
S3: Testing for association between two species using the chi-squared test with data obtained from quadrat sampling.
If the presence or absence of two species is recorded in a large number of quadrats, a chi-squared test fo association between the species can be performed.
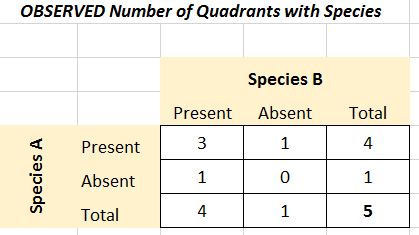
Example: the presence or absence of two seaweeds was recorded in fifty 1m. quadrats on a rocky sea shore at Musselwick on the Atlantic coast of Wales.
The contingency table below shows the results:
Name of Species | Fucus Vesiculosus | Fucus Vesiculosus | Fucus Vesiculosus |
Fucus serratus | number of quadrats | Present | Absent |
|---|---|---|---|
Fucus serratus | Present | 6 (10.9) | 15 (10.01 |
Fucus serratus | Absent | 20 (15.1) | 9 (13.9) |
Expected results assuming no association are shown in brackets. They are calculated using this equation:
E.F. = (row total *column total)/grand total
To calculate chi-squared (x²), this equation is used:
x² = sum of [(observed frequencies - expected frequencies)/expected frequencies]
x² = 2.20 + 2.37 + 1.59 + 1.73 = 7.89
The calculated value ofchi-squared (7.89) is compared with the critical region. This is found from a table of chi-squared values. 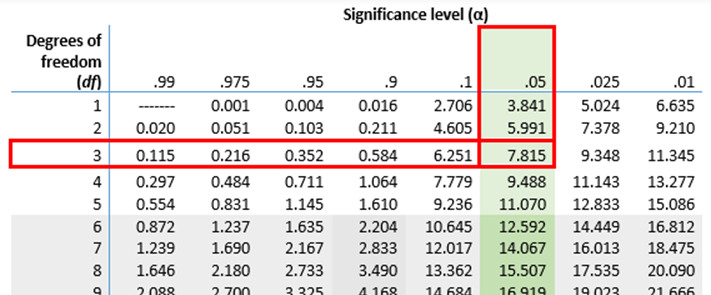 The number of degrees of freedom must be known and also the signifcance level, which is usually 5%. The number of degrees of freedom is calculated using this equation: degrees of freedom = (m - 1)(n - 1) , where m and n are the number of rows and number of columns in the contingency table. In this example, there is one degree of freedom.
The critical value for chi-squared with one degree of freedom and a significance level of 5% is 3.84, giving a critical region off x² > 3.84. The calculated value for x² is 7.89, which is within the critical region. There is therefore evidence at the 5% level for a significant difference between the actual and expected results. The results in the contingency table show that the two species of algae tend not to occur together in the same quadrats. This is because Fucus serratus mostly grows in a zone towards the bottom of the beach and F. vesiculosus in a zone further up the beach.
S4 Recognizing and interpreting statistical significance.
Nature of Science
4.2 Energy Flow
Understanding
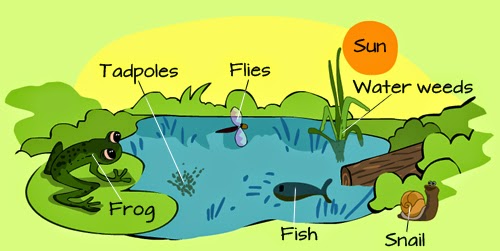
U1 Most ecosystems rely on a supply of energy from sunlight.
U2 Light energy is converted to chemical energy in carbon compounds by photosynthesis.
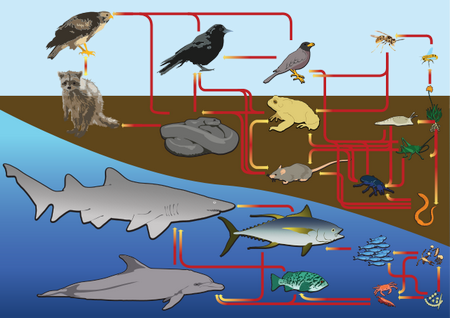
U3 Chemical energy in carbon compounds flows through food chains by means of feeding.
U4 Energy released from carbon compounds by respiration is used in living organisms and converted to heat.
U5 Living organisms cannot convert heat to other forms of energy.
U6 Heat is lost from ecosystems.
U7 Energy losses between trophic levels restrict the length of food chains and the biomass of higher trophic levels.
Skills
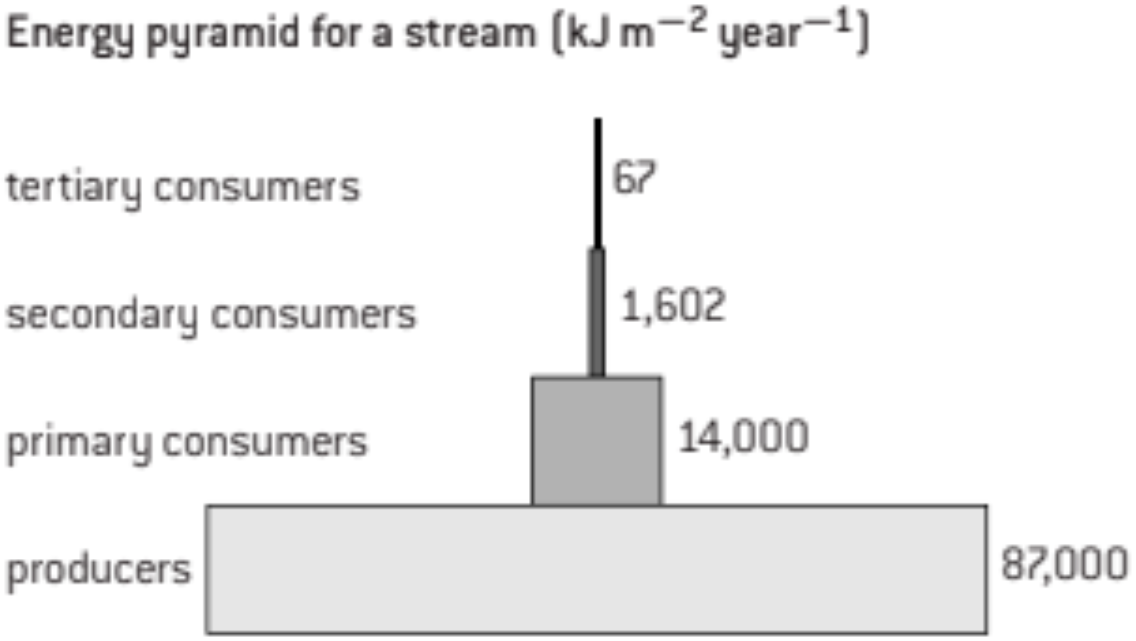
S1: Quantitative representations of energy flow using pyramids of energy.
A pyramid of energy is a type of bar chart with horizontal bars arranged symmetrically. The bars should all be drawn to scale. Triangular pyramids of biomass are not appropriate as they do not show the amounts of energy for the trophic levels accurately. Labels should indicate the trophic levels with producers at the base, then primary consumers, secondary consumers and so on. It is helpful to put the energy values alongside each bar on the pyramid.
Nature of Science
Use theories to explain natural phenomena- the concepts of energy flow explains the limited length of food chains.
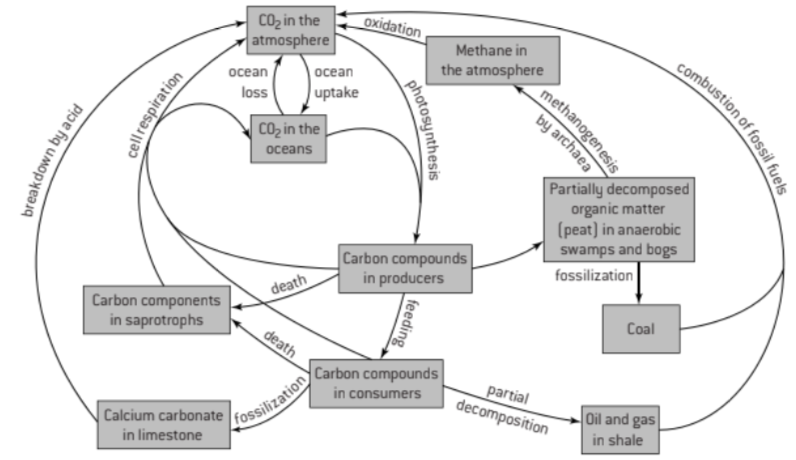
4.3 Carbon Cycling
Understanding
U1 Autotrophs convert carbon dioxide into carbohydrates and other carbon compounds.
U2 In aquatic ecosystems, carbon is present as dissolved carbon dioxide and hydrogen carbonate ions
U3 Carbon dioxide diffuses from the atmosphere or water into autotrophs.
U4 Carbon dioxide is produced by respiration and diffuses out of organisms into water or the atmosphere
U5 Methane is produced from organic matter in anaerobic conditions by methanogenic archaeans and some diffuses into the atmosphere or accumulates in the ground.
U6 Methane is oxidized to carbon dioxide and water in the atmosphere.

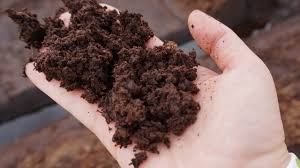
U7 Peat forms when organic matter is not fully decomposed because of acidic and/or anaerobic conditions in waterlogged soils.
U8 Partially decomposed organic matter from past geological eras was converted either into coal or into oil and gases that accumulate in porous rocks.
U9 Carbon dioxide is produced by combustion of biomass and fossilized organic matter.
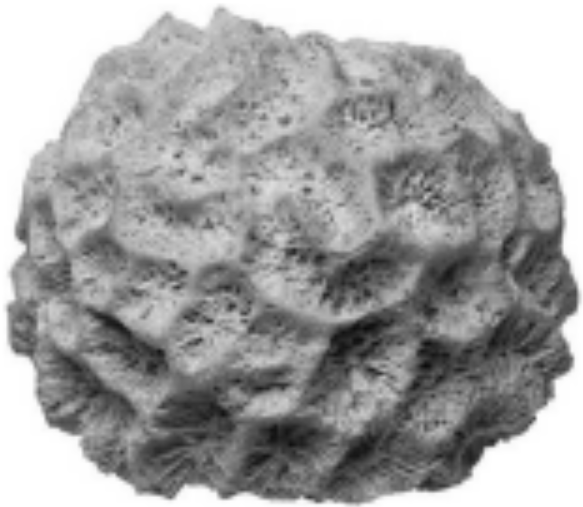
U10 Animals such as reef-building corals and Mollusca have hard parts that are composed of calcium carbonate and can become fossilized in limestone.
Skills
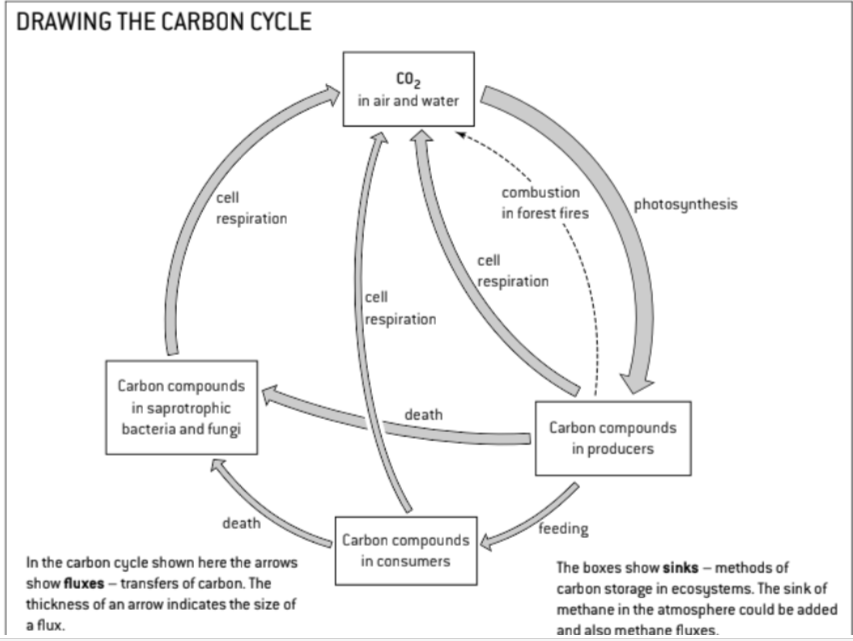
S1: Construct a diagram of the carbon cycle.

Nature of Science
Making accurate, quantitative measurements-it is important to obtain reliable data on the concentrations of carbon dioxide and methane in the atmosphere.
4.4 Climate Change
Understanding
U1+2 Carbon Dioxide and Water Vapor are the most significant greenhouse gases
Other gases including methane and nitrogen oxides have less impact
U3 The impact of a gas depends on its ability to absorb long wave radiation as well as on its concentration in the atmosphere
U4 The warmed Earth emits longer wavelength radiation (heat)
U5 Longer wave radiation is absorbed by greenhouse gases that retain the heat in the atmosphere.
U6 Global temperatures and climate patterns are influenced by concentrations of greenhouse gases.
U7 There is a correlation between rising atmospheric concentrations of carbon dioxide since the start of the industrial revolution 200 years ago and average global temperatures.
U8 Recent increases in atmospheric carbon dioxide are largely due to increases in the
Application
A1: Threats to coral reefs from increasing concentrations of dissolved carbon dioxide.
A lot of CO2 has been absorbed into the ocean
pH dropped from 8.25 → 8.14
This seemingly small change represents a 30% acidification
ocean acidification = CO2 concentration
corals need carbonate ions (CO3) for calcium carbonate (CaCO₃) for their skeletons
dissolved CO2 in water→ carbonic acid
removes H+ and turns CO3 → H2CO3
low CO3 = low CaCO3
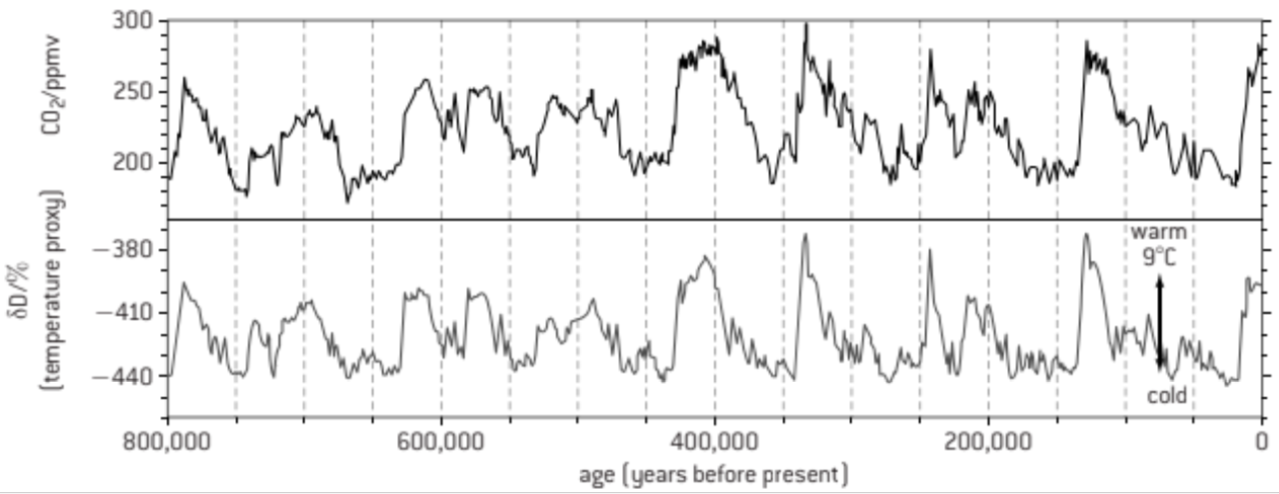
A2: Correlations between global temperatures and carbon dioxide concentrations on Earth.
ice appears in chronological order - ice close to surface = more recent
bubbles in ice can be used to calculate CO2 concentration
temps are found via hydrogen isotopes in water
when data is plotted, there is a strong correlation between CO2 concentration and global temperature
correlation does not equal causation
data proves that CO2 is a greenhouse gas
therefore CO2 must have had some effect on temperature
A3: Evaluating claims that human activities are not causing climate change.
Things to consider:
If the greenhouse effect didn’t exist, the mean Earth temp. would be 30oC
CO2, methane and nitrous oxides are all greenhouse gases
human produce these gases in various ways
greenhouse gases trap heat
Earth’s mean temp has increased significantly in the past 200 years
Nature of Science
Making accurate, quantitative measurements-it is important to obtain reliable data on the concentrations of carbon dioxide and methane in the atmosphere.
4.4 Climate Change
Understanding
U1+2 Carbon Dioxide and Water Vapor are the most significant greenhouse gases
Other gases including methane and nitrogen oxides have less impact
U3 The impact of a gas depends on its ability to absorb long wave radiation as well as on its concentration in the atmosphere
U4 The warmed Earth emits longer wavelength radiation (heat)
U5 Longer wave radiation is absorbed by greenhouse gases that retain the heat in the atmosphere.
U6 Global temperatures and climate patterns are influenced by concentrations of greenhouse gases.
U7 There is a correlation between rising atmospheric concentrations of carbon dioxide since the start of the industrial revolution 200 years ago and average global temperatures.
U8 Recent increases in atmospheric carbon dioxide are largely due to increases in the
Application
A1: Threats to coral reefs from increasing concentrations of dissolved carbon dioxide.
A lot of CO2 has been absorbed into the ocean
pH dropped from 8.25 → 8.14
This seemingly small change represents a 30% acidification
ocean acidification = CO2 concentration
corals need carbonate ions (CO3) for calcium carbonate (CaCO₃) for their skeletons
dissolved CO2 in water→ carbonic acid
removes H+ and turns CO3 → H2CO3
low CO3 = low CaCO3
A2: Correlations between global temperatures and carbon dioxide concentrations on Earth.
ice appears in chronological order - ice close to surface = more recent
bubbles in ice can be used to calculate CO2 concentration
temps are found via hydrogen isotopes in water
when data is plotted, there is a strong correlation between CO2 concentration and global temperature
correlation does not equal causation
data proves that CO2 is a greenhouse gas
therefore CO2 must have had some effect on temperature
A3: Evaluating claims that human activities are not causing climate change.
Things to consider:
If the greenhouse effect didn’t exist, the mean Earth temp. would be 30oC
CO2, methane and nitrous oxides are all greenhouse gases
human produce these gases in various ways
greenhouse gases trap heat
Earth’s mean temp has increased significantly in the past 200 years