PRACTICAL SKILLS (PHYSICS)
1. Writing Hypotheses
Writing Hypotheses
In the practical exam you may be required to create a hypothesis and to obtain results from a given experiment method.
Scientists use hypotheses to explain things that they observe. Hypotheses can be tested to confirm whether or not a variable has an effect on another variable, and what the relationship is between the variables.
A hypothesis in practical work is a prediction that is supported with an explanation. The explanation might use previous knowledge or scientific evidence.
You may have to suggest a testable hypothesis for your practical assessment. These are three examples of predictions for stretching a spring. A is a simple prediction, B is slightly more detailed, and C is a very detailed prediction.
Predictions
There is a link between the length of a spring and the amount of weight put on it.
I think that if I add more weight to the spring it will get longer and its extension and weight might be proportional to each other.
I think if I double the weight in the spring, the extension will also double. The extension of the spring and the weight might be directly proportional to each other.
Explanation
I think this because I’ve used newton meters that have springs inside, and they get longer when I add weights. The newton meters have scales written on the side for measuring force and the scale lines are equally spaced for multiples of the same amount of weight added.
This prediction can be tested in the lab.
Variables
All practical predictions imply some sort of relationship between an independent variable, and a dependent variable.
To make sure that the effect of changing only one variable on the dependent variable is investigated, other variables are kept the same. They are the control variables.
2. Taking and Recording Measurements
Taking and Recording Measurements
You will need to create a table for recording your results.
Usually the independent variable (the force in this investigation) is written down in the left hand side column.
The table needs to have full headings with correct units.
Unless you are told that repeating results isn’t necessary, the table should show a certain number of repeats and include a column for a mean calculation.
The measured results should all be written in the table to the same number of decimal places that match the precision of the measuring instrument. Digital ammeters, voltmeters and stop clocks usually read to the nearest 0.01 of a second, therefore you must record the full reading of the instrument, e.g. 1.32 s, not 1.3 s or 1 s.
The table should contain enough values of the independent variable to allow the original prediction to be tested.
You should try to use the greatest range possible without damaging the apparatus (for example, don’t overstretch the spring, or put too much voltage across a bulb).
Your table could look similar to this one.
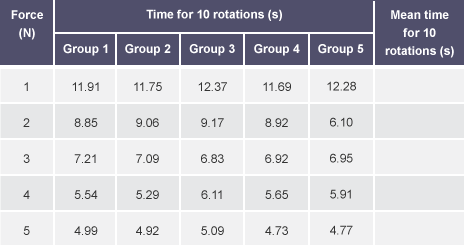
Once the results have been written down, you will need to check if any of the readings are anomalous.
All the readings going across the table should be reasonably similar if they are repeatable. If any result is much higher or lower, it should be crossed out, and not included in the mean calculation for that row.
3. Risk Assessment
Risk Assessment
You may have to complete a risk assessment for the investigation before you carry it out.
A risk assessment consists of three sections – hazard, risk and control measure.
You must first identify any potential hazards. In other words, identify the ‘ouch’. This will be something that could hurt you or anybody else, and its source. For example, a hot lamp could cause burns.
Secondly, you must state what the risk is. What is likely to cause the ‘ouch’? What is plausible that you could do to hurt yourself? In this example, it could be touching a very hot lamp when moving it. Moving it would be the reason you or someone else would get burned.
Then, you must think of a control measure. This means asking yourself, how to avoid the ‘ouch’? If the risk, like this example, is a risk of getting burned by a hot lamp, the control measure would be to allow the lamp to cool before attempting to move or hold it.
4. Improving Your Measuring
Precision and Uncertainty
Try to be more precise in your measuring. Use an instrument with a smaller resolution, and read it to the smallest reading possible.
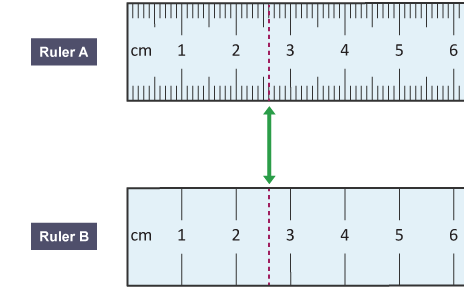
Ruler A will give a more precise reading and will reduce the uncertainty in your result.
An uncertainty of 1 mm in 25 mm is 4 %.
An uncertainty of 1 cm in 2.5 cm is 40 %. This is ten times bigger.
How is Uncertainty Calculated?
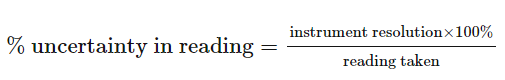
The resolution is the smallest division on the instrument.
5. Random Errors
Random Errors
Random errors are errors made by the person carrying out the measuring, and are usually down to timing incorrectly, or reading the instrument incorrectly. It is important to try to reduce or limit the effect of random errors in measuring.
Reaction time errors and parallax errors are examples of random errors.
Parallax Error
A parallax error is caused by a student not reading the measurement at eye level. It can lead to the reading being too high or too low.
Systematic Errors (Zero Errors)
Zero errors are caused by faulty equipment that doesn’t reset to zero properly.
Check before you start measuring that the measuring instruments read zero for zero input.
A zero error would affect every reading you take. The digital balance will be wrong by 0.02 g on every mass you measure and the force meter would be wrong by 1 N.
6. Sample Size and Anomalous Results
Sample Size and Anomalous Results
An anomalous result is a result that doesn’t fit in with the pattern of the other results. It is an anomaly.
Taking many repeat measurements or having a large sample size to analyze will improve accuracy. Anomalous results can be easily spotted in the data and discarded, leading to a more accurate calculation of the mean.
Look at the following six results taken by a student.
0.63, 0.71, 0.64, 0.69, 1.20, 0.67
The anomalous result is 1.20. It is too high compared to the other results.
Slow Motion Cameras
Sometimes something can be moving too quickly for us to accurately take a reading.
A bouncing ball can be filmed with a slow motion camera bouncing up against a scale to see the height it bounces to.
This will improve the accuracy of the measurement.
7. Displaying the Results
Drawing Graphs and Charts
There are several methods for displaying the data, but usually you will have to draw a line graph.
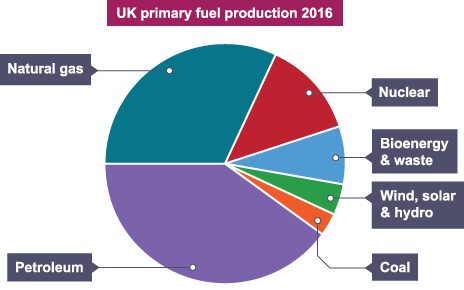
Pie Charts
Pie charts can be used to show the make-up of something, when compared to the total data. Each section is a category or name and the size of the pie segment represents a percentage of the whole. An example of this is how the UK electricity supply is met from different renewable and non-renewable sources, as a percentage of the total energy supplied.
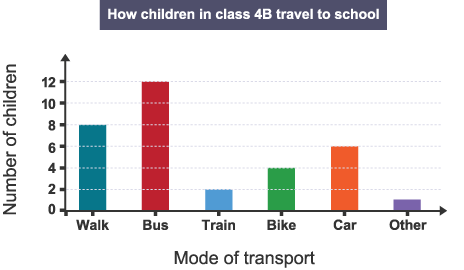
Bar Graphs
Bar graphs are used when the x-axis is a range of categories, names or labels (categorical variables) and the y-axis can take any numerical value (continuous variable). An example of this would be the height a golf ball bounces to when dropped on different surfaces. The bounce height is a continuous variable and the different types of surface are categorical variables. Bar graphs can also be drawn to display fixed or discrete numbers (discontinuous variables) on the x-axis, e.g. months in a year or the number of legs possessed by animals and insects (2, 4, 6, 8).
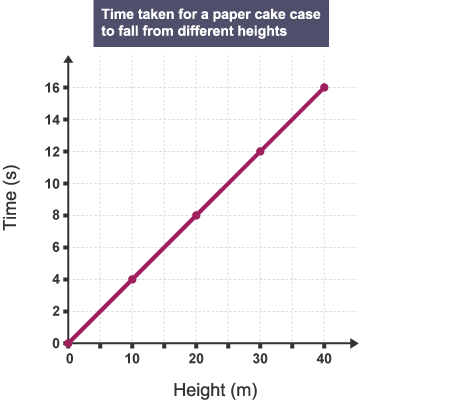
Line Graphs
Line graphs are used when both axes are continuous variables because they can take any numerical value. An example of this might be a graph to show the time taken for a paper cake case to fall from different heights.
8. Constructing a Line Graph
Constructing a Line Graph
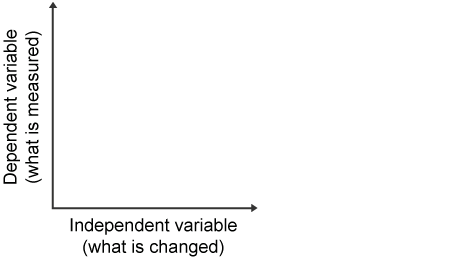
The independent variable is shown on the x-axis and the dependent variable is the y-axis.
Variable A might be the weight added to a spring (N) and variable B might be the length of the spring (cm).
The graph must have linear x and y axes – each square must go up by a regular amount each time.
Each axis must be fully labeled with the correct unit.
The graph drawn should be scaled so that it occupies at least half of the graph paper in both directions.
The intervals on the x and y axes should not go up in 3 s, 6 s, 7 s, or 9 s, use 1 s, 2 s, or 5 s and multiples of these, for example 10 s, 20 s, 40 s, 50 s are good as they are easy to plot and read.
Connect the plotted points with a ruler to draw the best line or curve of fit. No dot to dot joining.
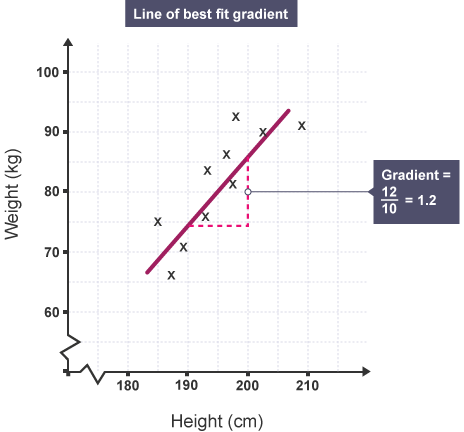
The Graph Gradient
You might be asked to find the gradient of the line graph to find a quantity such as the spring constant or the acceleration of a vehicle.
To do this you will need to make a large triangle on the graph and find the vertical and horizontal parts of the triangle.
The gradient is the
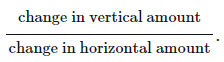
9. Concluding – Looking for Patterns
Looking for Patterns, Trends, and Correlations in Graphs
In this part of the paper, you will have to analyze your data and suggest or confirm a relationship between the independent variable (A), and the dependent variable (B). Here are some examples of relationships from graphs.
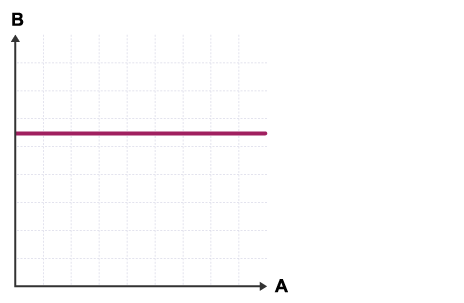
No correlation between variables A and B.
Variable A changes, B doesn’t change.
Variable B is independent of variable A.
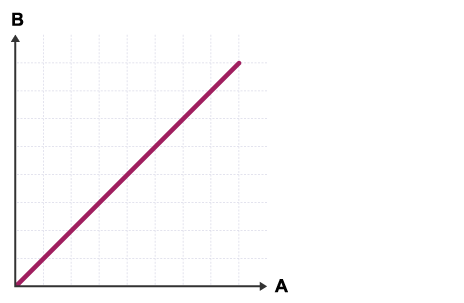
Direct proportion between A and B.
A changes, B changes in the same ratio, e.g. if A doubles, so does B.
A graph that shows direct proportion is a straight rising line that goes through the origin.
An example of this might be if A is the resultant force on a dynamics trolley and B is the acceleration of the trolley. The acceleration of the trolley is directly proportional to the resultant force.
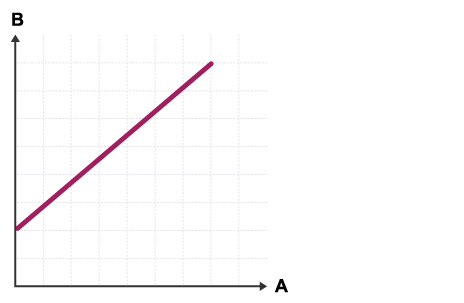
A and B are proportional to each other.
Variable A changes by a regular amount and so does B.
The graph does not go through the origin.
An example of this might be if A is a weight added to a spring and B is the length of the spring. The length of the spring is proportional to the weight added to it.
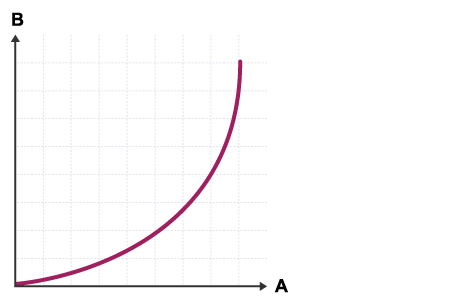
There is an increasing positive correlation between variables A and B.
A increases by a regular amount.
B increases at an increasing rate.
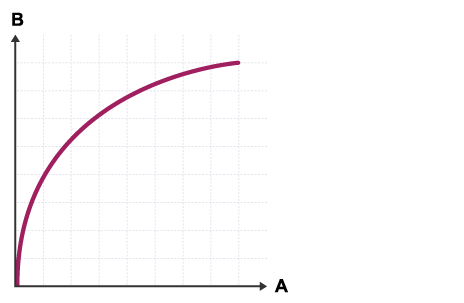
There is a decreasing positive correlation between variables A and B.
A increases by a regular amount.
B increases at a decreasing rate.
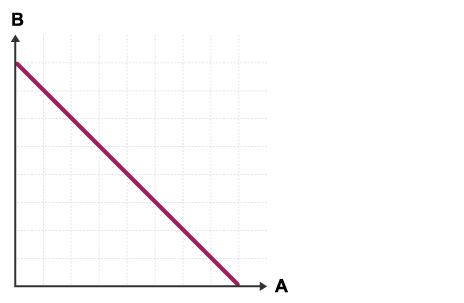
Variables A and B show negative correlation to each other.
A increases by a regular amount.
B decreases by a regular amount.
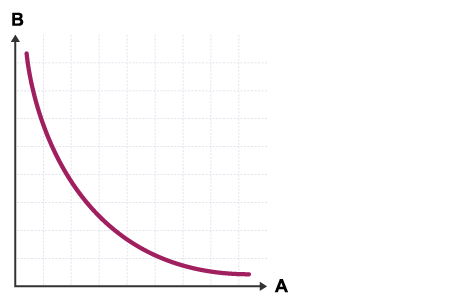
Variables A and B are inversely proportional to each other.
As A increases, B decreases.
As A doubles, B halves.
An example of this might be if A was the mass of a dynamics trolley and B was its acceleration. The acceleration of the trolley is inversely proportional to the mass of the trolley.
10. Judging the Strength of Evidence
Judging the Strength of Evidence
Scientists can have confidence in their conclusions if the evidence gathered in the experiment is strong. Before confirming a link between variables, they will evaluate their experimental methods and measuring techniques, and review the data taken.
Here are some questions that you may need to consider when you evaluate your experiment.
Method
Evaluation of method/experimental technique/improving accuracy.
Were there any random errors in measuring, e.g. reaction time, parallax error? Did you try to reduce them?
How precise were you in measuring, e.g. did you use instruments with higher resolutions and read to the smallest division?
Were there any systematic errors, e.g. zero errors in the instruments?
Was your method of taking results good, or did you make mistakes?
Are there any sources of inaccuracy in your method, e.g. did you keep the control variables completely constant?
Suggest improvements to method/measuring technique to improve confidence in the data and the conclusion.
What did you do well and what could you improve on?
What would you do differently next time?
Could you suggest improvements to the method that would increase the confidence in the outcome, e.g. larger sample size, more repeats, slow motion camera to show bounce heights or computer sensors to remove reaction time errors.
Evaluate the Strength of Evidence/Data
Repeatability
How repeatable are your results? Did your results vary by large amounts? Did you have any off points on the graph, or anomalous readings in the table? How could you check these? Were enough repeat readings taken and a mean calculated? Is the sample size high enough?
Reproducibility
Did other groups following a similar method get the same graphs or patterns in their results, e.g. have you compared your graphs and data with other, different groups who followed the same method, to confirm the same conclusion has been reached? Was the range of the independent variable sufficient to show a pattern?s