Econometrics
Week 1
08/26/2025
Midterm:
October 9
December 2
Final:
Work in groups of 2
Write Empirical paper
Need to use Strata
Represent what you learn
Buy textbook and read it
Homework (08/28/2025)
Important statistical concepts used in Econometrics:
Measure of central tendency:
Mean
Median
Measures of dispersion:
Variance
Standard Deviation
Minimum, Maximum, and Range
Skewness and Kurtosis
Correlation, covariance
Confidence interval
Mean
Measure of central tendency
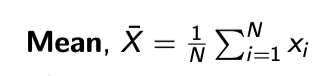
The mean is the arithmetic average of the data.
Suppose to have N observation of X, then Mean is the sum of X’s divided by N
Median
Another measure of central tendency
Median is the middle observation when the data are arranged from smallest to largest.
Sometimes called the 50th percentile.
Half the observations lie below the median and half the observations live above the median.
Central observation for an odd number of observations and an average of the two middle data points for an even number of observations.
Measures of Dispersion:
Variance
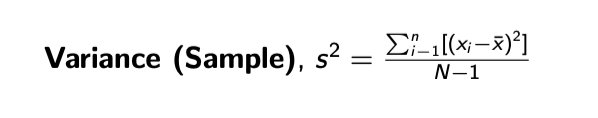
Measure of dispersion (how scattered the data is)
The variance (sample) is calculated by subtracting the mean from each observation, squaring that value, adding up all N values, and then dividing that by the number of observations less one.
Standard deviation
Another measure of dispersion
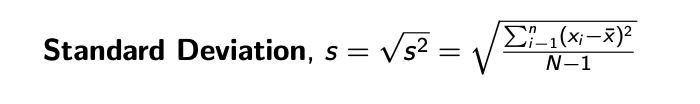
Measures the average deviation of the values in the dataset away from the mean
It is the square root of the variance
Covariance and Correlation Coefficient
Provides numerical value to the strength and direction of the linear relationship between two variables.
Only concerned with strength of the relationship.
No casual effect is implied!
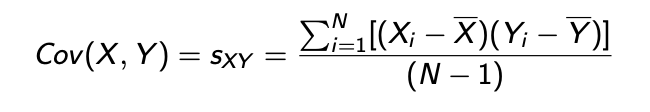
Covariance:
Measure of linear relationship between two random variables Think of variance (measures how X varies with itself)
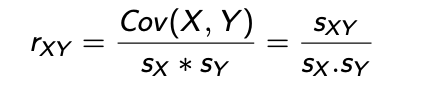
Correlation Coefficient:
Degree of joint variation between Y and X as a fraction for the individual variations in Y and X scaled, removes the interpretation problem:
Covariance and Correlation Coefficient Interpretation
Covariance:
Positive:
Above average values of X associated with above values of Y
Negative:
Above average values of X associated with below average values of Y
Problem with the covariance measure:
We do not know whether the magnitude is large or small because of the units that we choose.
Correlation Coefficient:
If all data points in a data set fall on a positively sloped line, rxy =1.
The closer to positive 1, the stronger the positive linear relationship.
If all the data points in a data set fall on a negatively sloped line, rxy =-1.
The closer to negative 1, the stronger the negative linear relationship.
If there is no linear relationship between X and Y, then rxy =0.
The closer to 0, the weaker the linear relationship.
Random Variables
A random variable is a numerical outcome of a random process.
Two types:
Discrete random variables - take on countable values (number of heads in a coin toss basically).
Continuous random variables - take on any variable within an interval (height or income basically)
Notation:
Often denoted by capital letters (X,Y)
Values:
Represented by lowercase letters (x,y)
In econometrics, random variables are used to model uncertainty data.
Random Variable and Expectation
Expectation (or expected value) represents the long-run average of a random variable.
It provides a measure of the “center” of the distribution.
For a discrete random variable X:
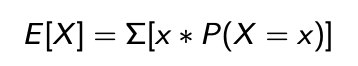
Where P(X = x) is the probability that the random variable, X takes value “x”.
08/28/2025
Econometrics
Literally means “economic measurement”
Econometrics is a science and art of using economic theory and statistical techniques to analyze economic data.
Econometrics attempts to quantitatively bridge the gap between economic theory and the real world.
Venn Diagram:
Economic on the left
Statistics on the right
Econometrics in the middle
Week 2
09/02/2025
Regression Equation
Y = B0 + B1X
Week 5
09/23/2025
Week 6
10/02/2025
Hypothesis Testing
We work with samples of the population. We do not know the population parameter.
Hypothesis testing is method in which sample data is used to learn about population parameters.
Statistical hypothesis is a set of assumptions about a model of observing data.
Hypothesis testing is a decision about statistical hypothesis.
Distinguishes between the null and the alternative hypothesis:
Null hypothesis (H0): The outcome that the researcher does not expect.
Alternative hypothesis (HA): The outcome the researcher does expect.
One-sided versus Two-sided tests
One sided hypothesis:
Right sided:
H0: B ≤ 0
HA: B > 0
Left sided:
H0 ≥ 0
HA < 0
Two sided (or a two tailed test) hypothesis around zero:
H0: β = 0
HA: β ≠ 0
Testing of hypothesis
Typical testing technique in econometrics:
Hypothesize an expected sign (or value) for each regression coefficient (except constant)
Determine whether to reject the null hypothesis using some decision rule.
There are three ways to test a hypothesis:
T-test
P-value
Confidence interval
Hypothesis testing: decision rule
A decision rule
is a method of deciding whether to reject a null hypothesis.
involves comparing a sample statistic with a critical value.
should be formulated before regression estimates are obtained.
A critical value divides into the range of possible values of B (sample distribution of B) into two regions:
acceptance region
rejection region
Critical value is obtained from statistical tables for different test statistic.
T-Test
The t-test is used to test hypothesis about individual slope coefficients.
It is an appropriate test when:
The stochastic error term is normally distributed.
Variance of the distribution must be estimated.
The test is a measure of how far the observed estimated slope coefficient is from the hypothesized population parameter, adjusted for standard error.
Level of significance
It is a measure of how willing are you to wrongly reject your null hypothesis when it is true (Type I Error).
Must be chosen before a critical value can be found.
How should we choose the level of significance?
5% is recommended, generally economists focus on 10%, 5%, 1% levels.
Should not be too small as lowering the significance level increases the probability of failing to reject a false null hypothesis (Type II Error).
Type I and Type II Error
Two types of of errors possible in hypothesis training:
Type I: Rejecting a true null hypothesis (That is, we found an effect while it is not there).
Type II: Failure to reject a false null hypothesis (We do not find an effect while there is one).
Confidence level (1 - a)
The level of confidence or confidence level is (1-a)
For a = 0.05 (5% level of significance), confidence level is 1 - a = 1 - 0.05=0.95
Decision rule for T-test
Compare the calculated value of t-stat (tk) to a critical value, tc.
The critical value, tc, is selected from a t-table based on:
Whether the test is one-sided or two-sided.
Level of significance.
Number of degrees of freedom.
Once a critical t-value (tc) has been selected and calculated t-value (tk) obtained, apply the following decision rule:
Reject H0 if |tk| > tc and if tk has the sign implied by HA,
Fail to reject H0 otherwise
Limitations of T-test
Does not test theoretical validity
Does not test “importance”
Cannot compare the coefficients of a regression using their statistical significance.
One coefficient is “more statistically significant” than another does not mean that it is also important in explaining the dependent variable.
No intended for tests of the entire population
As N increases, SE(B) decreases, the t-score will approach infinity
Week 7
Midterm Studying
I will provide you with all the Power Points from my class. I also will give you the study guide provided. I want you to give me the answers to the study guide, give me an explanation for each question so I can be prepared for my midterm tomorrow.
Week 9
10/21/2025
Limitations of t-test.
Does not test theoretical validity
Does not test “importance?”
Cannot compare the coefficients of a regression using their statistical significance.
One coefficient is “more statistically significant” than another does not mean that it is also more important in explaining the dependent variable.
Not intended for tests of the entire population
As N increases, SE(B^) decreases, the t-score will approach infinity.
P-value.
An alternative to the t-test
Decision rule:
Reject Ho if p-value of B^k < a (significance level) and if B^k has the sign implied by Ha, Fail to reject Ho otherwise.
P-value is the lowest level of significance at which you can reject the Ho.
Statistical software packages automatically give the p-values as part of the standard output.
Caution: p-values are always printed for the two-sided alternative hypothesis.
Level of Significance
It is a measure of how willing are you to wrongly reject your null hypothesis when it is true (Type I Error).
Must be chosen before a critical value can be found.
Confidence Intervals
This is the third way to do hypothesis testing.
Confidence Interval is a range that contains all the values of Bk a specified percentage of the time.
Formula:
Confidence interval of Bk = B^k +- tc * SE(B^k)
Where tc is the two-sided critical value of the t-statistic for the chose significance level.
Decision rule: if a hypothesized value of the coefficient fall within the confidence interval, then we cannot reject the null hypothesis.
Model Specification
Before any equation can be estimated, it must be completely specified.
Specifying an econometric equation consists of three parts:
Choosing the correct independent variables
Choosing the correct functional form
Choosing the correct form of the stochastic error term
A specification error results when one of these choices is made incorrectly.
In this chapter, focus on choosing “correct independent variables”.
Omitted Variables
Omitted variable: When an important explanatory variable might have been left out of “omitted” from the regression model.
Why may this problem arise?
Researcher forgets to include the variable, or
There is no data available on the variable
What is the consequence?
Lead to omitted variable bias or, more generally, specification bias.
Can no longer hold constant the variable that is not included in the model.
Regression estimates can not be trusted.
Classical Assumptions
Assumption ///: All explanatory variable are uncorrelated with the error term.
Example:
Wagei = Bo + B1 EDUi + B2 Hispanic(i) + B3 * female (i) = Ei
Regression
Ei = error term