Exponential Graphs
Graphs
- A function of the form f(x) = ka(x) is called an exponential function
- You need to be able to recognise and sketch the graphs of exponential functions
- The shape of an exponential graph depends on whether x is positive and negative
Exponential growth
- Exponential graphs appear in equations representing growth or decay
- If there are 500 bacteria in a Petri dish, and the number doubles every hour, then after h hours there will be N=500x2(h) bacteria in the Petri dish
- The graph of N against h will be an exponential graph
Finding missing values
- Some questions ask you to find the missing values in an exponential equation
- You can do this by substituting the values of x and y that you are given to get two equation and then work out k
Exponential graphs
- Exponential graphs are graphs in the form y=k(x)
- These graphs increase rapidly in the y direction and will never fall below the x-axis.
- An exponential graph will look like this:
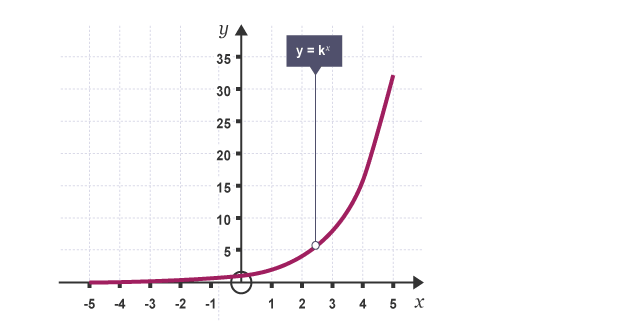 How to identify an exponential graph:
- Graphs of Exponential Functions
- The graph passes through the point (0,1)
- The domain is all real numbers.
- The range is y>0.
- The graph is increasing.
- The graph is asymptotic to the x-axis as x approaches negative infinity.
- The graph increases without bound as x approaches positive infinity.
- The graph is continuous. \n