M2 Lecture 3: Independent T Test
t Test for Independent Groups
Purpose: Compare the means of two independent groups of subjects (unrelated groups)
Application example: Does drinking orange juice (OJ) daily affect memory scores?
Independent groups: OJ drinkers vs non-OJ drinkers
Dependent variable (DV): memory score (level of measurement: interval/ratio)
Assumptions
Independence of observations between groups
Normality of the DV within each group
Homogeneity of variances (equal variances across groups)
DV is interval/ratio
Level of significance used in the example: \alpha = 0.05
Hypothesis Testing Framework EXAMPLE
Null hypothesis (H0): There will be no difference in memory score between the OJ drinkers and the non-OJ drinkers.
Research/alternative hypothesis (H1): There will be a difference in memory score between the OJ drinkers and the non-OJ drinkers.
Test Statistic: The t-test will be utilized to determine whether the means of the two groups are significantly different from each other. The significance level (alpha) will be set at 0.05, indicating that we will reject the null hypothesis if the p-value is less than this threshold.
Six-step testing procedure (recalled from the review)
Develop null and research hypotheses
Choose a level of significance (\alpha)
Determine which statistical test is appropriate
Run analysis to obtain test statistic and p-value
Make a decision about rejecting or failing to reject the null hypothesis
Make a conclusion
Levene’s Test for Equality of Variances
Purpose: Assess whether the variances in the two groups are equal
Null hypothesis (Levene): There is no difference in variances between the two groups
If Levene’s test is non-significant (p > 0.05), proceed with the standard t-test assuming equal variances
If Levene’s test is significant (p ≤ 0.05), variances are heterogeneous, and a version of the t-test that does not assume equal variances (Welch’s t-test) is appropriate
Example Data: Memory and OJ Drinking
Groups: OJ drinkers vs non-OJ drinkers (two independent groups)
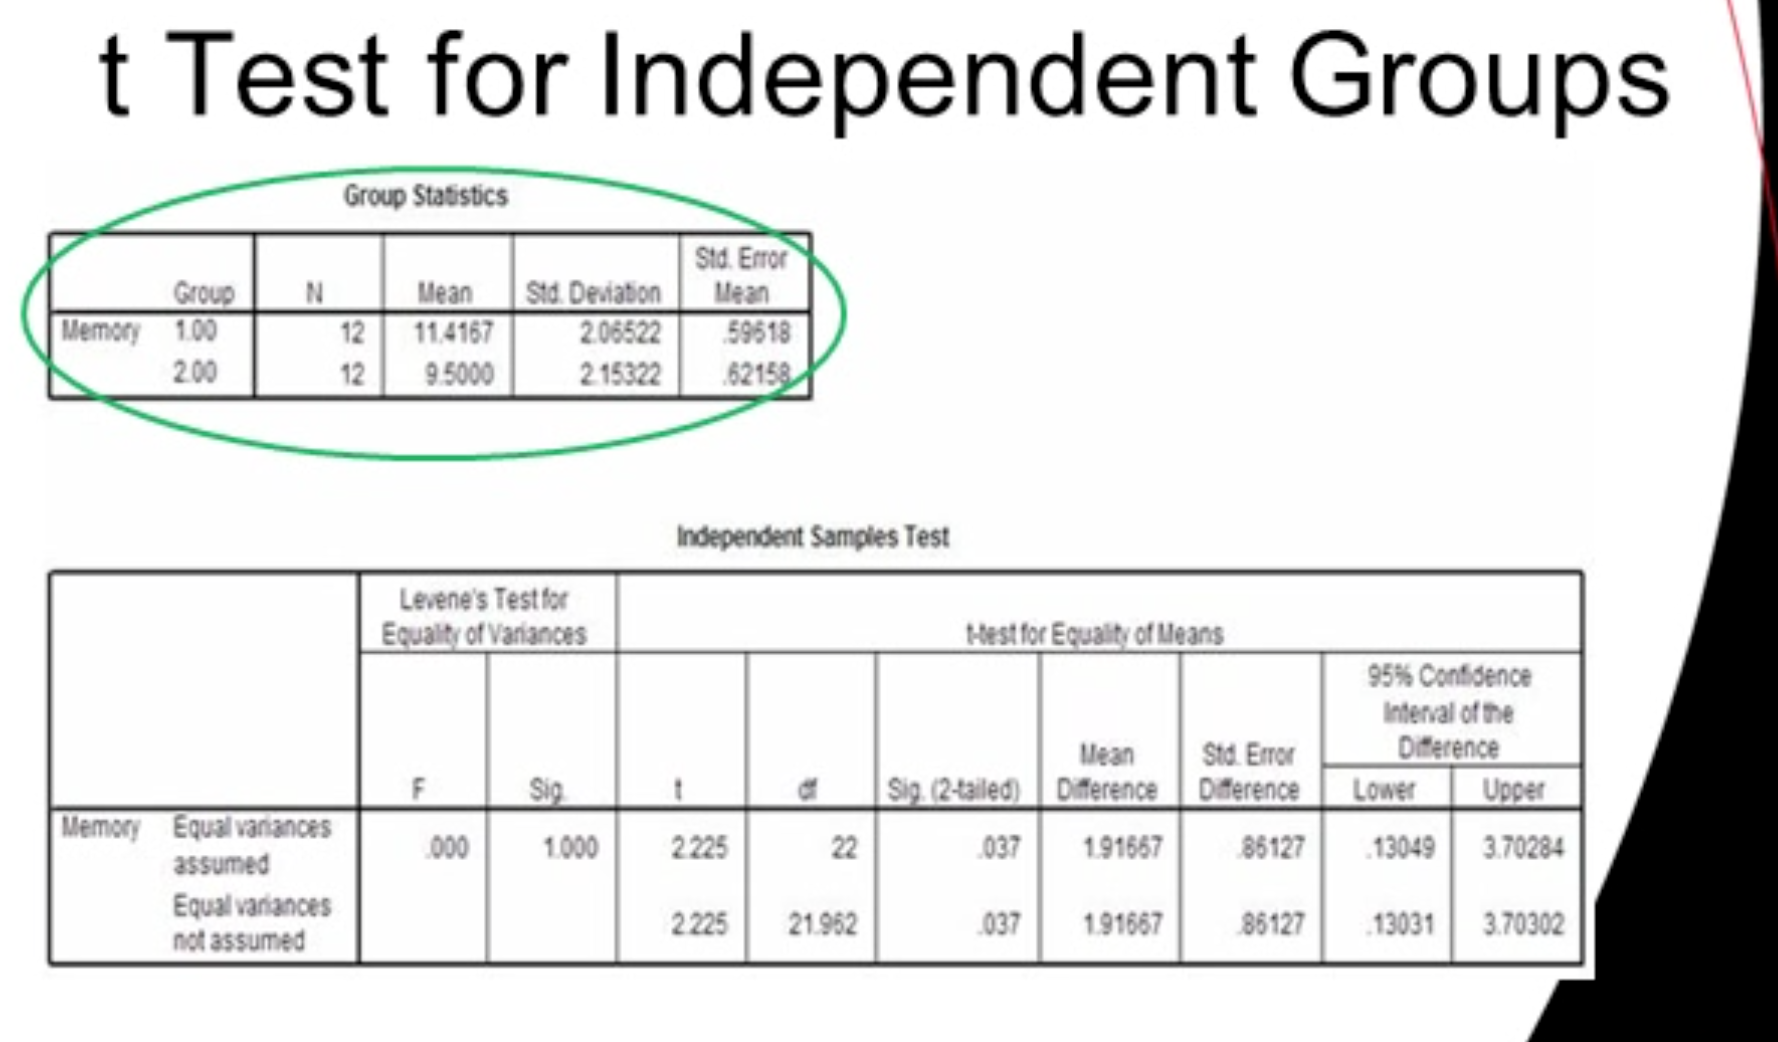
Reported results (summary statistics from the example):
OJ drinkers: mean memory score \overline{X}{\text{OJ}} = \text{11.42}$, standard deviation s{\text{OJ}} = \text{2.07}
Non-OJ drinkers: mean memory score \overline{X}{\text{nonOJ}} = \text{9.50}, standard deviation s{\text{nonOJ}} = \text{2.15}
Sample sizes: likely n1 = n2 = 12 (total df reported as t(22), consistent with two groups of 12)
Test statistic reported: t(22) = 2.225, p = 0.037
Difference in means: \Delta\overline{X} = \overline{X}{\text{OJ}} - \overline{X}{\text{nonOJ}} = 11.42 - 9.50 = 1.92
95% confidence interval for the mean difference (not explicitly given in slides, but typically reported with t-testing): not provided in the transcript
Conclusion in the transcript: p = 0.037 < \alpha = 0.05, therefore reject the null hypothesis; there is a difference in memory scores between the two groups
Final stated interpretation (from slide): On average, memory scores of OJ drinkers were significantly higher than those of non-OJ drinkers (OJ: M=11.42, SD=2.07 vs non-OJ: M=9.50, SD=2.15), with t(22) = 2.225, p = 0.037
Formulas and Calculations
Pooled-variance independent samples t-test (assuming equal variances)
Pooled variance: Sp^2 = \frac{(n1 - 1)s1^2 + (n2 - 1)s2^2}{n1 + n2 - 2}
Test statistic: t = \frac{\overline{X}1 - \overline{X}2}{\sqrt{ Sp^2\left(\frac{1}{n1} + \frac{1}{n2}\right) }}
Degrees of freedom (df): df = n1 + n2 - 2
Welch’s t-test (no assumption of equal variances)
Test statistic: t = \frac{\overline{X}1 - \overline{X}2}{\sqrt{ \frac{s1^2}{n1} + \frac{s2^2}{n2} }}
Degrees of freedom (approximate, Welch-Satterthwaite):
df \approx \frac{\left(\frac{s1^2}{n1} + \frac{s2^2}{n2}\right)^2}{\frac{\left(\frac{s1^2}{n1}\right)^2}{n1 - 1} + \frac{\left(\frac{s2^2}{n2}\right)^2}{n2 - 1}}
Interpretation of p-value
If p < \alpha, reject the null hypothesis and conclude a difference between group means
If p \ge \alpha, fail to reject the null hypothesis
Connections to Practice and Implications
Practical implication: If daily orange juice consumption is associated with higher memory scores, consider potential confounders (e.g., overall diet, caffeine intake, education, baseline memory) before causal claims are made
Ethical/philosophical note: Correlation does not imply causation; randomized controlled trials are needed to establish causality
Relevance to evidence-based practice: Use appropriate statistical tests based on data characteristics (independence, normality, equal variances) and report test statistics, degrees of freedom, and exact p-values
Quick Reference from the Transcript
Study design: t Test for Independent Groups
Assumptions: independence, normality, homogeneity of variances, DV=interval/ratio
Null hypothesis: no difference in memory scores between OJ drinkers and non-OJ drinkers
Alternative hypothesis: there is a difference
Significance level: \alpha = 0.05
Levene’s test: Null is equality of variances; significance guides whether to assume equal variances
Reported result: t(22) = 2.225, p = 0.037; p < 0.05; reject H0
Means and standard deviations (example conclusion): OJ \overline{X}{\text{OJ}} = 11.42, s{\text{OJ}} = 2.07; non-OJ \overline{X}{\text{nonOJ}} = 9.50, s{\text{nonOJ}} = 2.15
Interpretation statement: On average, OJ drinkers scored higher on memory tests than non-OJ drinkers by about 1.92$$ points, difference being statistically significant
{ }