3b. Supply
Supply is defined as the quantity of goods that sellers are prepared to sell at any given price over a period of time. Ceteris paribus, if the price of a good increases, producers are likely to expand production (supply) to take advantage of the higher prices and the higher profits that they can make.
The Slope of the Supply Curve
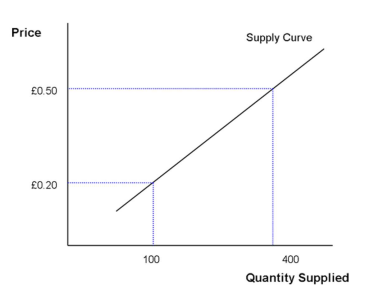
The supply curve shows a positive relationship between price and quantity supplied. In order to attract new suppliers to the market, there needs to be a sufficient incentive.
Current producers wanting to produce more output will need to purchase more resources – meaning greater costs. They will need to charge a higher price to make a profit.
Causes of shifts in supply
Policies and Regulations
Following government rules can increase the costs of doing business increasing prices
Number of Firms
More businesses in the market mean production can be increased Indirect
Taxes
Businesses have to pay indirect taxes e.g. VAT, increasing their prices
Subsidies
Government subsidies reduce the costs of production
Technology
Increased efficiency of capital allows greater production
Weather
Good or bad weather can affect production
Costs of Production
Higher costs mean firms cannot produce as much
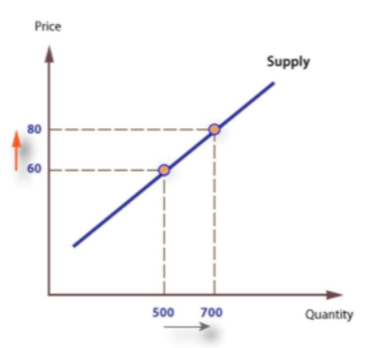
A movement along the supply curve
When the price changes there is a movement along the supply curve (also known as an extension or contraction of supply).
As the price rises from 60 to 80, producers can make greater profits so will enter the market (if a new producer) or expand production (if an existing producer) leading to an increase in quantity supplied from 500 to 700
Remember the relationship seen in the supply curve is based on the assumption that only price is changing (ceteris parabis).
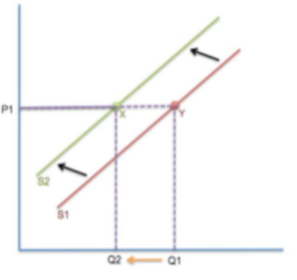
Shifts of the supply curve
An increase in supply for the product will cause a shift to the right
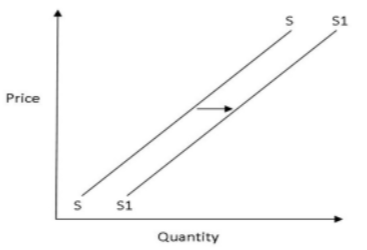
A decrease in supply for the product will cause a shift to the left