Lecture 5 Equity Capital Market and Equity Valuation
What is a Equity Capital Markets?
Definition: Markets that trade equity (stocks) instruments
Primary Market: Corporations raise funds through new share issues
IPO (Initial Public Offering): First-time public trading of shares
SEO (Seasoned Equity Offering): New equity issued by already public companies
Secondary Market: Trades financial instruments post-issuance
What is a Secondary Market Eco System?
Investors use stock exchanges (broker/trader) for buying/selling shares
Common Stock Exchanges: NYSE, NASDAQ, ASX
What are some Trading Practices?
Price-driven Trading System: Market makers quote bid and ask prices
Guarantees order execution (e.g., Forex market)
Order-driven Trading System: Displays all buy/sell orders
More transparency (e.g., ASX, Tokyo, Shanghai)
Hybrid System: Combination of price-driven and order-driven systems (e.g., NYSE, Nasdaq)
What is the Process of Trading Shares?
Investor contacts a stockbroker to open an account
Investor places an order via phone or internet
Types of orders: limit orders and market orders
Stockbroker executes the order via a counterparty
Settlement occurs, transferring ownership of shares for cash
Who are the Major Market Participants?
Buying and selling parties: individuals, institutions, fund managers
Fund Manager: Invests funds on behalf of clients
Stockbroker: Provides trading services, acts as a conduit or agent
Securities Exchange: Facilitates trading and self-regulation
What is Stock?
Stocks represent ownership in a company
Stock owners are entitled to a share of the corporation’s assets and profits
Investors provide cash to purchase shares, receiving a contract of ownership
Value growth realized upon selling stock; investors may also receive dividends
Why It Is Good to Own a Stock?
Potential for significant returns (e.g., Apple stock example)
Associated risks in stock ownership
What is Price?
Market Share Price: Price at which stocks are traded
Fluctuates based on supply and demand
Intrinsic Value: True value of a stock based on fundamentals
Focus on Dividend Discount Models and Value Multiples for identifying mispriced stocks
How can we use Intrinsic Value and Market Value?
Intrinsic Value (IV): True value according to a model
Market Value (MV): Consensus value represented by share price
Trading Recommendations:
IV > MV: Buy
IV < MV: Sell or Short Sell
IV = MV: Fairly Priced
What is the relationship between “No-Arbitrage” and “Security Prices”?
Security price must equal present value of cash flows to avoid arbitrage
A security price in finance refers to the current market value of a financial instrument, such as stocks, bonds, or derivatives.
Investors earn returns from dividends and capital gains
Share price reflects present value of future cash flows
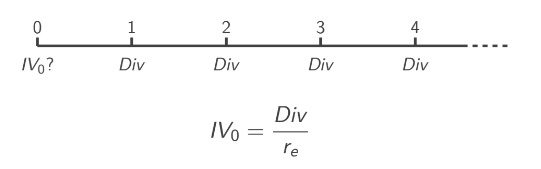
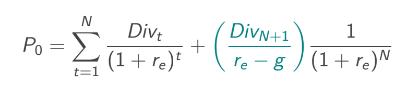
What is the “Dividend-Discount Model”?
Stock value = Present value of future expected cash flows (dividends)
Formula:
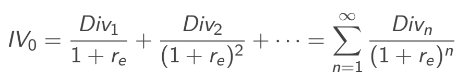
Discount rate (re): Expected return on similar risk securities
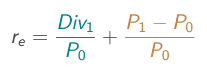
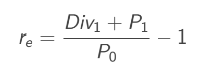
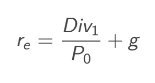
How to find ‘re’?
Total return = dividend yield + capital gain rate = equity cost of capital (re)
There’s 3 ways of representing this:
Other way is using Capital Asset Pricing Model (CAPM):
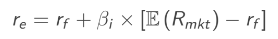
risk-free rate rf
market portfolio expected return E(Rmkt)
systematic risk B1
What are the other names for re?
cost of equity
required rate of return
cost of capital
How to estimate all future dividend payments?
Constant Dividend: Fixed dividends forever (perpetuity)
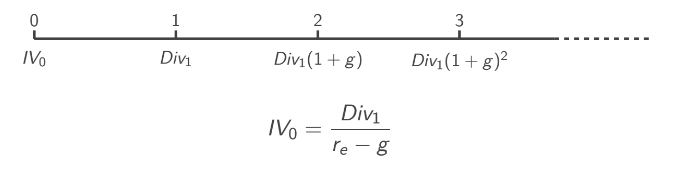
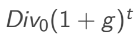
Constant Dividend Growth: Dividends grow at a constant rate
Changing Growth Rates: Initial high growth rates that stabilize over time, we have to use multistage DDM.
If dividend has a different timeframe than the cost or equity, make it equal to the cost of equity. e.g. a semi-annual dividend of $1.3 per share, and has an equity cost of capital equal to 12.4% p.a.
to calculate the IV of this stock, we have to times 1.3 by 2 to make it annual dividend then divided it for 12.4%.
What can we find more about dividend?
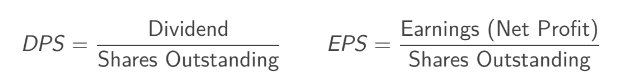
DPS: dividend per share
EPS: earning per share
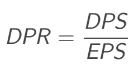
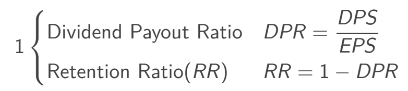
Dividend payout ratio is the fraction of earnings paid as dividends each year.
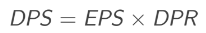
How can firm increase its dividend?
assume the number of shares is constant:
increase its earnings (income)
increase its dividend payout rate
What can firm do if they had cash remaining?
retain to reinvest the cash
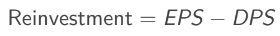
pay dividends to shareholders
These ratios must add up to 100% (or $1):
How to find ‘g’, the growth rate?
Growth rate (g) derived from earnings retention and payout
Formula:
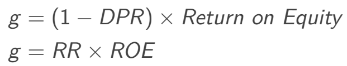
DPR: Dividend Payout Ratio
RR: Retention Ratio
ROE: return on equity (in %)
How to use the “Multistage DDM”?
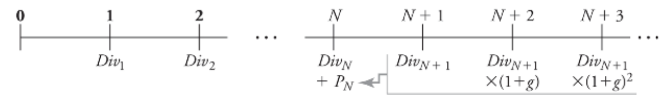
Allows for multiple growth stages
Example: Two-stage growth model with initial high growth followed by stable growth
A terminal value represents the estimated value of an investment or project at the end of a forecast period, extending into perpetuity.
Terminal value
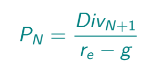
Value of the stock in multistage: the first part of this equation is the sum of all present value of growing dividend at the initial growth rate + the second part is the present value of terminal value (aka perpetuity under new changes) under the new growth rate.
Steps to find IV of multistage DDM:
Find the initial growth rate, EPS, DPS if not given.
Find the new growth rate
Find the dividend of each year incorporate the growth rate until the year with the change in growth rate (n). e.g. Div1 = 3.5 × 1.07 = 3.745; Div2 = 3.745 × 1.07 = 4.00715 and so on.
Using the same method in step 3, find the dividend in the new growth rate (divn+1). e.g. Div3 = 4.00715 × 1.023 = 4.099
Now to find the terminal value, apply the perpetuity formula using the “dividend under new growth rate” and the “new growth rate”. e.g. 4.099/(11.5%-2.3%)
Discount value of each dividends (of old growth rate) and the terminal value (n should = to the last dividend before change in growth rate, e.g. n = 2). Note: do not include the dividend under new growth rate because it is already used for perpetuity. e.g. 4.099 is not included.
Sum all the discounted value to find the IV.
What are the limitations of the Dividend-Discount Model?
Uncertainty in forecasting future earnings and dividends
Small changes in growth rate assumptions can significantly impact stock price estimates
Valuation Based on Comparable Firms
Method of Comparable: Value estimation based on similar firms
Valuation Multiple: Ratio of firm’s value to a measure of scale or cash flow
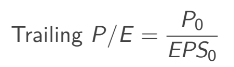
What are the Price-Earnings Ratio?
P/E Ratio: Share price divided by earnings per share
when asking to calculate the ratio, it meant both trailing and forward
Trailing P/E: earnings over the last 12 months
Forward P/E: expected earnings over the next 12 months
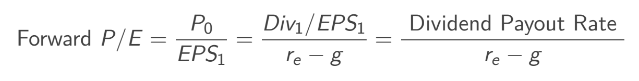
High growth firms typically have high P/E multiples
What are the Limitations of Multiples?
No clear guidance on adjusting for growth rates, risk, or accounting differences
Comparable provide relative value information only