Unit 1B Test Review
1. Absolute Maximum and Absolute Minimum
Absolute Maximum: The highest point on the entire graph of a function within its domain.
Found by evaluating the function at critical points and endpoints of the interval.
Example: For f(x)=−x2+4x+1f(x) = -x^2 + 4x + 1f(x)=−x2+4x+1, the absolute maximum is the highest value of f(x)f(x)f(x) on a given interval.
Absolute Minimum: The lowest point on the graph of a function within its domain.
Like the absolute maximum, it’s found by checking critical points and endpoints.
Example: For f(x)=x2−4x+5f(x) = x^2 - 4x + 5f(x)=x2−4x+5, the absolute minimum is the lowest value of f(x)f(x)f(x) on a given interval.
2. Local Maximum and Local Minimum
Local Maximum: A point on the graph where the function has a higher value than at any nearby points.
Occurs at critical points where the function changes from increasing to decreasing.
Example: If f(x)f(x)f(x) has a peak at x=cx = cx=c and is higher than points around it, then f(c)f(c)f(c) is a local maximum.
Local Minimum: A point where the function has a lower value than any nearby points.
Occurs at critical points where the function changes from decreasing to increasing.
Example: If f(x)f(x)f(x) has a low point at x=dx = dx=d, f(d)f(d)f(d) is a local minimum.
3. X-Intercepts and Y-Intercept
X-Intercept(s): The points where the graph crosses the x-axis (where y=0).
Found by setting f(x)=0 and solving for x
Example: For f(x)=x2−4f(x) = x^2 - 4f(x)=x2−4, the x-intercepts are x=−2x = -2x=−2 and x=2x = 2x=2 (points (−2,0)(-2, 0)(−2,0) and (2,0)(2, 0)(2,0)).
Y-Intercept: The point where the graph crosses the y-axis (where x=0x = 0x=0).
Found by evaluating f(0)f(0)f(0).
Example: For f(x)=x2−4x+3f(x) = x^2 - 4x + 3f(x)=x2−4x+3, substitute x=0x = 0x=0 to find the y-intercept as f(0)=3f(0) = 3f(0)=3, so the y-intercept is (0,3)(0, 3)(0,3).
4. Interval of Increase and Interval of Decrease
Interval of Increase: Where the function values are rising as x moves rightward.
Identified by finding intervals where f′(x)>0f'(x) > 0f′(x)>0 (the derivative is positive).
Example: For f(x)=x2−4x+5f(x) = x^2 - 4x + 5f(x)=x2−4x+5, f(x)f(x)f(x) increases on intervals where f′(x)f'(x)f′(x) is positive.
Interval of Decrease: Where the function values are falling as x moves rightward.
Found by identifying intervals where f′(x)<0f'(x) < 0f′(x)<0 (the derivative is negative).
Example: For f(x)=−x2+4xf(x) = -x^2 + 4xf(x)=−x2+4x, f(x)f(x)f(x) decreases on intervals where f′(x)f'(x)f′(x) is negative.
5. Constant Interval
Constant Interval: An interval where the function remains the same (flat) and does not increase or decrease.
On this interval, f′(x)=0f'(x) = 0f′(x)=0.
Example: If f(x)=3f(x) = 3f(x)=3 for all xxx in [−2,2][-2, 2][−2,2], then f(x)f(x)f(x) is constant on [−2,2][-2, 2][−2,2].
6. Even and Odd Functions
Understanding Odd and Even Functions
Even Function: A function f(x) is even if f(−x)=f(x) for all x in its domain. The graph of an even function is symmetric with respect to the y-axis.
Odd Function: A function f(x) is odd if f(−x)=−f(x) for all x in its domain. The graph of an odd function is symmetric with respect to the origin.
Identifying Even Functions on a Graph
Y-Axis Symmetry: For a function to be even, the graph should look the same on both sides of the y-axis.
Examples of Even Functions:
y=x2y = x^2y=x2
y=cos(x)y = \cos(x)y=cos(x)
Graph Check: Fold the graph along the y-axis. If the left side matches the right side perfectly, the function is even.
Identifying Even Functions on a Graph
Origin Symmetry: An odd function's graph will appear symmetric if rotated 180 degrees around the origin.
Examples of Odd Functions:
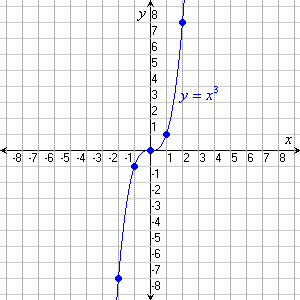
y=x3y = x^3y=x3
y=sin(x)y = \sin(x)y=sin(x)
Graph Check: If you can rotate the graph 180° around the origin and it looks the same, the function is odd.
Steps to Analyze the Graph for Symmetry
Y-Axis Symmetry (Even Test):
Check if the function is mirrored across the y-axis.
If yes, it’s even; if not, move to the next test.
Origin Symmetry (Odd Test):
Visualize rotating the graph 180 degrees around the origin.
If it matches itself after this rotation, it’s odd.
Neither Odd Nor Even:
Some functions are neither odd nor even if they don’t fit either symmetry. For instance, f(x)=x+1f(x) = x + 1f(x)=x+1.
7. Parent Functions
Constant Function
Equation: f(x)=cf(x) = cf(x)=c, where ccc is a constant (e.g., f(x)=3f(x) = 3f(x)=3)
Graph Shape: Horizontal line
Key Characteristics:
Even function (y-axis symmetry).
The output value is the same for all xxx.
Domain: All real numbers; Range: The constant value ccc.

Linear Function
Equation: f(x)=xf(x) = xf(x)=x
Graph Shape: Straight line through the origin
Key Characteristics:
Slope is constant.
Odd function (origin symmetry).

Quadratic Function
Equation: f(x)=x2f(x) = x^2f(x)=x2
Graph Shape: Parabola opening upward
Key Characteristics:
Even function (y-axis symmetry).
The lowest point is the vertex at the origin.

Cubic Function
Equation: f(x)=x3f(x) = x^3f(x)=x3
Graph Shape: S-shaped curve, passing through the origin
Key Characteristics:
Odd function (origin symmetry).
Increases on both sides of the origin with an inflection point at (0,0).

Square Root Function
Equation: f(x)=xf(x) = \sqrt{x}f(x)=x
Graph Shape: Curve starting at the origin, increasing slowly
Key Characteristics:
Defined only for x≥0x \geq 0x≥0.
Increases at a decreasing rate.

Cube Root Function
Equation: f(x)=x3f(x) = \sqrt[3]{x}f(x)=3x or f(x)=x1/3f(x) = x^{1/3}f(x)=x1/3
Graph Shape: Similar to the cubic function but more gradual, passing through the origin
Key Characteristics:
Odd function (origin symmetry).
Defined for all real numbers.
Increases slowly for positive xxx and decreases for negative xxx.

Absolute Value Function
Equation: f(x)=∣x∣ f(x) = |x|f(x)=∣x∣
Graph Shape: V-shaped, opening upward with a vertex at the origin
Key Characteristics:
Even function (y-axis symmetry).
Reflects positive and negative values of xxx into positive f(x)f(x)f(x) values.
Reciprocal Function
Equation: f(x)=1xf(x) = \frac{1}{x}f(x)=x1
Graph Shape: Hyperbolic, with asymptotes along the x- and y-axes
Key Characteristics:
Odd function (origin symmetry).
Undefined at x=0x = 0x=0; has vertical and horizontal asymptotes.
 Knowt
Knowt
