Study Guide - Midterm 2
Chapter 4
A random variable is a variable that assumes numerical values associated with the random outcomes of an experiment
Two Types:
Discrete Random Variable
assume a countable number (finite or infinite)
examples:
the number of sales made by a salesperson in a given week x = 0,1,2
the number of consumers in a sample of 500 who favor a brand: x = 0,1,2,3,4
the number of bids received in a bond offering: x=0,1,2,3,4,5
the number of errors on a page of an accountant’s ledger: x = 0,1,2,3,4,5
the number of customers waiting to be served in a restaurant at a particular time: x=0,1,2,3,4
Continuous Random Variable
assumes values corresponding to any points in an interval
examples:
the length of time between arrivals at a hospital clinic 0 < x < infinity
the amount of carbonated beverage loaded into a 12-ounce can in a can-filling operation: 0 < x < 12
the depth of which a successful oil-drilling venture first strikes oil: 0 < x < c
the weight of a food item bought in a supermarket: 0 < x < 500
What are the requirements of a probability distribution of a discrete random variable?
p(x) > 0 for all values of x
the sum of p(x) = 1
What is the formula for mean or expected value of a discrete random variable?
\mu=E\left(X\right)=\Sigma XP\left(X\right)=E\left(X\right)=P_1X_1+P_2X_2+...
What is the variance of a discrete random variable?
\sigma^2=E\left(x-\mu^2\right)=\Sigma\left(x-\mu\right)^2p\left(x\right)=p_1\left(x_1-E\left(x\right)^2\right)
What is the standard deviation of a discrete random variable?
\sigma=\sqrt{\sigma^2}
What is Chebshev’’s Rule for Discrete Random Variables? (applies to any probability distribution)
P\left(x-\sigma<x<\mu+\sigma\right)\ge0P\left(x-2\sigma<x<\mu+2\sigma\right)\ge\frac34
P\left(x-3\sigma<x<\mu+3\sigma\right)\ge\frac89
What is Empirical Rule? (applies to probability distributions that are mound-shaped and symmetric)
P\left(x-\sigma<x<\mu+\sigma\right)=0.68
P\left(x-2\sigma<x<\mu+2\sigma\right)=0.95
P\left(x-3\sigma<x<\mu+3\sigma\right)=1.00
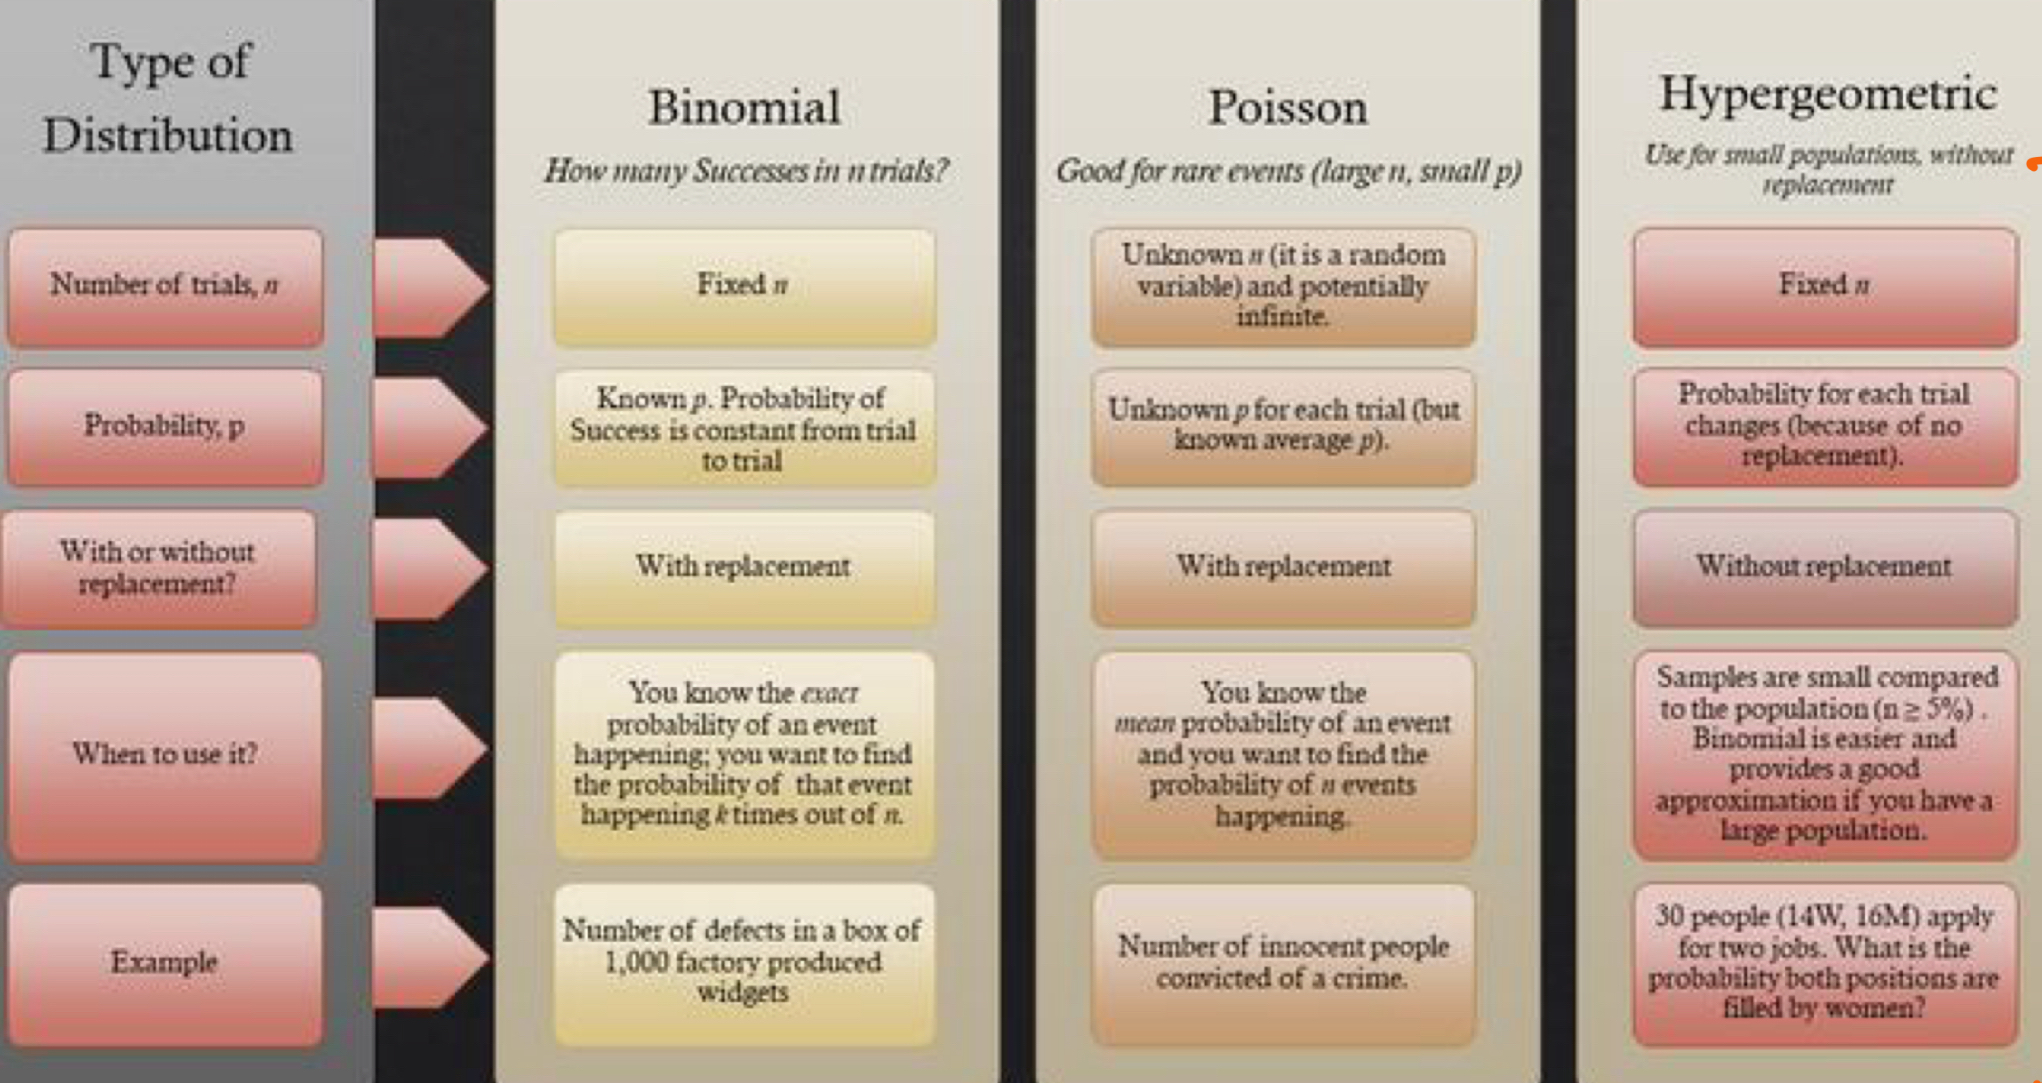
Many experiments result in dichotomous responses - two possible alternatives - if a random variable possesses these characteristics - then they are called binomial random variables
Characteristics:
experiment consists of n identical trials
there are only two possible outcomes on each trial. we will denote one outcome by S(for success) and the other by F(for failure).
the probability of S remains the same from trial to trial. this probability is denoted by p, and the probability of F is denoted by q. Note that q = 1- p
the trials are independent
the binomial random variable x is the number of successes in n trials
What is the formula for binomial probability distribution?
p\left(x\right)=\left(\frac{n}{x}\right)p^{x}q^{n-x}=\frac{n!}{x!\left(n-x\right)!}p^{x}\left(1-p\right)^{n-x}
What is the mean for a binomial distribution?
\mu=E\left(x\right)=np
What is the variance for a binomial distribution?
\sigma^2=npq
What is the standard deviation for a binomial distribution?
\sigma=\sqrt{npq}
What is Poisson Distribution?
applies to discrete
a number of rare events that occur in an interval
example: parts per million of a toxin found in the water
characteristics:
consists of counting number of times an event occurs during a given unit of time or in a given area or volume
the probability that an event occurs in a given unit of time, area, or volume is the same for all units
the number of events that occur in one unit of time, area, or volume is independent of the number that occur in any other mutually exclusive unit.
the mean number of events is denoted by \lambda
What is the formula for Poisson Distribution?
p(x) = \frac{\lambda^{x}e^{-\lambda}}{x!}
mean = lambda
What are the characteristics of hypergeometric random variable?
the experiment consists of randomly drawing n elements without replacement from a set of N elements, r of which as S’s (for success) and (N-r) which are Fs (for failure)
the hypergeometric random variable x is the number of S’s in the draw of n elements
p\left(x\right)=\frac{\left(\frac{r}{x}\right)\left(\frac{N-r}{n-x}\right)}{\left(\frac{N}{n}\right)}
\mu=\frac{nr}{N}
\sigma^2=\frac{r\left(N-r\right)n\left(N-n\right)}{N^2\left(N-1\right)}
N = total number of elements
r = number of S’s in the N elements
n = Number of elements drawn
x = Number of S’s drawn in the n elements
What is the importance of normal distribution?
describes many random processes or continuous phenomena
can be used to approximate discrete probability distributions
ex: binomials
basis for classical statistical inference
1. bell-shaped and symmetrical
2. mean, median, mode are equal
What is the probability of density function?
f\left(x\right)=\frac{1}{\sigma\sqrt{2\pi}}e^{-\left\lbrace\left(\frac12\right)\frac{x-\mu}{\sigma}\right\rbrace^{-2}}
What is the standard normal distribution?
a normal distribution with \mu=0 and \sigma=1
a random variable with a standard normal distribution is called a standard normal random variable
To find the probability that the standard normal random variable z falls between certain numbers, use the table
For example, to find if z falls between -1.33 and 1.33
we would go to the table to 1.3, then 0.3 to find .4082
P(<z<1.33) is P(.4082) so double for symmetry and get .8164
What does the “tail area” represent in a standard normal table?
the desired probability that z exceeds a certain number
How to use standard normal table for tails?
1. the standard normal distribution is symmetric about its mean, z=0
2. the total area under equals 1
so, take 0.5 - the number from the table to get your answer
How to convert a normal distribution to a standard normal distribution?
z-score!
What is the formula for z-score?
z=\frac{x-\mu}{\sigma}
Why is normal approximation of binomial distribution?
1. useful because not all binomial tables exist
2. requires large sample size
3. gives approximate probability only
4. need correction for continuity
What is discrete correction for continuity?
a ½ unit adjustment to discrete variable
used when approximating a discrete distribution with a continuous distribution
improves accuracy
Discrete Correction for Continuity:
P(x=n) then P(n-0.5 < x < n + 0.5)
P(x>n) then P(X > n + 0.5)
P(X\le n) then P(X < n + 0.5)
P(X < n) then P(X < n - 0.5)
P(X\gen) then P(X>n-0.5)
What is the good approximation rule
the interval \mu\pm3\sigma should lie within the range of the binomial random variable x
How to use normal distribution to approximate binomial probabilities?
Determine n and p for the binomial distribution, the calculate the interval
If interval lies in the range 0 to n, the normal distribution will provide a reasonable approximation to the probabilities of most binomial events
Express the binomial probability to be approximated by the form:
P(x\le a) or P(x \le b) - P(x\le a)
Ways to determine if data is from an approximately normal distribution?
look at histogram, if it is normal
compute intervals mean + s, mean + 2s, mean + 3s and determine if the percentages are near 68% 95% and 100%
Find if IQR is near 1.33
Look to see if normal probability plot is normal
What is uniform probability distribution?
continuous random variables that appear to have equally likely outcomes over their range of possible values
probability density function
f\left(x_{}\right)=\frac{1}{d-c}c\le x\le d
mean
\mu=\frac{c+d}{2}
standard deviation
\sigma=\frac{d-c}{\sqrt{12}}
What is exponential distribution?
the length of time or the distance between occurrences of random events
probability density function
f\left(x\right)=\frac{1}{\theta}e^{-\frac{x}{\theta}}\left(x>0\right)
mean
\mu=\theta
standard deviation
\sigma=\theta
Chapter 5
What is a parameter?
a numerical descriptive measure of a population. It is almost always unknown.
What is a sample statistic?
a numerical descriptive measure of a sample. It is calculated from the observations in the sample.

What is the sampling distribution?
the probability distribution of a statistic calculated from a sample of n measurements
What is a point estimator?
a rule or formula that tells us how to use the sample data to calculate a single number that can be used as an estimate of the population parameter.
If the sampling distribution of a sample statistic has a mean equal to the population parameter the statistic is intended to estimate, the statistic is said to be an unbiased estimate of the parameter.
If the mean of the sampling distribution is not equal to the parameter, then the statistic is a biased estimate of the parameter.
Mean of the sampling distribution equals mean of sampled population
\mu_{x}=\mu
Standard deviation of the sample distribution equals:
\sigma_{x}=\frac{\sigma}{\sqrt{n}}
What does the central limit theorem state?
when n is sufficiently large, the sample distribution will be a normal distribution
x̄ is the minimum-variance unbiased estimator (MVUE) of \mu
If n \ge30, then normal approximation is reasonable