Types of Maps - Explained - A.P. Human Geography Concept
Isoline Maps - Connects with lines all of the places that have particular values
Example - Sea Level Map (below)

Dot Distribution Map - a map that shows data as points and shows how these points are distributed
Example - U.S. population map (shown below)

Graduated Symbol Map - a map that shows symbols that change in size according to the value of a variable
Example - US Oil Consumption (shown below)

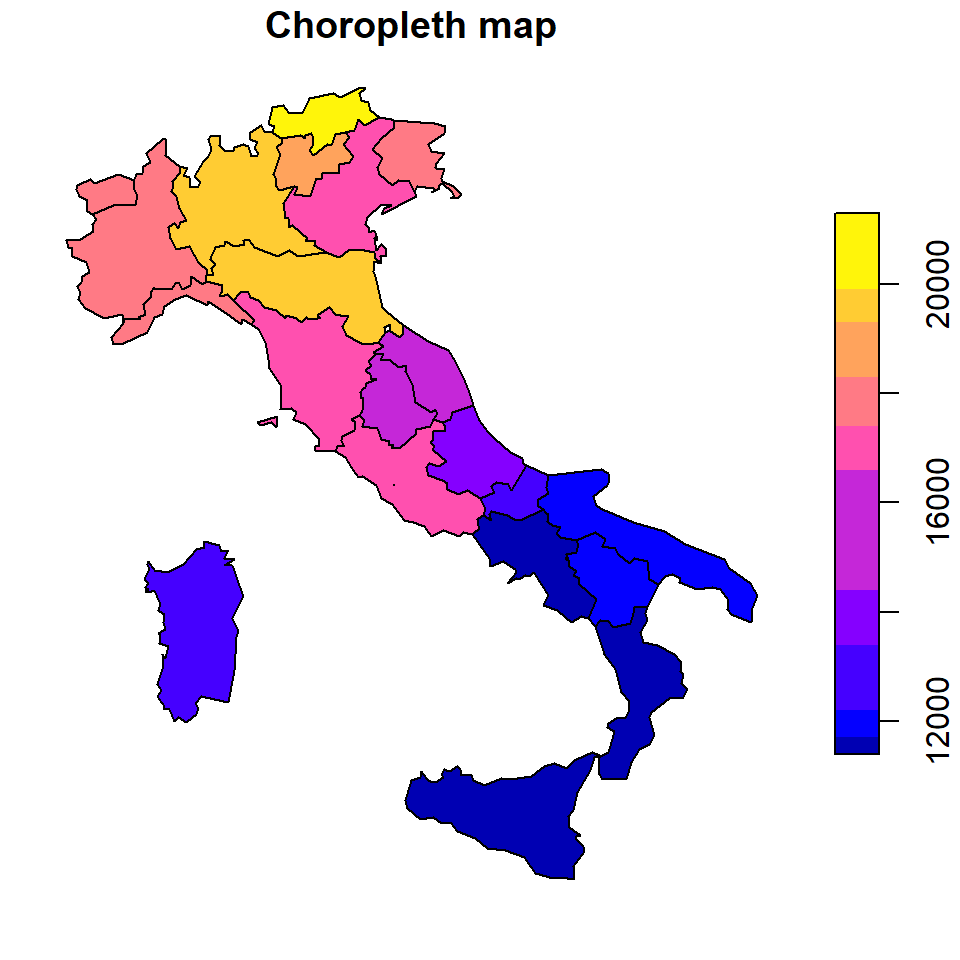
Chloropleth map - a map where different shades of colors represent different values
Example - Italy Population Map (shown below)
Cartogram - a map where the size of an area is proportional to the value of the variable
Example - world population map (shown below)
The bigger a country’s population is, the bigger the area becomes.

VIDEO TO HELP EXPLAIN
(he also covers flow line maps & topographic maps, in addition to what is in these notes.)