Ruhi's Research Final Notes
[ ] ==Scientific Method==
Steps
- observe and ask a question
- observe something in the material world using your senses or machines
- ask a question about what you observe
- do background research
- construct your hypothesis
- predict what you think the answer to your question might be
- should relate back to research question
- test your hypothesis with an experiment
- figure out a way to test if your hypothesis is correct
- outcome must be measurable
- analyze your data and draw a conclusion
- repeat the experiment to confirm your results by retesting
- report your results
- state whether your prediction was confirmed or not and try to explain your results
- hypothesis cannot be proven, only supported
Parts of a Valid Experiment
- contains quantitative data
- measurable, numerical
- multiple replicates
- at least 3
- positive control
- gives predictable results
- negative control
- one group that lacks in what is being tested
- independent variable
- conditions you manipulate
- dependent variable
- conditions that you measure
- constants
- conditions that are purposely not changed and are kept constant between all groups tested
Hypothesis/Theory/Law
- hypothesis
- inferred explanation of an observation or research finding
- based on existing scientific knowledge
- possible answer to a question
- theory
- hypothesis that has been tested and supported many times
- based on large amounts of data collected over time
- can be tested and refined by additional research
- allow scientists to make predictions\
- law
- expression of a mathematical or descriptive relationship observed in nature
- must hold under the specified conditions without exception
[ ] ==Microscope Basics==
Cell Size and Scale
- small molecule→ virus→ bacterium→ animal cell→ plant cell
Using Microscopes to Study Cells
- all living things are made up of one or more cells
- cells are most commonly observed using a light microscope
- electron microscopes are used to see even smaller structures
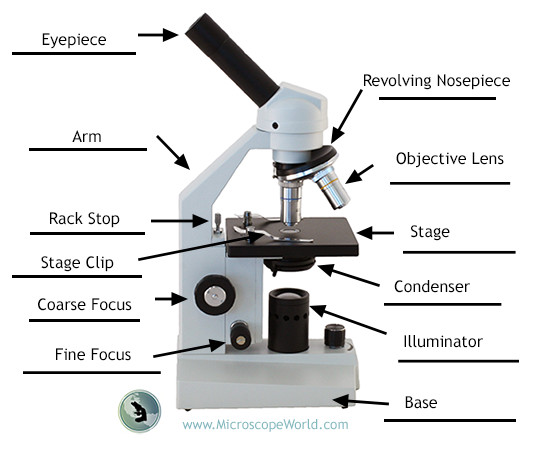
Parts of a Microscope
- eyepiece/ocular lenses
- objective lenses
- diaphragm
- light source
- stage
- stage clips
- neck/arm
- base
- coarse and fine adjustment knobs
Rules for Microscope
- hold properly
- 2 hands
- by base and neck
- upright
- never touch the lenses with anything but lens paper
[ ] ==Microscopy==
Determining the Size of a Specimen
- micrometer
- ruler
- built into the ocular lens
Field of Vision
- based off the 40x field
- 100x is 2.5 times smaller
- 400x is 10 times smaller
[ ] ==Serological==
Measuring Volumes
- tools to measure volume
- graduated cylinder
- volumes larger than 10ml
- serological pipet
- volumes smaller/equal than 10ml
- 1ml, 2ml, 5ml, 10ml
- graduated from top to bottom and bottom to top
- micropipet
- volumes less than 1ml
How to Use a Serological
- firmly put the glass tube in the pump and slightly twist to seal
- do not apply to much force
- roll wheel up with thumb to take up liquid
- roll wheel down to dispense liquid
- trigger is used to completely dispense
- take the glass tube out of pump carefully
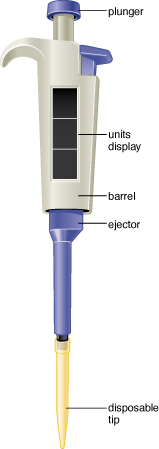
[ ] ==Micropipette==
Labeled Micropipet
P-10
- 0.5ul to 10ul
- used with small white tips
P-20
- 2ul to 20ul
- used with small white tips
P-100
- 10ul to 100ul
- used with medium yellow tips
P-200
- 20ul to 200ul
- used with medium yellow tips
P-1000
- 200ul to 1000ul/1ml
- used with large blue tips
Multichannel Pipet
- allows several samples to be measured at the same time
Taking Up a Sample
- before picking up the micropipette, open the tube of the cap from which liquid is being taken
- gently push the micropipette into the proper size tip
- close box right after to prevent contamination
- hold micropipette in one hand at a 45 degree angle
- hold container you’re drawing from in other hand at eye level
- push down to the first stop
- hold this position and place the tip into the solution
- slowly release the plunger while the tip is still in the solution
Expelling a Sample
- keep holding pipette in one hand at 45 degree angle
- open the cap of the tube container you’re filling with other hand
- hold container and micropipette in separate hands at eye level
- gently touch the inside of the wall to get rid of excess liquid
- slowly push the plunger down to the first stop and then continue to the second stop
- hold plunger down to second stop till the pipette is removed from the tube
- press the eject button and the tip will shoot off
[ ] ==Making Solutions==
Mass/Volume Solutions
- often in g/ml
- formula
- g/ml x ml
- example
- Q: The Red Baron has a sore throat. The doctor told him to gargle with a salt solution of 10 g/ml. How much Sodium Chloride (NaCl) does he need to add to 25 mls of water to get a 10g/ml solution?
- A: 10g/ml x 25ml = 250g
% Mass/Volume Solutions
- 1% solution will always be 1g in 100ml
- formula
- % → g/100ml = xg/ml
- example
- Q: How much agarose is in 500mls of 2% agarose solution?
- A: 2g/100ml = xg/500ml = 10g
Molar Solutions
- always do these calculations by converting the volume to liters first
- formula
- g = mol/L x g/mol x L
- example
- Q: How would you make 300ml of 4M CaCl2? (molecular weight = 111.1g/mol)
- A: g = 4mol/L x 111.1g/mol x 0.3L = 133.32g
Diluting a Concentration
- formula
- (C1)(V1) = (C2)(V2)
- example
- Q: How do you prepare 40 mL of a 2 mg/mL protein solution from 10 mg/mL protein solution?
- A: (10mg/ml)(V1) = (2mg/ml)(40ml), V1 = 8ml
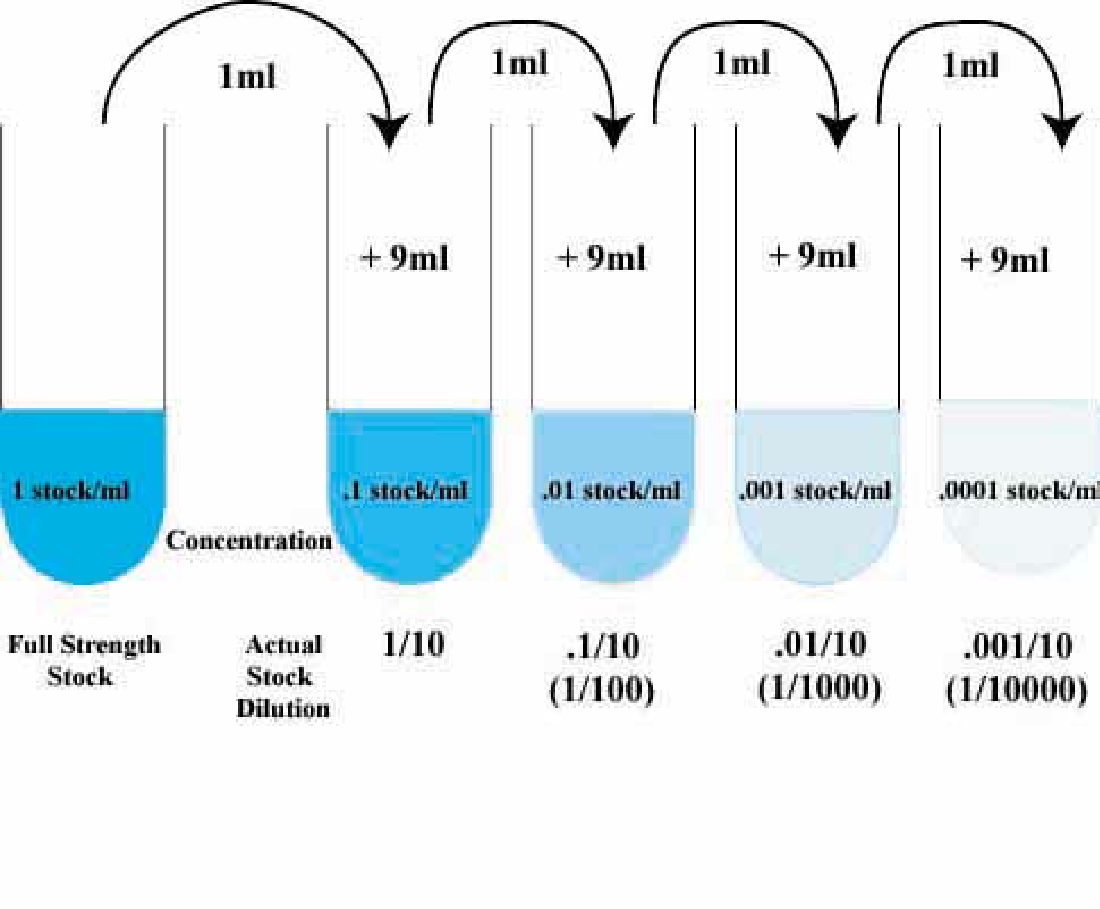
Serial Dilutions
[ ] ==Excel Graphing==
Variables
- independent
- value being changed
- dependent
- observed result of changed value
- qualitative
- category, not measured
- ex: type of plant (bean or corn)
- quantitative
- one that can be measured
- ex: height, number of leaves in a yard
- discrete variable
- discrete points on a scale
- ex: people can have 3 or 6 kids not 4.53 kids
- continuous variable
- decimal number, scale is continuous
- ex: a response time could be 1.64 seconds as well as 1.64237123922121 seconds
- graphing independent and dependent variables
- x axis = abscissa
- independent variable is graphed on x axis
- y axis = ordinate
- dependent variable is graphed on y axis
- most broad to most narrow sections
- tabs, ribbons, groups
- individual space is called a cell
- grabbing a bunch of cells is called a range
- worksheets within the workbook
- “wrap text” displays the text in multiple lines rather than one long line
- to combine cells into one cell use the “merge and center” function
- dotted line on the Excel sheet marks the boundaries of the printed page
- start with “=” when writing a formula
- autosum function
- adds all the numbers in the selected range
[ ] ==Statistics==
Measures of Center
- mean
- average of values
- found by adding all values and dividing by the amount of values
- formula
- (∑x)/n
- ∑ = sum of
- x = each value in sample
- n = number of values in sample
- example
- Q: find the mean: 5.40, 1.10, 0.42, 0.73, 0.48, 1.10
- A: 1.538
- median
- middle value when data is organized from low to high
- found by arranging the data in order, and if the number of values is odd the median is the middle number, but if the number of values is even it is the average of the two middle numbers
- example
- Q: find the median: 5.40, 1.10, 0.42, 0.73, 0.48, 1.10
- A: 0.915
- mode
- occurs most often in the data set
- if two values occur the same amount of times it is bimodal
- if multiple values occur the same amount of times it is multimodal
- example
- Q: find the mode: 27, 27, 27, 55, 55, 55, 88, 88, 99
- A: 27 and 55 (bimodal)
- midrange
- (high value + low value)/2
- example
- Q: find the midrange of 5 and 15
- A: (5+15)/2 = 10
Measures of Variation
- range
- difference between the maximum and minimum
- high value - low value
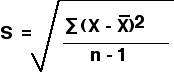
- standard deviation
- calculates how far values vary from the center
- formula
- ∑ = sum of
- X = each value in sample
- X ̄ = mean of sample
- n = number of values in sample
[ ] ==T-Tests==
Null Hypothesis
- assuming that there is no difference between two groups
- then a t-test is used to either accept or reject the null hypothesis
P-values
- probability that the data sets are the same and not statistically different
- if p > 0.05, then there is no statistical difference and the null hypothesis is accepted
- if p < 0.05, then there is a statistical difference and the null hypothesis is rejected
Null Hypothesis vs Hypothesis
- may be the same but won’t always be the same
- null hypothesis always states that there is no difference while your hypothesis can say otherwise
Tails
- one tail
- “greater than” or “less than”
- looking for change in only one direction, only either greater or lesser
- example
- looking at group of a bunch of seeds and growing them with mtn dew and seeing if they grow
- two tail
- “greater than” and “less than”
- looking for change in any direction, can be greater, lesser, or equal
- example
- looking at a brand of cereal 10 years ago and that same brand in the present and seeing if the sugar content increased, decreased, or stayed the same
Types
- type 1
- paired
- pretest and posttest
- type 3
- normal controlled experiment
- example
- if you test one set of plants with a miracle growth fertilizer and another set of plants a normal fertilizer, then see which grow more
[ ] ==Biological Literature==
Definition
- any printed or electronic document written with the intent of communicating biological information
Primary Literature
- contains original research from the scientist
- reports results that have never been published before
- includes new findings discovered by authors’ research
- includes a “materials and methods” section
- examples
- patents, theses
Peer Review
- before research results are published in a scientific journal, they must pass a rigorous assessment by other scientists called peer review
Secondary Literature
- after a research article is published, information from it may be summarized and analyzed in books and review articles by other authors which are secondary literature
- instead of presenting new information, they evaluate already published research
- lacks a “materials and methods” section
- examples
- textbooks
- review articles
Tertiary Literature
- does not have a “materials & methods” section
- aim to provide a broad overview of a topic or data, often presented in a convenient form
- examples
- guidebooks
- many websites
10 Parts of a Primary Research Article
- title
- by-line
- author
- abstract
- short summary
- introduction
- presents research question
- explains context of research
- materials and methods
- discusses how research was conducted
- results
- presents results, often in table or chart format
- discussion
- explains how the results of their research have addressed their research question
- acknowledgements
- thank you, thank you
- references
- publications that the author cited
- date of receipt/publication
- date article is submitted to journal and finally approved
Quizlet: