Soil exam #2
al1/22/24
Soil connects all spheres of earth's functions
Hydroponics system for a plant
Water intake/ transpiration to survive as well
Nutrients - macro and micro
Temp / air support and oxygen and CO2
Sun
Physical support - an anchor for root systems
Protections from toxins
CHONSP
Carbon, hydrogen, oxygen, nitrogen, sulfur, phosphorus
Make up >95% of all living tissues
CHO are gotten from air and water
NSP are derived from soil
Integrating components of soil
Sand, clay
Composition of an ideal soil by volume
Sand, silt and clay
All behave differently in soil because of their surface area to mass ratio
Smaller particle size gives rise to greater surface area per unit mass in turn increasing particle’s interaction with each other, water and nutrients.
Detritus, roots, microbes - organic part of soil
Organic part of soil
Wouldn't pass a 2mm sieve
Soil Organic Matter (SOM)
Foot source for most soil microorganisms
Source of soil fertility
Profound effects on soil structure and water storage
We can see particle size distribution based on organic matter concentration
Eolian, Pedon
Larger product of soil formation/classification
Solid formed on parent material transported by wind (eolian)
Soil ped - layers of soil
Integrating components of soil
Water
Soil water
Soil stores precipitation and irrigation, making water available to plants between rainfall or irrigation events
Retains water between precipitation events
1/24/25
The rock cycle
Areas can have different rocks due to different types of additions to the soil and actions
Metamorphic rock can be caused by tectonic activity and heat
Weathering proceeds continually at the surface of the earth changing rocks and minerals into
Smaller versions of themselves (Via Physical disintegration)
Temperature - variable expansion and contractions of different minerals which can be accelerated by ice
Abrasion - rock particles collide with each other due to the action of water, ice and wind
Chemically altered versions (via chemical decomposition)
Six main processes of chemical decompositions
Hydration, hydrolysis, dissolution, acid reactions, oxidation reduction, and complexation
They occur in presence of water and water is often a reactant
Some of them occur due to the presence of acids produced by roots, microbes, or air pollution (organic or inorganic)
Their products can be new minerals, or can be solutions
Rate of chemical decomposition increases with surface temperature and area
What area would you see more weathering? Rainforest or Desert?
Weathering: Breakdown of rocks into smaller pieces or transformation into chemically altered versions of themselves
Erosion: Transport of rocks, sediments, and soils from one location to another
Hans Jenny’s 5 soil forming factors (CLORPT)
S = f’(cl’,o’r’p’t’)
Parent material (p’) / r / regolith
Alluvial - transported by streams or rivers
Stream water erodes and transports parent materials which are then deposited when water slows own
Intermittent nature of flooding can lead to layering of parent material deposition
Generally, alluvial soils have characteristics desirable for human settlement
Nile delta, willamette valley oregon
Lacustrine - deposited in lakes
By the time sediment is carried to the middle of a lake, only smaller particles remain
Therefore lacustrine deposits are devoid of coarse particles such as coarse sand or gravels
They also are characterized by thin layers that reflect annual deposition of sediments
Slump / bedrock
Marine - deposited in oceans
Marine deposits can be formed from eroded sediments
They can also be formed from the accumulated bodies of marine algae (coccolithophores - armored ocean algae) which when uplifted can form limestone cliffs
Colluvial - transported by gravity
Are not set down and sorted, the different sizes are all intermixed
Eolian - transported by wind
Wind transported material can be any size (sand, silt, clay)
Eolian deposits can be in a homogenous unit or can exhibit some layering
Arid environments are most commonly associated with aeolian sand deposits, while glaciers are associated with more loessal (silt) deposits
Glacially-transported materials - till, moraine , outwash
Till = unsorted debris deposited directly by ice
Moraine = landform of debris left by glacier
Outwash = debris sorted by meltwater
Glacial loess - parent material that is physically weathered by ice into silt, then transported by wind, laid down in homogenous deposit, no layering
There are both Erosional and depositional landforms - we focus on the depositional landforms transported soil parent materials.
Organic parent materials
Peat bog with materials that would break down instead take content of peat ~
CLIMATE
Wetter and wetter conditions create deeper soil profiles and greater excited of mineral weathering because
Biochemical reactions increase with temperature doubling with every 10 degrees C
Water is a key ingredient for chemical weathering
To fully promote soil development water must not nly … participate in weathering reactions but also percolate through profile to translocate soluble weathering products
At given site with 600 mm of rain effective rainfall (the water weathering the profile ) could vary depending on
the seasonal distribution of rainfall
Topography of an area
Temperature and evaporation
Soil permeability
Which of the following scenarios would you expect to have greater effective distribution
Soils contain organic matter which contains carbon, plants get most carbon from soil —- FALSE
Organisms
Plants add organic matter to soil (while living and when they die)
Different climates exercise an influence on soil formation
Directly through their influence on water availability for weathering
and indirectly - through modifying plant productivity and therefore, quality of organic matter that plants can return to soi
Eastern hemlock vs sugar maple
Sugar maple has calcium content of 5x vs hemlock has 1x because they transfer their calcium to roots vs leaving in leaves
Subsoil fine root abundance << subsoil fine root abundance bigger in sugar maple soil
Sugar maple mines subsoil for Ca =, transporting it to leaves, whos leaf fall then helps to create organic - matter rich topsoil which then retains Ca (relative to hemlock)
Bioturbation - disturbance of sediments by living organisms
Krotovinas - an animal burrow that has been filled with organic material or mineral from another soil horizon
Darker areas in Bk horizon are crotovinas which are animal burrows filled with natural soil
Relief or topography
A catena is a sequence of soils down a slope with solid identified in 5 consistent positions
Summit - top of hill
Residual parent material
Shoulder - slope
Redidual/colluvial
Backslop - steepest
Colluvial
Footslope- towards bottom
Colluvial
Toeslope
Alluvial
Aspect
Northern hemisphere slope facing south, exposed more to sunlight and will have less organic matter and will be less weathered compared to north facing
Time
Processes that happen over time
Four soil forming processes happening in time
Additions
Organic matter from plants (carbon is coming from atmosphere)
Wind blown dust
Salts dissolved in groundwater, that rise to surface with evaporation
Losses
Leaching of dissolved materials to ground water
Erosion of surface materials
Transform to gas (Volatilization, microbial respiration)
Translocations
Movement of material vertically or laterally
Dispersed fine clays dissolved salts dissolved organic matter
Usually due to water, which could be downward (Gravity) or upwards (capillary action rise)
Transformations
Chemical or physical transformations of soil constituents, to synthesis of new compounds
Often, new silicate clays or hydrous oxides of Fe and Al
Also, decomposition of plant inputs into soil organic matter
The soil profile
A vertical section of soil showing the various horizons from the surface to the unaffected parent material
A horizon is “A layer, approximately parallel to the surface of the soil that is distinguishable from adjacent layers by a distinctive set of properties produced by the soil process
O horizon - organic material not mixed with minerals
Oi - decomposed organic matter
Oe - moderately decomposed organic matter
Oa - highly decomposed organic matter
A horizon, highest density of root growth, leading to organic matter deposition from roots
E horizon - zone of eluviation, or leaching must be underlain by B horizon, but can be in place of an A horizon
B horizon - a zone of illuviation - or accumulation due to the leaching from above horizons of: Fe and Al oxides, Ca carbonate and Ca sulfate
C horizon - less affected by soil forming processes + outside zone of major biological influence; may have accumulation of Ca, MG, carbonates, sulfates
R/ (Regolith) = unaltered parent material - likely rock
Why do E horizons occur in forest but not in grassland soils
Possible reasons:
Greater rainfall in forests -> greater effective precipitation for leaching
More acidic leaf litter in forests (compared to more neutral pH roots of grasslands -> more organic acids in leaching processes
Organic inputs more stratified to O horizon (from leaf fall) rather than distributed throughout surface soil ( as in grasslands) → fewer high-activity surfaces in surface soil
Time as a soil forming factor
Warm humid climate residual parent igneous material
Soils generally develop more prominent layers over time
Warm, subhumid climate
Calcareous loess parent material
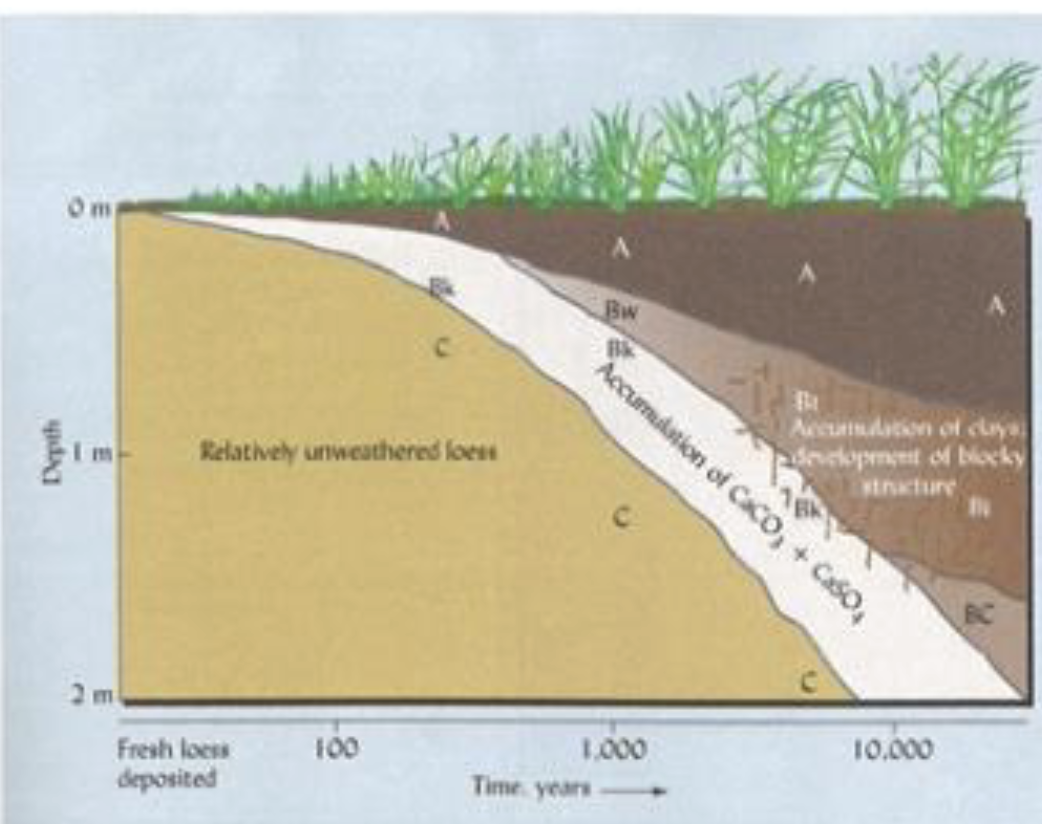
“Weathering age” is distinct from chronological age
Parent material could be exposed for a long time, but in some environments insufficient water for soil development vs
Warm humid environments with abundant vegetation would accelerate soil weathering
Think of CL O R P T, rather than CL + O + R + P + T
Transition horizons and subdivisions within horizon
Transitional horizons that combine properties of two horizons, dominant listed first
Subdivisions within horizons
Used to differentiate differences in structure or color within a master horizon.
Sub Horizons - More specific designations of master horizons but their formation can be pronounced
EX;
b - buried horizon
Ap - ploughed horizon
k - accumulation of carbonates
kk- engulfment of carbonates
t - accumulation of silicate clays
w - Distinctive color or structure without clay accumulation
Soil Classification 1
Humans like to organize things - taxonomic classes of plants/animals
World reference Base (WRB)
An international system for soil classification, supported by FAO, UNESCO and other orgs
Soil Taxonomy
Developed by USDA, most commonly used in U.S. because we have to be different…
6 Taxonomic levels in USDA soil
Criteria for classification encompass chemical, physical, and biological processes
Temperature and moisture status throughout year
Color, texture, structure of soil
Contents of organic matter, aFe, Al, SIlicate clays, salts, the pH
Precise soil classification using this taxonomy may be expensive or time consuming
Cation Exchange Capacity (CEC)
Fundamental soil property
Plant nutrient availability and retention
Total quantity of negative surface charges
Sum of cations: base cations + acid Cations
(Ca+Mg+K+Na)+(H+Al)
Base saturation
Percent of CEC occupied by base cations
Base saturation (%)
=(Ca+Mg+K+Na)/CEC
Increases as pH increases
Diagnostic horizons
Horizons whose presence or absence indicates a soil’s location in the taxonomy
Epipdeon
Surface diagnostic horizon
A,E, or sometimes upper part of B
Subsurface diagnostic horizon
Usually B, sometimes E or C
Mollic Epipedon
From latin mollis, Meaning soft
>0.6% organic C
Generally >25cm thick
Softness even when dry
High base saturation (>50%)
Moist at least 3 months of the year
Characteristic of grasslands
Umbric epipedon
From latin Umbra, meaning shade
Similar to the mollic epipedon EXCEPT
%base saturation is lower
Develops in higher rainfall areas and w parent materials low in Ca and Mg
Ochric epipedon
From greek ochros, pale
Too thin
Too light in color or
Too low in organic matter to be mollic or umbric
Due to low organic matter content, may be hard and massive when dry
The “wimpy” a
Histic epipedon
Greek Histos tissue
A thick surface organic horizon that is 20-60 cm thick overlying mineral soil
Formed in wet areas, it is a layer of peat or much with very dark color.
Diagnostic subsurface horizons
Important for illuvial material to have been transported
and
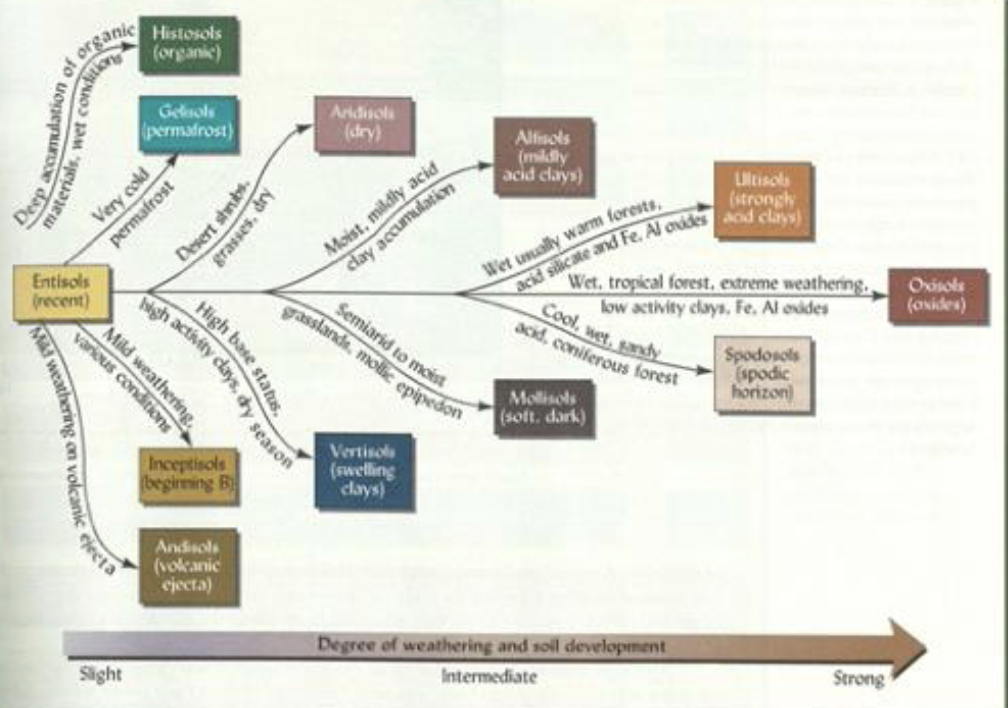
Entisols
Recent soils: mineral soils with little to no evidence of pedogenic horizons
No diagnostic horizon other than ochric epipedon
Found on landscapes where soil parent material is in no place long enough to pedogenetic processes to act
Inceptisols
More strongly developed soil profiles than those of entisols, but too weakly developed to meet criteria for any other soil horizon
Ochric or umbric epipedon, cambic horizon
Gelisols
Greek gelic, very cold
Permafrost present within specified depth
Over permafrost, gaelic materials “mineral or organic soil materials that show evidence of cryoturbation (frost churning) or ice segregation
May have diagnostic horizons
Cryoturbation
Mixing of materials form various horizons, down to bedrock, due to churning actions of repeated freeze/thaw
Andisols
Jap. ando, black soil
Soil developing pon volcanic ejecta
Dominated by allophane and “al-humus” complexes
Accumulation of organic matter complex with Al
May have diagnostic horizon and occur at any temp, or moisture, or elevation
Aridisols
Latin aridus - dry
Dry environment: no period of 90 consecutive days when moisture is contoniusly available for plant growth
Ochric epipedon, sometimes argillic or natric horizon
Histosols
Gk, histos , tissue
Accumulation of organic material due to wetness (in absence of permafrost)
Organic material is more than half of top 80cm
Can occur in any climate but most prevalent in cold
Precursor to coal
Usually bog like
Vertisols
L. Verto, turn
Dark swelling and cracking clay (>30% clay)
Problematic for constriction of any sort
Challenging for agricultural use: “24 hour soils”
Shrink/swell can impede infiltration in wet vertisols
Alfisols
Occur in cool to hot humid areas, usually forested
Diagnostic sub horizons: Bt or Btn, >35% base saturation
Overlain by ochric or umbric epipedon
trees
Mollisols
L, Mollis, soft,
Accumulation of organic matter form grassland root systems; rich in Ca
Have a mollic epipedon
May have argillic, natric, or cambic subsurface horizons, but NOT oxic or spodic horizons
Prairies with old grasses with deep roots
Ultisols
L. Ultimus, last
Weathering of clays + leaching of base cations
Old land surfaces in moist warm climates
B horizon with <35% base cations
FOund on land surfaces that have been recently exposed - hillsides
Found predominantly in southeastern us
Spodosols
Gk, spodos, wood ash
Intensive acid leaching of coarse textured parent material
Diagnostic horizon : spodic horizon - the illuvial accumulation of Fe,Al oxides and/or organic matter
Often overlain by E horizon
Often in forests because of all of the plant material that lives on the topsoil
Spodosols do derive their name from wood ash, but the E horizon is not diagnostic of the spodosol, it is actually the Bh/Bs
Oxisols
Fr, Oxide - oxide
Most highly weathered soils in the taxonomy
Currently or historically humid and warm
Diagnostic horizon Bo
Epipedon : ochric or umbric
Usually uniform subsurface
1/3/25
Soil architecture & physical properties
Soil color
Soil color is influenced by three factors
Soil moisture
Soil organic matter
Soil mineral composition:
Calcite and soluble salts
Manganese oxides
Iron oxides, and their oxidation states
Soil is darker if
In a wetter state
Or higehr in SOM
Soil calcium or salts - lighter color
A Bk or calcic horzion formes from the illuvial accumulation of calcium carbonates
Redox reactions
Color of iron is modified by soil water status
S oil water status
- drier more oxidizing environment precense of oxidised iron
Wetter more reducing environment precense of reduced iron or loss or ifon grayish
Things such as bus burrows, cause Macropores that can get oxidized, retained higher water status in past and now have
Soil texture = size of mineral particles in soil
Soil texture triangle
The soil with more fine particles have a greater soil surface area than soils with coarser particles
Assessing texture in lab - using a hydrometer which has a weight and ruler which shows how soil particles are suspended in water
Assessing soil texture in field using fingers and hands
Soil architecture, soil structure = the arrangement of particles in soil
Asseesion soil texture
2/5/25
Bulk density and particle density - concept and calculation
Density of a single chocolate candy = 1
Density of jar of chocolate candy >1 or <1 - less than one because solid particles have air in between them
Density of soil solids = particle density Dp or ⍴p
Density of soil inclusive of pore space = Bulk density Db or ⍴b
Bulk density measurements
Requires sampling the mass of a precisely defined volume of soil
Vertical soil core from surface
g dry soil/cm3 core volume = Bulk density, g / cm3
g/cm3 = Mg/m3
Bulk density calculations
Given a core volume of 98.17 cm ^3
Calculated from core radius 2.5cm and core height of 5cm and a volume of cylinder equation 𝜋r2h
And a soil sample dry mass within the core of 128.3 g,
Calculation of soil mass per area
What is the mass of soil the 0-15cm layer in a hectare, if the bulk density is 1.21 Mg/M^3?
(1.21Mg/m^3) x (10,000m^2/ha)x 15m = 1,815 Mg/ha
Variability in bulk density across soils
BD increases with lower SOM higher and
Bd generally increases with depth, in part due to decreases in organic matter, also weight of overlying layers
Relationship between bulk density and plant growth is generally negative
Soils with lower BD have :
More pore space for water storage and air movement
Less resistance to root elongation
Are corrected with higher SOM
When plants arent able to carry out their root formation it can result in lower biomass, especially when bulk density is high they have lower organic matter
Bulk density responds to foot traffic
Ex: a campground
RIsks and rationale - tillage operations
Prepare seedbed
Incorporate residue
Control weeds
Loosen soil (reduce BD - in short term in tilled depths)
Subsurface increase in bulk density due to machinery : a plough pan
Wider wheel has less deep but wider compaction
Overcoming a plough pan: subsoiling, cover crops
Vulnerability to compaction
Bulk density - an imperfect measure of soil resistance encountered by roots
A dry soil is generally a hard soil
Mechanical Impedance - a less imperfect measure of root resistance
AKA penetration resistance or soil strength
Penetrometer measurements
Calculating soil porosity from BD and particle density
Soil pores differ in their:
Diameter
Macropores > 0.08mm > micropores
COnnectivity
Shown at left with yellow pores representing connected pores
here , horizontal pores not connected
Formation and function
Roots and fauna can create macropores
MIcropores retain water after drainage; transmit air form soil surface
Tillage increases proportion of soil pore volume in macropores
Further physical properties of soil
Atterberg limits and the coefficient of linear extensibilty (COLE)
Atteberg limits are internationally recognized for some soil classification schemes
And for defining solid for their engineering use
SHrink/ swells in vertisols
A vertisols in texas high degree of swelling can impede infiltration in wet vertisols
Atterberg LIMITS
As you add more water the combined mass of soil plus water gets larger obviously
Shrinkage limit
PLastic limit
Liquid limit
Compression and proctor test
Known applied force
Column of moist soil
Porpous stones on either end
Drop hammer and compacted soil at known water content
Gravimetric, Volumetric, energetic
WIll be expressed in volume of water +volume of soil
Properties of water
Cohesion - attraction of water molecules to each other
Adhesion - attraction of water molecules to solid surfaces
Structure of water molecule allows for
Leads to CAPILLARY ACTION
Activity of capillary in soil
Soil in arid environment sometimes have salts that were drawn from below ground that make it impossible for plants to grow there
Place glass tube in tub of water, surface of glass tube attracts water, forces of adhesion
Forms meniscus
Inversely proportional to the pressure on the surface of the liquid
Meniscus will go opposite way if there is a waxy surface
Capillarity
Can happen over a longer period of time in a finer texture soil
Gravitational potential of water
Water above reference point
Vs water at reference point
Increase in potential energy in between, arrow pointing up
Osmotic potential of water
Pure water with no solutes has a 0kPa
Meanwhile a solution with a little solute has a -100 kPa
Lots of solute will have -200kPA
Water always needs to move from higher to lower potential
Matric Potential
All of soil pores are 100% occupied by water
Downward motion of draining will occur
Some amount of water held between saturation
Remaining water is held against the force of gravity
what is capacity of a field to hold water against the force of gravity - force capacity
Evaporation - reducing thickness of water films in the soil and getting them closer to soil
Still water in soil plants cant extract— Unavailable water
Most tightly bound water - hygroscopic water
Boil off all water, but add water by puting it in a humid room
0 - Highest water matric potential a sample can have, can only get negative
Water held between field capacity and hygroscopic coefficient capillary water
Rules of thumb for defining these
At field capacity, air can be introduced into pore spaces (not shown here (
Water retention curve
At negative kPa
Why is kPa negative??
Because water always need to move from high to low potential, so its decreasing in potential
Because water is decreasing in water content and that is the number that is going down
LESS likely to move because the water adhesion is stronger
Volume of moisture available to plants is between between points B and C = between field capacity and permanent wilting point
Dotted lines = energetic states of water
The water retention curve WATCH OUT!!
Can be displayed with any orientation
MAtric potential is reporte din many units
kPa, hPa, Mpa
Bars
Cm or mm of water
Mm of mercury
Hysteresis
Patterns are manifested in one direction of change
Water is drawn up by narrow pores but capillary rise ceases when pore widens
Drying occurs when large pore remains full because of capillary attraction in narrow pore above
Points in soil retention curve will be different depending on the type of soil
Use of pressure plates to measure water content at known water potentials
You purchase a soil water sensor and install it in a greenhouse pot with abeautiful begonia in it
Sensor reads volumetric water content, and you calculate that there are 50g of water in pot, plant looks healthy
You conclude that after the pot lost 50g water it will be time to water the begonia again
Will your begonia be ok?
NO because if all 50 g of water in the plant there will be none for the plant, you would want to water it again instead before it gets to wilting point
CAlculating plant - available water in soil profile
Available water holding capacity (horizon_ = (Gravimetric water (fc) gravimettic water (wp)) x Db/Dwx depth
How much water might be lost in soil in a temperate climate
Even if more water is leaving through evaporation or groundwater, lots of water is coming back in as well through rain or streams
Increasing SOM makes it so that more water is available
Feasible increase in OM with long term cover cropping or perennial forages integrated into annual grain system represented by width of green box
Upper 20 cm of soil as upper land management with organic matter
Organic matter only affects top 20 Cm
Water infiltration\
Expressed as linear rate
Length (of water) / time
Important for hydrologic cycle
Measurement about environment an incorporates slope, texture and aggregation + soil features
Measured with double ring infiltromete
i= Infiltration rate
Q - volume of water infiltrating (M3)
A- area of soil surface (m2)
T = time
Saturated hydraulic conductivity (Ksat)
Darcys law describes quantity of water (Q) per time t that flows through column in figure 5.19
Where is the change in water potential between either ends of length L
You want to know potential energy gravitational, surface area, and amount of water it can hold
Interested in quantity of water moving through clay at a point
We can use this to calculate the quantity of water moving through soil over time
One way of visualizing conductivity./ water content over time
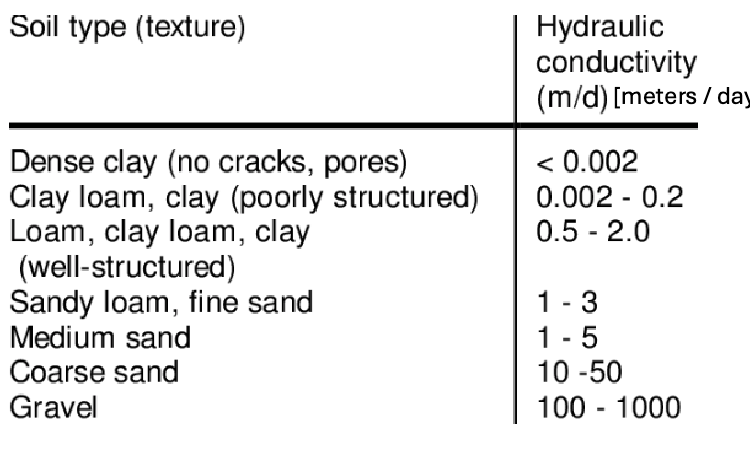
Texture and ksat
A clayey soil will have lower/smaller ##
Sandy will have higher as it will be faster
Macropores and cracks between clay → nonuniform water movement (aka preferential flow) → transport of nutrients of contaminants >> expectations from K sat
Use dye to measure this to see where the water moves the most
Unsaturated hydraulic conductivity
Most frequent type of water movement in soil
Primarily driven by difference sin matric potential
Always occurs from larger to smaller pores
Onec water potential is negative, macropores have drained out
Subsurface increase ein bulk density due to machinery: plow pan
DIfference in soil texture can prevent the movement in soil
Water movement in stratified soils
Coarser layer of stratification can inhibit water movement
Water not moving from loam to gravel
Water movement in stratified soil
2/12/24
Soils + the hydrologic cycle
Water balance
SS = P - ET - D
Evapotranspiration = evaporation + transpiration
Transpiration - loss of water from plants such as trees + grasses
Evaporation : loss of water from water bodies and land surface
Water balance over a year
Precipitation > ET surplus can go to soil storage groundwater recharge runoff
ET> Precipitation Drawing down stores soil water
Water balance over a year in an arid environment
This is because the ET is pushing up against precipitation, no opportunity for excess precipitation
Potential evapotranspiration
Amount of water respired from a well watered, densely vegetated system
Actual ET may not reach PET - because systems are not always well watered
Estimation techniques often incorporate multiple components of ecosystems (radiation, temp, wind, and atmospheric pressure)
Soil aeration
The process by which air in the soil is replaced by air in the atmosphere
A well aerated soil the soil air is similar in composition to atmosphere above and poorly aerated contain more CO2 and less O2
Soil aration in terms of gaseous composition of soil air
Soil aeration primarily controlled by
Soil water content
Soil mnacroporosity
Rate of O2 consumption in the soil
Influence of water on soil aeration
Soil water reduces soil aration
Because rate of O2 diffusion through water is many times slower than the rate of O2 diffusion through air
Water filled pore space
% water filled pore space = volume of soil water / volume of soil pores
Soil is saturated when water filled pore space = 100%
R
Rate of O2 consumption of soils
Micorbial activity involves microbial respiration which consumes O2 and produces CO2
Microbial activity increases with temp, up to a maximum
Therefore, rate of O2 consumption increases with temp
Aerobic soil = has oxygen
Anaerobic soil = lacks oxygen
Wetland soils
Wetland soils are water saturated for prolonged periods, when soil temperatures and other conditions are such that plants and microbes can grow and remove oxygen, thereby assuring anaerobic conditions
Wetlands have hydric soils
There are often Histosols
PLant adaptation to waterlogged environments aerenchyma
Aerenchyma: large intracellular structures (pore spaces) which extend through the entire plant and allow for storage and transport if gas to submerged roots
CO2 in soil air
soil CO2 concentrations are
A. Higher in June than in November
B. Lower in June than in November
C. The same between June and November Range
Rasnge of possible soil temp and their implications for soil processes
Daily variations in air temp near earth's surface is controlled mainly by the input of energy from the sun (yellow) and output of energy form the surface (blue)
Soil temp - dinural cycles
Huge range near surface
At 0.5 cm, > 20 C range
Max. temperature ~ 2pm
Dampened and delayed with depth
At 10 cm, < 6 C range
Max. temperature ~ 6pm
Negligible diurnal cycle at 80cm
Soil temp - seasonal cycles
Soil temps fluctuate more at surface than at depth
2/19./24
ALbedo - proportion of radiation that is reflected by a surface
High albedo, low albedo
Bare soil generally has a lower albedo (absorbs more heat than a soil with crop residue
Water will be cooler due to specific heat capacity
Specifc heat capacity: the amount of energy required to raise the temp of a unit of a substance by 1 degree C
Specific heat capacity of water and sand are different
A dry soil warms up easier than wet soil
Due to higher specific heat capacity of water compared to soil minerals
Soil temp in different tillage systems
2/22/24
Soil colliods - Organic and inorganic matter with very small particle size and a correspondingly large surface area per unit of mass
Sand silt clay are sometimes called soil separates
Soil texture is sometimes called soil particle size distribution
Soils with fine particles have a greater soil surface area than soils with coarser particles
Crystalline
Denotes a definite chemical compositions with planner surfaces and regular angles
Atomic arrangement of quartz shows planar surfaces and regular angles
However crystalline silicate clays in soil are not formed from disintegration of large crystals into smaller crystals
Crystalline silicare clays are among new minerals - pedogenic clay s
SOil colloids, including crystalline silicate clays contribute enormously to soils cation exchange capacity (CEC)
In cation exchange, cations absorbed to negatively charged clays exchange with cations in soil solution
Basic structural components of silicate clay
Tetrahedral and octahedral sheets stack in different configurations in the different types of crystalline silicate clays
1:1 tetra to octa hedral
A loose metaphor 1:1 clays are a stack of break and peanutbutter, low filling diversity
2:1 tetra to octa
2:1 clays are a sandwich with lots of fillings
Different layer structures of silicate clays
Biotite and muscovite micas are primary minerals, here we discuss secondary minerals also called micas
Crystalline silicate clays in context
Kaolinite - white gold - in industrial uses
Minimal shrink, preferred fr ceramics
Iron impurities make it red
Expanding 2:1 clays - smectite
Gives vertisols their shrink- swell
Have industrial applications
Where swelling when wet is needed to create seal
NON crystalline silicate clays
Allophane is a non crystalline silicate clay composed of Si, Al and O atoms, not arranged in crystalline sheets
Primary constituent of volcanic soils (andisols)
Processes leading to soil charge
Constant charge due to isomorphic substitution
The process of replacing one structural cation for another of similar size
Net charge difference is -2 from a Si +4 to Mg2+
Often in soil cations are replaced with less positive cation, leading to net negative charge
pH dependent change
2/26/25
Soil colloids 2
Review from last cass, what makes a soil colloid a soil colloid
Organic and inorganic matter with very small particle size and a correspondingly large surface area per unit of mass
WHat is a crystalline silicate clay
Denotes a definite chemical compositions with planner surfaces and regular angles
Atomic arrangement of quartz shows planar surfaces and regular angles
However crystalline silicate clays in soil are not formed from disintegration of large crystals into smaller crystals
What features distinguish the types of crystalline silicate clay
Iron and alluminum oxides
Here showing Gibbsite
An aluminum oxide clay common in highly weathered soils
Octahedral sheets hydrogen bonded together
Other oxide- type clays can have iron instead of aluminum, or be less crystalline structure
Organic colloids
Also known as soil organic matter
Non crystalline structure
-OH hydroxl groups
What happened to the dyes - yellow is more negative and bleu is more positive so blue sticks to the soil!!!!
Processes leading to soil charge
Constant charge - due to isomorphic substitution
pH-dependent charge
“Such as substitution [isomoprhic; reduction in charge ] commonly occurs in aluminum dominated dioctahedral sheets.”t
Another view of isomorphic substitution
Process through which structural cation and shapes are exchanged with similar cation that leads to a net negative charge
Processes leading to soil charge
pH-dependent charge
Hydroxl (-OH) functional groups exist on the edged of inorganic colloids and organic colloids alike
We can consider PH dependent charge by imagining the hydroxl group on the edges of clays and on organic compounds as a 2 car garage
House is the oxygen atom
Cars are hydrogen ions
PH as a reflection of hydrogen ion concentration in a substance
Decrease in soil ph is like a football game happening in the neighborehood
WHen there is 2 the charge becomes +1
Increase in soil ph is everyone is gone, charge becomes -1
More acidic - low ph - positive charge - greater anion exchange capacity
More alkaline - less acidic - high ph - more negative - greater ion exchange capacity
When we sum exchange sites in soil, we report units of charge per mass (soil or colloid)
For CEC, the sum is of negative charges
PH- dependent negative charge increases as soil pH increases although degree varies with soil colloid
As a function of soil ph
Key point
Weathering of clays follows a general trend in which:
2:1 clays weather into
1:1 clYS WHICH WEATHER into
Fe and Al oxides
Driven by leeching of silica and cations
Constant charge of soil colloid decreases with weathering →
Princinples of CEC that contribut to low CEC in southeastern US
Highly weathered clays developed under warm humic climate
ALso
Lower organic matter high decomposition rates
More acidic soils → ph dependent charge leads to anion exchange capacity
4 rules gocerning cation exchange
1. Reversabilty
WHat goes on may come off
2. Charge equivalence
One +1 cation for another +1 cation or two +1 cations or one +2 cation etc
3. Ratio Law
The ratio of two different cations in soil solution will equilibriate with those absorbed to exchange complex
4. Cation selectivity
SOme cations are held more tightly on exchange complex than other →
The view of cations floating in a solution by themselves is a simplification because cations are usually hydrated
hydrated radius describes the effective size of cation in solution
Measuring cation exchange capacity
Additon of NH 4 to soil
Replaces other action son the exchange matric these cations are leached into beaker and excess NH is removed with organic solvent
Very high concentration K+ solution is used to replace and leach absorbed NH4
NH4 and K+ have similar hydrated radii so ratio law comes into effect
Amount of NH4 leached from osil can then be quantified representing total negative charges )CEC) fron soil
WHy do we use NH 4 to measure cation exchange
Small hydrated radius makes it more likely to:
Replace larger more hydrated cations
Not be displaces by larger more hydrated cations
NH4 in solution can be easily measured
2/28/24
Mesuring cation exchange
Additon of NH 4 to soil
Replaces other action son the exchange matric these cations are leached into beaker and excess NH is removed with organic solvent
Very high concentration K+ solution is used to replace and leach absorbed NH4
NH4 and K+ have similar hydrated radii so ratio law comes into effect
Amount of NH4 leached from osil can then be quantified representing total negative charges )CEC) fron soil
WHy do we use NH 4 to measure cation exchange
Small hydrated radius makes it more likely to:
Replace larger more hydrated cations
Not be displaces by larger more hydrated cations
NH4 in solution can be easily measured
Soil organic carbon increases soil CECm and does this to greater extent in high pH soils
Soild higher in CEC - whether due to organic colloids, inorganic colloids, or both- have greater capacity to prevent nutrients cations from leaching
SOIL ACIDITY
Features of a log scale
1 each gardation of “1” on a pH scale represents a 10 fold difference in H+ ion concentrations
2. Absolute change in H+ iron concentration for 1 unit pH change is much greater on the acidic side than on alkaline side of scale
PH range of soils and other materials
To understand how acidity develops over time, where does it come from?
Sources of soil H+ in soil
Dissociation of carbonic acid from CO2
Process if molecules splitting apart
High concentrations of CO2 in soil are dissolve into soil solution which then forms carbonic acid, when then dissociates to bicarbonate and H+
DIssociation of acidic functional groups on organic matter (from plants)
Functional groups = specific groups of atoms within molecules that have their own characteristic properties regardless of the other atoms present in a molecule
Oxidation of ammonium (NH4) to nitrate (NO3-) releases two H+
Microbes oxidize NH4 as an energy source through process known as nitrification
This contributes to acidification of ammonium based fertilizers
Oxidation of sulfer
Either through organic matter that contains SH groups
Or through pyric oxidation FeS2
Input of acids in precipitation
Sulfur dioxide (SO2) and Nitrogen oxifes (NO) are released from fossil fuel combustion
Undergo atmospheric reaction to form acid rain
When dissolved in rainwater and dissociate
Generating acidity
Plant roots taking up cations then releasing H+ to maintain their charge balance
Plant roots cells need to maintain a charge balance across their cell membranes
Therefore if one positive charge (nutrient cation) goes in, one positive charge (H+ or other cation must go out
Plant roots taking up anions, then releasing bicarbonate HCO3 to maintain charge balance
Reduction of nitrate to nitrogen gas ( denitrification)
Types of soil acidity
Active: in solution
Exchangeable: held ner colloid surfaces
Residual: tightly bound to colloid surfaces
Active acidity is a very small amount of acidity compared to exchangeable and residual acidity.
Acid cations = cations that generate and H+ aqueous solution in soil, thes are H+ and Al3+
AL3+ generates H+ by hydrolyzing water and combining with resulting OH 0
One AL3+ can erelase up to three H+ ions
Soil pH will decrease but to a lesser extent of that of water if you ad 3cMol of acid to soil on pH
Because soil has a buffering capacity
Buffering: An addition of acidity will cause more acidity to move to exchangeable acidity in soil colloids so the addition of acidity is not fully reflected in active measured acidity
Mechanisms of pH buffering
Protonation and deprotonation of organic matter functional groups (R-OH)
Gaining or giving protons H+
Protonation and deprotonation of pH- dependent charge sites
Cation exchange reactions
Reactions of aluminum and carbonates
Soils become acidic when
H+ ions are added to soil
Thes H+ solutions exchange with nonacid cations Ca2_ Mg 2+, K+ Na+ held on colloids
Noncaid cations are leached way (bc they travel with anions)
In arid regions nonacid cations remain in soil and re-exchange with acid cations, preventing a drop in pH level
An acidic soil has an exchange complex dominated by acid cations
WHat about this soil propoerties might be different
Organic matter of inorganic colloids could influence buffering capacity which is why they are different, orange is sandier
L
L
Acidic organic material
High rainfall
Parent material low in nonacidc cations
Sandy soiuls (low buffering capacity)
3/3/25
Hydration of cations influences their effective radii, and therefore how easily they are replaced in a cation exchange
Larger hydrated cations have weaker bonds and therefore are replaced easily
Sources of H+
Respiration- dissociation of carbonic acid
Decomposition of organic matter
Oxidation of ammonium based fertilizers
Acid saturation
Recall percent base saturation
We calculate acid saturation using same approach
Acidity throughout the soil profile
Given The sources of H+, which pH graph would you predict is more likely found in a humid climate
Surface of soil is more subject to plant matter composition and weathering
More acidic in the higher soil and less acidic in the lower soil
Solubility of aluminum declines rapidly at soil pH above ~5.0-5.5
Inputs of acidic organic material mobilize AL3+
Fewer H+ sources; Al precipitates, contributing to formation of Bs horizon
Soil pH and crops
Some crops prefer acidic soils, some prefer neutral, some prefer alkaline soils
Justus von liebig's law of the minimum published in 1873
“If one growth factor/nutrient is deficient. Plant growth is limited, even if all other vital factors / nutrients are adequate…. Plant growth is improved by increasing the supply of the deficient factor /nutrient “
Modified truog diagram which purports to show nutrient availability across the range of soil pH:
Limitations:Width of band is not actual amount of nutrient
Even at widest part of band, nutrient may not be non limiting for plant
Even at narrowest part of band nutrient may not limit plant growth
Diagram implies that optimal soil pH is about 6.5, but crops can be highly productive outside this range
Even if topsoil pH is low, low ca, plants may uptake Ca from subsoils
Limitations; more recent
Plant roots and soil particles both have pH dependent charges and nutrient availability is mediated by both plant and soil charge
Evidence of plant uptake and colloid resorption following apparently opposite patterns
pH conditions with most absorption of colloid are same as pH conditions that make it best for plant uptake
Many unknown remain regarding role of pH in nutrient availability
Contrary to statement that remain popular in agronomic texts the soil pH cannot be used to predict or estimate plant nutrient availability
What is well established regarding mechanisms of crop preference for soil pH labels
Nutrient mineralization increases with pJ
More in N cycling later classes
Aluminum toxicity at low pH
Aluminum toxicity at low pH
At pH <5.5 aluminum is in the Al3+ form and competes with the essential nutrients like Ca 2+ Mg2+_ and K+ for negatively charged exchange sites
Plants can experience toxicity form taking up Al3+ and trying to use it in palace of Ca2+
Aluminum takes hydrogen and generates hydrogen irons and lowers pH
Aluminum takes hydrogen and generates hydrogen irons and lowers pH
Why do we lime soils
We lime soils because it helps us to neutralize soil acidity and increase soil pH
Acid cations in lime can replace cations in solution of soil
The greater the buffering capacity of soil the more lime is needed to realize the pH
Effect of limiting in raising pH is greatest in horizon is application
Evenbut dilute increase in pH
Liming generally needs to be repeated over time
because water and effects can change the liming effects
Alkaline = pH above 7 = more OH- ions
Alkaline soils are mostly found in arid reagions
Arid regions have limited sources of H+ due ot low biological activity
Arid regions experience limited leaching of Ca2+, Mg 2+ K+ and Na+
Features of soils in arid regions
Water limitation
Potential evapotranspiration > precipitation
PET - potential could be greater than what is actually evaporating
In arid environments theres a larger demand for water in environment
demand for water is greater than water that is going into soil s
Island of fertility
Plants protect soil from erosion and promote water infiltration and storage
Grazing animals concentrate manure to grazed areas providing more organic matter
leading to fertility to suppport more plant growth (start over at protection of soil )
Used for grazing
Requires less water input than rainfed crops
In some areas people irrigate soils in arid regions which can increase the risk of soil salinization
Process of soils accumulating excess salt= soil salinization
Salt affected soils:
~7% of earths land area,
23% of cultivates area
50% of irrigated area
Can have an extremely bad effect on food
Alkaline soils: pH above 7
Saline soil: high concentration of soluble salts
in exchess of 4 deciSiements per meter
Salts commonly found in soils and natural water and their solubilty (mmolc L^-1)
Key point: carbonate and bicarbonate based salts are usually lower in solubilty than sulfate and chloride based salts
We can understand related process of saline lake formation ex: great salt lake
Due to inputs of water with dissolved salts
evaporation of water
absence of exit pathways for salts
repeat
Formation of saline soils through the addition of irrigation waer
Saline irrigated soils form from:
Inputs of water with dissolved salts
evapotranspiration of water
Absence of exit pathways for salts
repetition of this process
Even freshwater has small amounts of dissolved slats which are concentrated in the soil
Measuring salinity
Separately quantifying all the salts is too labor intensive and expensive
Therefore, we rely on bulk quantification of salts through
Total dissolved solids (TDS)
electrical conductivity (EC)
Total dissolved solids extraction process
Extraction of dissolved salts in aqueous solution
filtration to remove soil particles
Evaporation of water (shown in diagram)
Weighing of remaining soilds
Electrical conductivity, principle
More rapid than directly quantification of TDS
Based on principle of salt water a s a good conductor of electricity
More salts in solution —> greater electrical conductivity
Conductivity, practice
Mix distilled water with soil until it flows slightly
allow salts to dissolved overnight or half an hour
extract solution and measure ec with electrode
report ec reported in deciSiemens per meter
Describes abilty of soil to conduct electrical current
SODIC SOIL
The soluble salts are primarily sodium
Sodic soils are high in sodium as the dissolved salt
Higher in sodium because its lower in calcium
Soil sodicity can be quantified with the exchangeable sodium percent (ESP) shown here
OR with the sodium absorption ration (SAR)
SAR= {Na+}/(0.5{Ca2+}+0.5{Mg2+})
This quadrant of salinity and sodicity
Sodic soils can have particularly high pH levels
due to reactions of sodium with carbonate and bicarbonate in solution which calcium and magnesium undergo to much lesser extent )
AND sodic soils have particularly poor structure
The charge to hydrated radius of cations influences soil structure
Sodium has a slightly smaller hydrated radius than calcium or magnesium but only half of the charge
Lets imagine a couple of soil colloid particles van der waals forces can contribute to their aggregation
Sodic soils - consequences of poor structure
Forms a crust almost on top of soils
The charge of hydrated radius of cations influecnes soil structure
Sodium has slighly smaller hydrated radius than calcium but only half of the charge
will increase or decrease soil aggregation?
Sodic soils
COnsequences of poor structure
Flocculated (aggregated) vs dispersed strucure, flocculated can allow water to move, disperesed plugs soil pores and impede water movement
3 distinct causes of low permeability under sodic conditions
Dispersion
Clay particles seperate from one another rather than flocculating
Slaking
Aggregate disruption upon becoming wet —> clogging of soil pores
Swelling
Sodium enhances swelling expanding 2:1 clays
hich relationship would
Which relationship would you expect between ESP and Ksat
ESP intereferes with Ksat
More ways salts can interfere with plant growth
Osmotic effects
Water moves from high to lowe
Higehr potential in non saline soil solution
lower potential in plant root due to solites lowering water potential
Water in soil and plant converges in potential
making it more difficult for plant rooots to remove water from soil
Specific ion effects - what they are
Like mushroooms - some are harmless and some are deadly
Some ions are fine (CA2+ K+)
some ions cayse problems (Na+, CL-)
Specific ion effects:sodium
Sodium is a quasi essential element
Required for some but not all plants
neededby corn, sorghum, and oter tropical grasses
Excess sodium in soil can become toxic because Na competes for K+ which is an essential element
Are all saline soils also sodic soils?
False
Reclamation strategies - saline soils
Cannot be reclaimed by chemical amendments, conditioners, or fertilizers
Field can only be reclaimed by removing salts from plant root zone
Opposing goals of irrigation
For regular irrigation: just apply enough water limitation on plant growth
for removing salts from root zone
Apply water in excess of what is needed for crop growth, so salts can move downward through soil profile and out of root zone
Efficacy of leeching
Reclamation strategies - sodic soils
Application of gypsum - which contains calcium
calcium replaces sodium held in cation exchange on soil colloids
then soluble salt, NASO4 is formed, which can be easily leached away
Exam review
Aluminum toxicity
Aluminum is positively charged ion that can bind to the cation exchange capacity as soil becomes more acidic and the soil pH decreased
Aluminum displaces beneficial nutrients from the CEC
Cation exchange capacity
A soils ability to like exchange cations and how many positively charged ions a soil can hold
Expanding 2:1 clays have higher capacities
Protonation
The proces of adding protons (H+) to function groups on soil surfaces, which can change soil pH and charge, this occurs more often in acidic soils
Alfisols
Soil is rich in aluminum and iron
Argillic, kandic, or natric horizion
found in more wet soils
Ultisols
Strongly weathered acidic soils found in humic regions
HIgh in pH and Al3+
Found in more temperate areas
You uncover archives of ancient civilization
Instead of 12 soil orders, they group soils into 3 categories based on base saturation
Low base saturation
Medium base saturaton
HIgh base saturation
Describe extent of soil weathering for each of these three soil orders
As soils beccome more weathered, base saturation goes down
so a more sautrated soil will be less weathered.
Mollisols
3/10/25
pH range of soils and other materials
Soil organisms - grouped by size
Macro-organisms (>2mm) > MESO - organisms (>0.1-2mm) > MICRO organisms (<0.1mm)
Worms, termites, mice > springtails, mites > tardigrades, nematodes, fungi, bacteria, archaea
Soil organisms - grouped by metabolism
Metabolic grouping of soil organisms based on source of energy and carbon
Source of carbon - combined organic carbon - biochemical oxidation
Chemoheterotrophs , all animals, plant roots, fungi, actinomycetes and most bacteria
Earthworms, fungi, water bears
What are most of these organisms getting their combined organic carbon from?
Both chemoheterotrophs and Photoautotrophs
Carbon dioxide or carbonate - solar radiation
Photoautotrophs plant shoots, algae, cyanobacteria
CARBON can be cycled through an intermediate consumer before it is consumed by Chemoheterotroph
Chemoautotrophs that use carbon dioxide and carbonate
Ammonia oxidizers and sulfur oxidizers
Are doing it as an energy source transformation
Getting carbon from inorganic sources
Trophic levels and energy transfer
Primary consumers in soil
Herbivores : eat live plants
Larvae of cane beetle which feeds on living sugarcane plants in all stages of life cycle
Detrivores: eat remains of dead plants and microbes on them
Saprotrophs: microorganisms that consume detritus, corpses and feces
Secondary consumers in soil
Carnivores : eat other animals
Microbivores feeder : eat microbes
Protozoa, which graze on soil microbes
Trophic levels and energy a( and carbon transfer) of belowground communities
Other microbes exist in soil that arent as involved in the soil organic matter
Process of transformation
Trophic cascade of aboveground communities
10% of energy is lost every time
SMall part of period is small itty bitty animals compared to plants as largest energy source