Association Rule Mining
General Overview of Association Rule Mining
- Association Rule Mining Definition
- Given a set of transactions, find rules that will predict the occurrence of an item based on the occurrences of other items in the transaction
- Co-occurrence in the same transactions, not causality
- 3 Goal(s) of Association Rule Mining
- Finding regularities in data
- What products were often purchased together?
- How many consumers with a checking account also have a savings account?
- Association Rule(AR)
- An implication expression of the form X → Y, where X and Y are itemsets
- Given: A dataset containing a variety of items, X, Y, Z, etc.
- Example(s):
- X → Y: database records that satisfy the conditions in X are also likely to satisfy the conditions in Y
- C → A: given C, how often dow A occur?
- A → C = given A, how often does C occur?
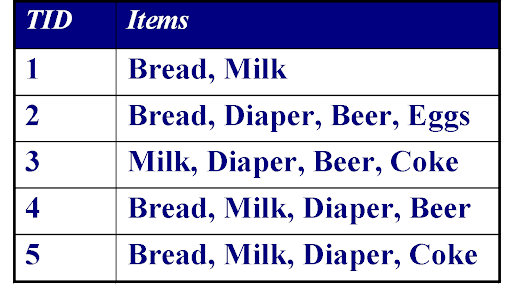
- Example of Association Rule datasets:
- Customer purchases
- system logs
- What question does the application of AR answer?
- Which items are likely to be purchased together?
- What business implications does AR bring:
- If products A and B often go together, then placing a more expensive alternative to B near the display for A can create an up-sell opportunity
- If products A and B are often purchased together, putting them on sale at different times can drive purchases continually.
- What is the aim of the Association Rule?
- To determine the strength of all the association rules among a set of items.
Support and Confidence
- Support
- Fraction of transactions that contain both X and Y
- ({X, Y} or X → Y): how often X and Y go together
- \ # of records containing X and Y divided by the total # of records
- Confidence
- Measures how often items in Y \n appear in transactions that \n contain X
- (X →Y): how often Y go together with the X
- \ # of records containing X and Y divided by # of records containing X
Key Concepts
- Itemset
- A collection of one or more items: e.g., {milk, bread, diaper}
- K-itemset: An itemset that contains k items
- Support count (σ)
- Frequency of occurrence of an itemset
- Support
- Fraction of transactions that contain an itemset
- Frequent itemset
- An itemset whose support is greater than or equal to a minimum support threshold
Apriori Algorithm for Association Rule Discovery
- Application of Association Rule Mining \n
Apriori Algorithm
- Created by Agrawal and Srikant in 1994
- A classic algorithm for discovering association rules
- How does the algorithm work?
- The algorithm attempts to find subsets that are common to at least a minimum number c (cutoff, or confidence threshold) of the itemsets.
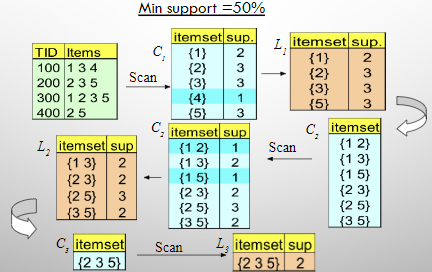
- Steps for the Apriori Algorithm
- Step 1
- Generate 1-itemset frequent pattern based on a defined minimum support value. this set is denoted L1.
- Step 2
- L1 is used to find L2, the set of frequent 2-itemsets, which is used to find L3
- Step 3
- Repeat until no more frequent k-itemsets can be found
Application of Association Rule Mining
- Market basket analysis
- Is a common analysis running against a transaction database to find sets of items, or item sets, that appear together in many transactions.
- Applications of Association Rule Mining
- Improve the placement of items in a store
- Promote the items as a package (do not put one on sale if the associated one is on sale)
- The layout of web pages
- Product recommendations
Pros and Cons of Apriori
- Pros of the Apriori algorithm
- It is an easy-to-implement and easy-to-understand algorithm.
- It can be used on large itemsets.
- Cons of the Apriori algorithm
- Sometimes, it may need to find a large number of candidate rules that can be computationally expensive.
- Calculating support is also expensive because it has to go through the entire database.
Sequential Pattern Analysis
- Definition: similar to association rule mining, except that the relationship exists over a period of time →where one event less to another later event(time-series data analysis).
- Example(s):
- After inflation rate increases, the stock market is likely to go down within a week.
- After a student takes statistics 101 course, what course is most likely to be next in the following semester?
Data Warehouse and OLAP
- Business Management Issues
- “We have mountains of data in this company, but we can’t access it.”
- “We may need to slice and dice the data in every way.”
- “You’ve got to make it easy for business people to get at the data directly.”
- “Just show me what is important.”
- “It drives me crazy to have two people present the same business metrics at a meeting, but with different numbers.”
- “We want people to use information to support more fact-based decision making.”
- Data Warehouse
- Definition: A data warehouse is a subject-oriented, integrated, time-variant, and nonvolatile collection of data in support of management’s decision-making process.
- A repository of consolidated multiple heterogeneous data sources
- A huge historical data repository
- Different and maintained separately from operational databases;
- Organized under a unified scheme at a single site in order to facilitate decision making;
- Focus on the analysis of data for decision makers, not on daily operations or transaction processing
- Goals of Data Warehouse
- Business have a lot of data (operational data, facts, etc.), but they are
- usually archived in different databases at different locations (distributed)
- Heterogeneous
- Decision makers need to have fast access data/info on a single site
- Short-term goals of Data Warehouse
- Improve data quality
- Minimize inconsistent reports
- Provide data sharing
- Integrate data from multiple sources
- Merge historical and current data appropriately
- Improving the speed and performance of reporting
- Long-term goals of Data Warehouse
- Provide a consolidated view of enterprise data
- Develop an enterprise approach to business intelligence and decision support.
- Characteristics of Data Warehouse
- Subject oriented: data are organized based on major subject areas of the corporation.
- Integrated: data in a DW are collected from distributed, heterogeneous data sources.
- Time-variant: Data has a time dimension - each data point is associated with a point in time.
- Nonvolatile: New data is always appended rather than replaced. The database continually absorbs new data, integrating it with the previous data.
- Data Staging Area - ETL
- EXTRACTION
- reading and understanding the source data and copying the data needed for the data warehouse into the staging area for further manipulation.
- TRANSFORMATION
- cleansing, combining data from multiple sources, deduplicating data, and assigning warehouse keys
- LOADING
- loading the data into the data warehouse presentation area
- Data Access Tools
- tools that query the data in the data warehouse’s presentation area
- the variety of capabilities that can be provided to business users to leverage the presentation area for analytic decision making
- prebuilt parameter-driven analytic applications
- ad hoc query tools
- data mining, modeling, forecasting
- Data Warehouse vs. Data Marts
- The high cost of data warehouse limits their use to large companies.
- DW: data about spanning the whole organization
- Data marts: a lower-cost, scaled down version of a data warehouse
- Specialized for a single department
- How to Create a Data Mart?
- Replicated data marts: replicate functional subsets of the data warehouse.
- Example: marketing data mart
- Standalone data marts: a company may have several independent data marts without a DW.
- Data Model For a Data Warehouse
- A DW is usually modeled by a multidimensional database structure
- Each dimension corresponds to an attribute or a set of attributes in the schema.
Dimensions and Hierarchies
- A cell in the cube may store values (measurements) relative to the combination of the labeled dimensions
- A specific cell with a measure has important context - it represents the intersection of different fields
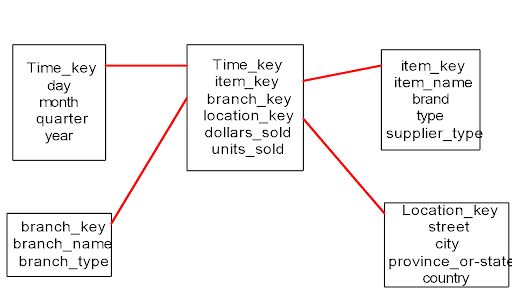
Star Schema
- Most data warehouses adopt a star schema
- Uses fact (facts or measures in the business) and dimension (establishes the context of the facts) tables
- Each dimension is represented by a dimension-table
1. LOCATION(location_key, store,street_address, city, state, country, region)
- Transactions are described through a fact table
1. consists of pointers to each of the dimension tables (foreign-key)
- Easier for users to understand
- Optimized for OLAP (online analytical processing)
Olap: Online Analytical Processing
- Tools that enable the user to gain insight into data through interactive access to a wide variety of possible views of the information
- Owing to the hierarchical nature (hierarchy) of the dimensions, OLAP operations view data from different perspectives and different levels of abstractions (Grain).
Olap: Drill-down analysis
- Drill-down, drill-down, drill-down (break down analysis by dimensions) We want to get the underlying information that rolls up to that figure.
- This process of digging deeper into data is referred to as “drill-down”
- Sales drill-down analysis Country (USA, Canada, UK) → Region → State/province → City → Store
- time dimension: year → quarters → month → day (not all dimensions are as simple as the date)
- Drill-down should take you all the way down to the transaction level
- Roll-up is the reverse of drill-down
- What is the goal of drill-down?
- To see trends within the transactions
Olap: Slicing and Dicing
- Slice and Dice: select and project on one or more dimensions
- Slicing - taking out the slice of a cube, given certain set of select dimension(customer segment), and value and measures or KPIs.
- Dicing - viewing the slices from different angles
- Dicing allows decision support system users to change their view perspective