INTERPRETING GRAPHS
A line graph is a graph with points connected by segments that examines changes over time. The horizontal axis contains the independent variable (the input value), which is usually time. The vertical axis contains the dependent variable (the output value), which is an item that measures a quantity
A bar graph uses rectangular horizontal or vertical bars to display information. A bar graph has categories on the horizontal axis and the quantity on the vertical axis. Bar graphs need a title and an appropriate scale for the frequency. The graph can include more than one bar.
A circle graph is a circular chart that is divided into parts, and each part shows the relative size of the value. To create a circle graph, find the total number, and divide each part by the total to find the percentage. Then, to find the part of the circle, multiply each percent by 360°.
Interpreting and Evaluating Line, Bar, and Circle Graphs
Graphs and charts are used to create visual examples of information, and it is important to be able to interpret them. The examples from Section 1 can show a variety of conclusions.
The minimum value is 2, and the maximum value is 8.
The largest decrease is between the second and third points.
The largest increase is between the fifth and sixth points
Mean, Median, Mode, and Range
The mean, median, mode, and range are common values related to data sets. These values can be calculated using the data set 2, 4, 7, 6, 8, 5, 6, and 3.
The mean is the sum of all numbers in a data set divided by the number of elements in the set. The sum of items in the data set is 41. Divide the value of 41 by the 8 items in the set. The mean is 5.125.
The median is the middle number of a data set when written in order. If there are an odd number of items, the median is the middle number. If there are an even number of items, the median is the mean of the middle two numbers. The numbers in order are 2, 3, 4, 5, 6, 6, 7, 8. The middle two numbers are 5 and 6. The mean of the two middle numbers is 5.5, which is the median.
The mode is the number or numbers that occur most often. There can be no modes, one mode, or many modes. In the data set, the number 6 appears twice, making 6 the mode.
The range is the difference between the highest and lowest values in a data set. The highest value is 8 and the lowest value is 2, for a range of 6.
Coordinate Plane
The coordinate plane is a two-dimensional number line with the horizontal axis called the x-axis and the vertical axis called the y-axis. Each ordered pair or coordinate is listed as (x, y). The center point is the origin and has an ordered pair of (0, 0). A coordinate plane has four quadrants.
To graph a point in the coordinate plane, start with the x-coordinate. This point states the number of steps to the left (negative) or to the right (positive) from the origin. Then, the y-coordinate states the number of steps up (positive) or down (negative) from the x-coordinate.
Area of Two-Dimensional Objects
The area is the number of unit squares that fit inside a two-dimensional object. A unit square is one unit long by one unit wide, which includes 1 foot by 1 foot and 1 meter by 1 meter. The unit of measurement for area is units squared (or feet squared, meters squared, and so on). The following are formulas for calculating the area of various shapes.
Rectangle: The product of the length and the width,

.
Parallelogram: The product of the base and the height,

.
Square: The side length squared,

.
Triangle: The product of one-half the base and the height,

.
Trapezoid: The product of one-half the height and the sum of the bases,

.
Regular polygon: The product of one-half the apothem (a line from the center of the regular polygon that is perpendicular to a side) and the sum of the perimeter,

Surface Area and Volume of Cubes and Right Prisms
A three-dimensional object has length, width, and height. Cubes are made up of six congruent square faces.
A right prism is made of three sets of congruent faces, with at least two sets of congruent rectangles.
The surface area of any three-dimensional object is the sum of the area of all faces. The formula for the surface area of a cube is

because there are six congruent faces. For a right rectangular prism, the surface area formula is

because there are three sets of congruent rectangles. For a triangular prism, the surface area formula is twice the area of the base plus the area of the other three rectangles that make up the prism.
The volume of any three-dimensional object is the amount of space inside the object. The volume formula for a cube is

. The volume formula for a rectangular prism is the area of the base times the height, or

.
Pythagorean Theorem
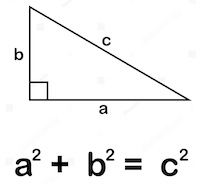
The Pythagorean Theorem is a fundamental concept in geometry discovered by the ancient Greek mathematician Pythagoras. It relates to the sides of a right triangle and states that the square of the length of the hypotenuse (the side opposite the right angle) is equal to the sum of the squares of the lengths of the other two sides.
In a right triangle with side lengths a, b, and hypotenuse c, the Pythagorean Theorem is represented by the equation: a² + b² = c²
where:
c represents the length of the hypotenuse (the side opposite the right angle),
a and b denote the lengths of the other two sides.
Consider a right triangle with side lengths of 3 units, 4 units, and an unknown hypotenuse. We can use the Pythagorean Theorem to find the length of the hypotenuse.
a = 3
b = 4
c² = a² + b²
c² = 3² + 4²
c²= 9 + 16
c² = 25

c=5
The square root of 25 is 5, so the length of the hypotenuse is 5 units