Unit 3.8 ~ Human Population Dynamics
Does Earth Have a Human Carrying Capacity?
Malthusian theory (what Malthus theorized):
- Earth has a human carrying capacity, probably based on food production
- Human population growth is happening faster than growth of food production
- Humans will reach a carrying capacity limited by food
Technological Advancement
- Humans can alter earth’s carrying capacity with tech. Innovation
- Ex: synthetic fixation of Nitrogen in 1918 leads to synthetic fertilizer, dramatically increasing food supply
Birth Rate, Death Rate, and Growth
- Growth Rate (r) = % increase in a population (usually per year)
- Ex: a growth rate of 5% for a population of 100 means they grow to 105
- Crude Birth Rate & Crude Death Rate (CBR & CDR)
- Births & deaths per 1,000 people in a pop.
- Ex: Global CBR = 20 & CDR = 8
Doubling Time (Rule of 70)
- Rule of 70: The time it takes (in years) for a population to double is equal to 70 divided by the growth rate
- Ex: Global growth rate = 1.2%
- 70/1.2 = 58.3 years
- Global pop. will double in 58.3 years
Calculating Population Change
Practice Problem: A country has a CDR of 9 and a CBR of 18.
- Calculate the annual growth rate, and the doubling time
- Solution: (18-9)/10 = 9/10 = 0.9% growth rate
- 70/0.9% = 77.77 years to double
Factors Affecting Human Pop. Growth
- Factors that increase pop. growth
- Higher TFR → higher birth rate
- High infant mortality rate can drive up TFR (replacement children)
- High immigration level
- Increased access to clean water & healthcare (decrease death rate)
- Factors that decrease population growth rate
- High death rate
- High infant mortality rate
- Increased development (education & affluence)
- Increased education for women
- Delayed age of first child
- Postponement of marriage age
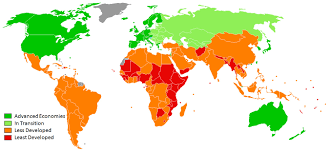
Standard of Living Indicators
- Standard of Living
- What the quality of life is like for people of a country based
- Gross Domestic Product (GDP) = key economic indicator of standard of living
- Total value of the goods & services produced
- Per capita GDP is total GDP/total population
- Life expectancy = key health indicator of standard of living
- Average age a person will live to in a given country
- Increases with access to clean water, health care, stable food sources
Stages & Development 1 = pre-industrial 2 = developing 3= Developed 4 = Highly developed