Intelligence and Psychological Testing
Key Concepts and Types of Psychological Tests
A psychological test is a standardized measure of a sample of a person’s behavior.
Types of tests:
Intelligence tests: measure general mental ability.
Aptitude tests: measure potential in specific areas of general mental abilities.
Achievement tests: assess mastery and knowledge of subjects.
Personality tests: assess motives, interests, values, and attitudes.
Testing Procedures and Norms
Standardization: uniform procedures for administration and scoring of a test.
Standardization sample: the group used to develop norms.
Test norms: indicate where a score ranks relative to others on the same test.
Percentile score: the percentage of people who score at or below the obtained score.
Characteristics of Good Tests
Reliability: consistency of measurement across time or items.
test retest
internal consistency
Validity: accuracy of what the test measures.
Content validity (face validity): whether test items represent the domain of interest.
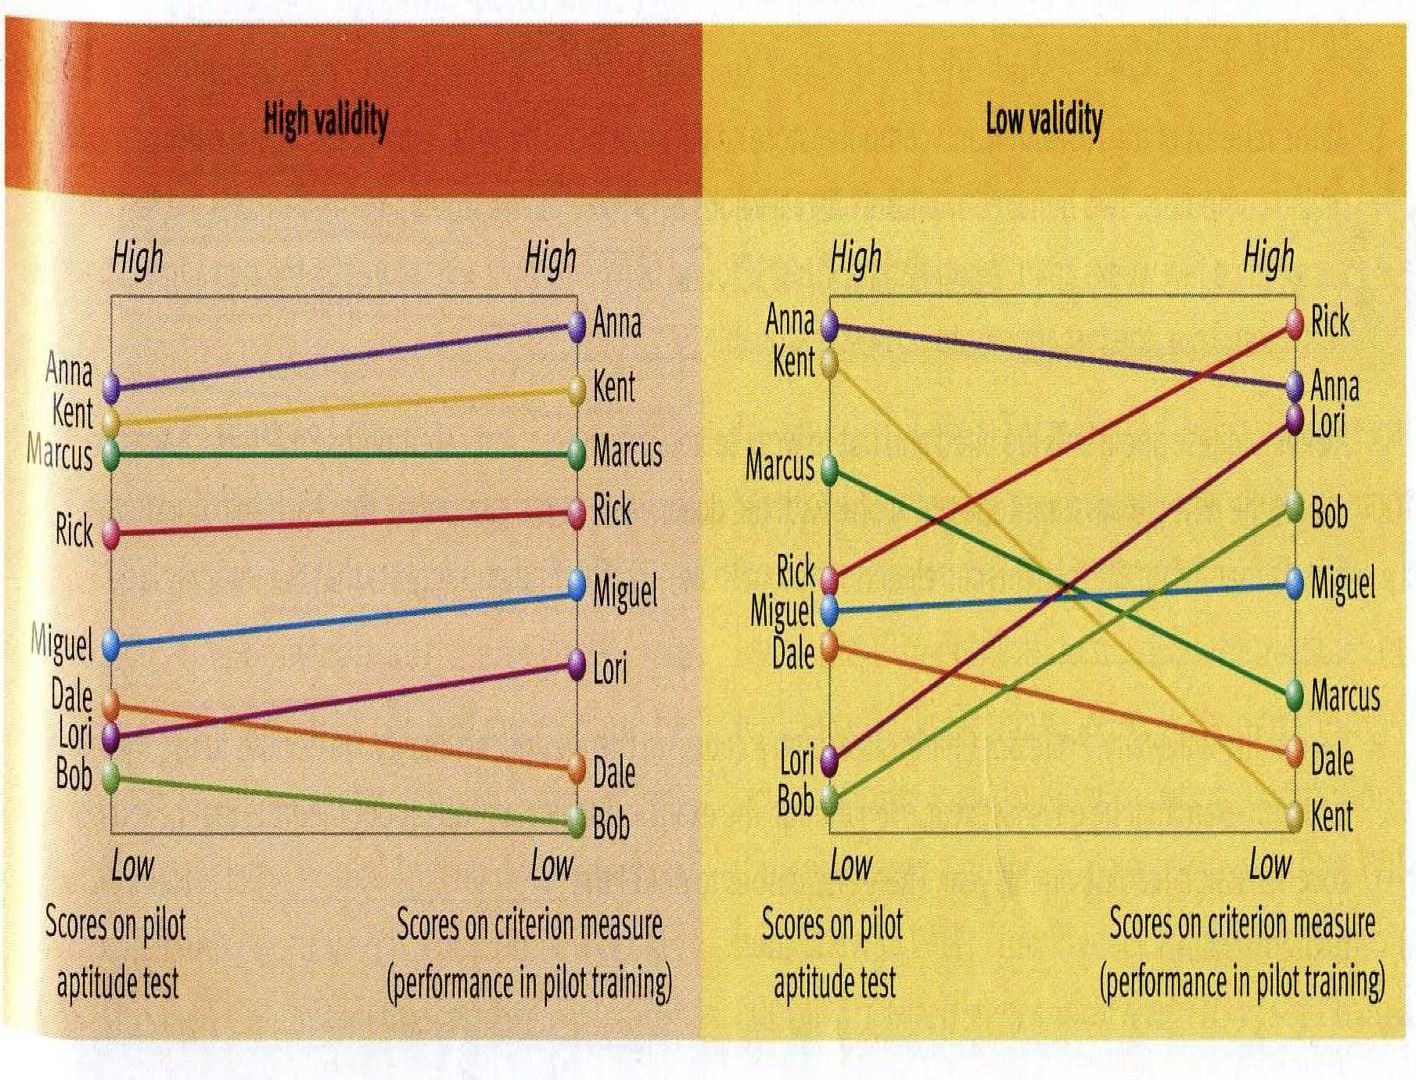
Criterion-related validity: correlation of test scores with an independent criterion measure of the trait.
Construct validity: extent to which test scores relate to behaviors that should reflect the construct.
Reliability
Reliability is the measurement consistency of a test.
Test-retest reliability: correlate scores from the same individuals across two administrations of the same test.
Internal consistency: do all items measure the same construct?
Correlation coefficient: numerical index of the strength of the relationship between two variables.
Test-Retest Reliability (Illustration)
If scores are similar across administrations, the test has high reliability; if scores differ greatly, the test has low reliability.
Example concept (Figure 9.1): assertiveness test scores on two administrations show high vs. low reliability depending on score stability over weeks.
Reliability – Specific Procedures
Tests Retest: administer at two times and correlate the scores.
Example measures: Morningness-Eveningness Questionnaire (Time 1 vs Time 2).
Internal consistency: assess whether all items measure the same construct (e.g., attitudes toward abortion) by correlating odd vs even items. Do all the test questions measure the same thing.
Validity
Validity is the ability of a test to measure what it was supposed to measure.
Content validity: degree to which test content represents the domain or material of interest.
Criterion-related validity: correlation of test scores with an independent criterion (e.g., performance in pilot training).
Construct validity: whether the test scores relate to other measures in a way consistent with the theoretical construct (e.g., IQ vs. grades or aggression vs. teacher ratings).
Validity (Illustrations)
Pilot in the air force: test scores predicting success in pilot school (criterion validity).
IQ and grades: high but not perfect correlation with school performance; past grades often the best predictor of future performance.
Aggression: correlations between test measures of aggression and teacher ratings.
Validity – Content/Face and Criterion-Related in Practice
Content or face validity: items should represent the content domain.
Criterion-related validity: test score should correlate with relevant real-world criteria such as performance in a specific training program.
Construct validity: convergent and discriminant validation with related vs. unrelated constructs.
History of Intelligence Testing
Binet: original purpose was to predict school performance and identify slow learners.
Age scale: tests administered to children 3–13; mental age (MA) reflected level of age-graded problems solvable.
IQ concept: MA/CA x 100 where CA is chronological age.
Lewis Terman: revised Binet to Stanford-Binet (1916); introduced standard IQ measure.
Wechsler: criticized Stanford–Binet for being child-centered,
verbal emphasis
providing a single score
developed adult-focused scales with nonverbal components and a normal-distribution-based scoring system.
Wechsler Scales and Subtests
Full IQ consists of two scales: Verbal IQ and Performance IQ.
Verbal IQ subtests (examples): Vocabulary, Similarities, Comprehension, Information, Arithmetic, Digit Span.
Performance IQ subtests (examples): Block Design, Picture Completion, Picture Arrangement, Object Assembly, Digit Symbol.
Subtest examples and descriptions illustrate broad verbal vs. nonverbal (performance) abilities.
Modern Wechsler Tests (Overview)
Wechsler scales for different ages:
WAIS (adults)
WISC-IV (children 6–16)
WPPSI-III (preschool/young children 3–8)
Both verbal and nonverbal subtests contribute to overall and index scores.
Distribution and Interpretation of IQ Scores
Modern IQ tests are normally distributed around a mean of 100 with a standard deviation of 15:
Typical range: most scores fall between (about 68% of the population).
Very few scores are above 130; very few are below 70 (definition often used for intellectual disability).
The approximate distribution: more than two-thirds score within ±15 points of the mean; 95% score within ±30 points.
Example table (meanings of scores): thresholds such as 160, 140, 135, 130, 125, 120, 115, 110, 105, 100, 95, 90, 85, 80, 75, 70, 65, etc., with corresponding percentiles in the population.
Group Tests and Infant Scales
Group tests (cost-effective, paper-and-pencil, rapid group assessment): e.g., SAT, ACT.
Infant intelligence assessment: Bayley Scales of Infant Development (motor scale, mental scale, infant behavior record).
Developmental quotient (DQ): combination of motor and mental scales; poor predictor of childhood IQ.
Continuity and Early Indicators of Intelligence
Early indicators: visual reaction time, rate of habituation, preference for novelty at 4–8 months correlate with childhood IQ (~r ≈ .45).
Stability of IQ: from age 4 onward, the relationship between early IQ and later IQ strengthens with age.
McCall (1973) longitudinal study: large fluctuations in IQ across early years; about 50% showed average variations >20 points, suggesting IQ is more stable for some children than others and reflects current performance rather than future potential.
Cumulative-deficit hypothesis: impoverished environments dampen intellectual growth; effects accumulate over time.
Visual: longer institutional deprivation associated with lower cognitive performance later on (evidence supporting cumulative-deficit effects).
IQ as a Predictor
Scholastic achievement: IQ predicts academic performance well at group level; more strongly predicted by past grades than by IQ alone.
Vocational outcomes: IQ relates to occupational prestige and job performance; practical intelligence also important and not captured by IQ tests.
Health and life satisfaction: higher IQ associated with better health and life outcomes, though high IQ alone does not guarantee happiness or success; home environment and social support matter.
Intellectual Disability and Giftedness
Intellectual disability (formerly mental retardation): subaverage general mental ability plus adaptive deficits, onset before age 18; IQ < 70 with adaptive functioning deficits.
Category ranges (simplified):
Mild: IQ 55–70; possible education up to sixth grade; special education helpful.
Moderate: IQ 40–55; education to second–fourth grade; special education necessary.
Severe: IQ 25–40; limited self-care; supervised living with training.
Profound: IQ < 25; little or no speech; total care required.
Most cases are environmentally influenced; organic causes account for a minority.
Origins: organic vs. environmental factors; Down syndrome, phenylketonuria, hydrocephaly among organic causes.
Nature, Nurture, and Correlates of Intelligence
Evidence for heredity: twin and adoption studies show genetic influence on IQ within individuals and families.
Reported correlations: Identical twins reared together about ; identical twins reared apart about ; fraternal twins reared together about ; fraternal twins reared apart about ; siblings reared together about ; siblings reared apart about ; biological parent/child together about ; biological parent/child apart about ; unrelated siblings together about ; unrelated individuals apart about .
Heritability coefficient: the proportion of variation in a trait due to genetic factors within a population.
Non-shared environment: environmental influences not shared by siblings living together; shared environment: factors siblings share that tend to make them similar.
Flynn effect: average IQ scores have risen across generations due to environmental improvements (education, nutrition, health care).
Socioeconomic and Home Environment Influences
Socioeconomic status (SES): higher SES generally yields higher IQ scores; differences observed across SES groups persist across racial/ethnic groups.
Cumulative deficit: prolonged poverty exacerbates IQ differences over time.
HOME inventory: Home Observation for Measurement of the Environment; six subscales assessing intellectual stimulation, parental involvement, play materials, etc.
Predicts intellectual performance across age groups; infancy measures of parental involvement and language stimulation strongly predict later IQ/school achievement.
Social and Cultural Correlates of Intellectual Performance
Ten environmental risk factors associated with low IQ in early childhood; many are home/family characteristics.
Group differences in IQ across SES and ethnicity:
Lower SES children often score 10–15 points lower than middle-class peers.
Children of African American and Native American ancestry tend to score 12–15 points lower than European American peers.
Asians tend to score equal to or higher than whites.
Cultural bias and test bias debates:
Cultural/test bias argues tests may be biased against minority groups; language differences can contribute to bias.
Raven Progressive Matrices and culture-fair tests show similar group patterns, suggesting bias is not the sole explanation.
Motivational factors: test anxiety, stereotype threat, and examiner familiarity can influence scores.
Genetic and Environmental Explanations for Group Differences
Genetic hypothesis (e.g., Jensen): differences may be due to hereditary factors, with Level 2 abilities (abstract reasoning) showing larger gaps.
Environmental hypothesis: deprivation and poor environments depress intellectual development; improvements in environment can raise scores.
Current consensus: no conclusive evidence that between-group IQ differences are caused by genetics; heredity contributes to within-group variation; environment plays a substantial role in group differences.
Interaction of Heredity and Environment
Reaction range: heredity sets potential limits for IQ; actual score depends on environment quality; high-quality environments can realize higher points on the range, while deprived environments pull scores lower.
Intellectual ability likely influenced by many genes with small effects, interacting with environmental factors.
Biological Correlates and New Directions
Larger brain size correlates with higher intelligence; greater gray and white matter volumes are associated with higher IQ.
Smarter individuals tend to be healthier and live longer; health-promoting genes and better self-care contribute to both intelligence and health.
Moderate correlations exist between brain structure and IQ; practical use remains limited.
New Directions in Assessment and Intervention
Examining biological indexes and correlates (e.g., reaction time, inspection time) for insight, though practical value varies.
Compensatory education aims to raise cognitive performance in disadvantaged groups (Head Start, Abecedarian Project, Chicago longitudinal study).
Key findings from interventions:
Early high-quality preschool plus additional education yields improved academic achievement through age 12, with long-term benefits including higher school completion and better attitudes.
Parental involvement and two-generation approaches amplify gains.
The Abecedarian program showed higher IQ maintained through age 15.
What Is Intelligence? Psychometric Views
Intelligence can be viewed as a trait or set of traits enabling better problem-solving and adaptation.
The debate: is intelligence a single general ability or a collection of multiple abilities? This question led to various theories and models.
Theories of Intelligence: The Multicomponent View
Factor analysis: used to identify clusters of tests that load onto common factors (intelligence components).
Classical views:
Spearman’s g and s: g is general intelligence; s represents specific abilities tied to particular tasks.
Thurstone’s seven primary mental abilities: spatial, perceptual speed, numerical reasoning, verbal meaning, word fluency, word meaning, inductive reasoning.
Binet, g, and Beyond
Binet’s early work suggested a general mental ability (g) inferred from correlated test performances.
Cattell & Horn: crystallized intelligence vs. fluid intelligence.
Crystallized intelligence: knowledge and skills acquired from schooling and culture.
Fluid intelligence: ability to perceive relationships and solve new problems not reliant on cultural knowledge.
Sternberg’s Triarchic Theory
Three components:
Contextual (practical intelligence): adapting to situations, selecting appropriate environments, shaping environments.
Experiential (automatization): prior experience with test items; processing efficiency.
Componential (analytical): information processing strategies, metacognition, and knowledge.
Diagrammatic relation: information processing, strategies, metacognition contribute to intelligence across contexts.
Gardner’s Eight Intelligences
Eight independent intelligences:
Logical-mathematical
Linguistic
Musical
Spatial
Bodily-kinesthetic
Interpersonal
Intrapersonal
Naturalist
Each has distinct core components and real-world expressions (e.g., scientists, poets, dancers, therapists, etc.).
Emotional Intelligence (EI)
EI consists of four abilities:
Perceive and express emotion
Assimilate emotion in thought
Understand and reason with emotion
Regulate emotion
EI is proposed to predict effective management of emotions in real-world situations.
Criticisms: some argue EI is fuzzy, difficult to measure, and may not be a form of intelligence.
Summary of Key Formulas and Values
IQ formula (Binet/Stanford approach):
Modern IQ distribution: $$ ext{Mean}=100,\, ext{SD}=15\