Chapter 3: Demand, Supply, and Market Equilibrium
Markets - Bring together buyers + sellers
- Highly competitive markets have large #s of independently acting buyers + sellers of standardized products
Demand - Schedule/curve showing various amounts of product that consumers willing + able to buy at several possible prices during a specific period of time
- Statement of buyer’s plans/intentions of purchase of product
Demand schedule - Illustrates quantity demanded of a good or service at different prices
Law of demand - Other things equal, as price falls, the quantity demanded rises (and vice versa)
- Inverse relationship
- Diminishing marginal utility - Each successive unit of product consumed → Buyers get less satisfaction
- Income effect - Lower price increases purchasing power of income → Buyer can purchase more of product than before (and vice versa)
- Substitution effect - Buyer has incentive to substitute less expensive products for similar products that are relatively more expensive
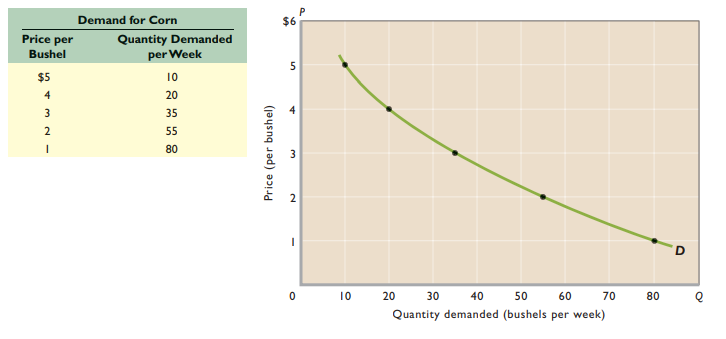
Demand curve - Quantity demanded on horizontal axis, price on vertical axis; downward slope reflects law of demand
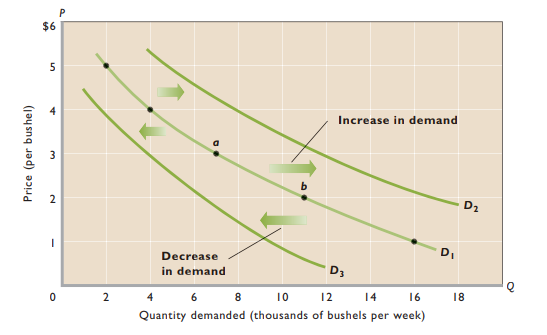
- Increase in demand → Curve shifts right
- Decrease in demand → Curve shifts left
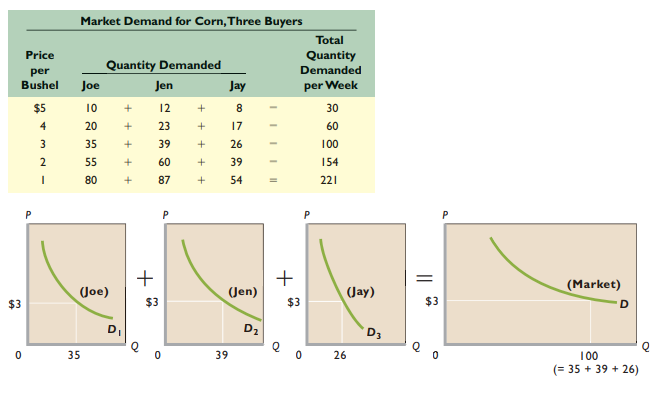
Add quantities demanded by all consumers at each possible price → Market demand
Determinants of demand - Other factors besides price that affect purchases; shifts the demand curve
- Consumer preferences
- Number of buyers
- Consumer incomes
- Normal goods - Rise in income causes increase in demand
- Inferior goods - Rise in income causes decrease in demand
- Prices of related goods
- Substitute goods - Increase in price of one related good → Demand for other good increases
- Complementary goods - Increase in price of one related good → Demand for other good decreases
- Independent/unrelated goods
- Consumer expectations
Change in demand - Shift of demand curve to right/left
Change in quantity demanded - Movement from one point to another on a fixed demand curve (the same demand curve)
Supply - Schedule/curve showing various amounts of product that producers are willing + able to make available for sale at several possible prices during a specific period of time
Supply schedule - Illustrates quantity supplied of a good or service at different prices
Law of supply - Other things equal, as price rises, the quantity supplied rises (and vice versa)
Supply curve - Upward sloping; reflects law of supply
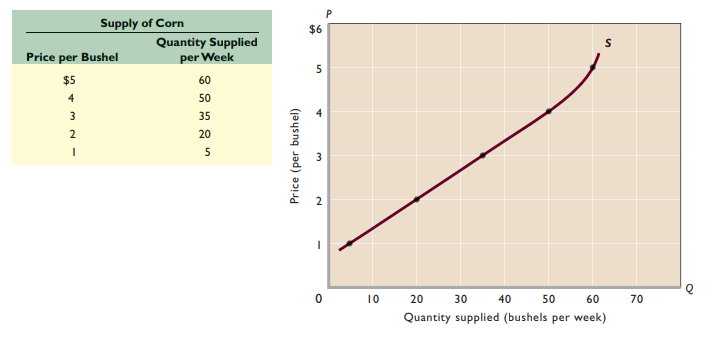
Sum quantities supplied by each producer at each price → Market supply
Determinants of supply - Other factors besides price that affect supply; shifts supply curve
- Resource prices
- Technology
- Taxes and subsidies
- Prices of other goods
- Producer expectations
- Number of sellers in the market
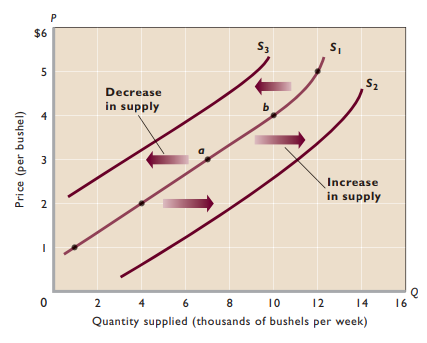
Change in supply - Shift of supply curve to right/left
Change in quantity supplied - Movement from one point to another on a fixed supply curve (the same supply curve)
Equilibrium price - Price where quantity demanded = quantity supplied
- Intersection of supply + demand curve
Equilibrium quantity - Quantity demanded and quantity supplied at the equilibrium price
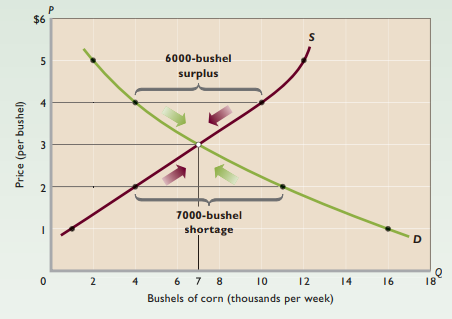
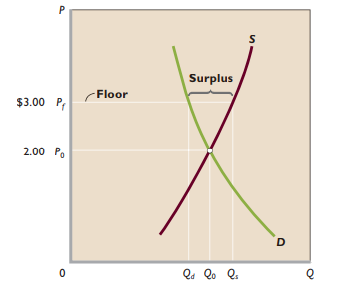
Surplus - Quantity supplied exceeds quantity demanded; drives prices down
Shortage - Quantity demanded exceeds quantity supplied; drives prices up
Rationing function of prices - Competitive forces of supply + demand establish equilibrium price
Productive efficiency - Production of a good in the least-costly way
Allocative efficiency - Production of the particular mix of goods and services most highly valued by society
Demand reflects marginal benefit, supply reflects marginal supply
- MB = MC → Allocative efficiency
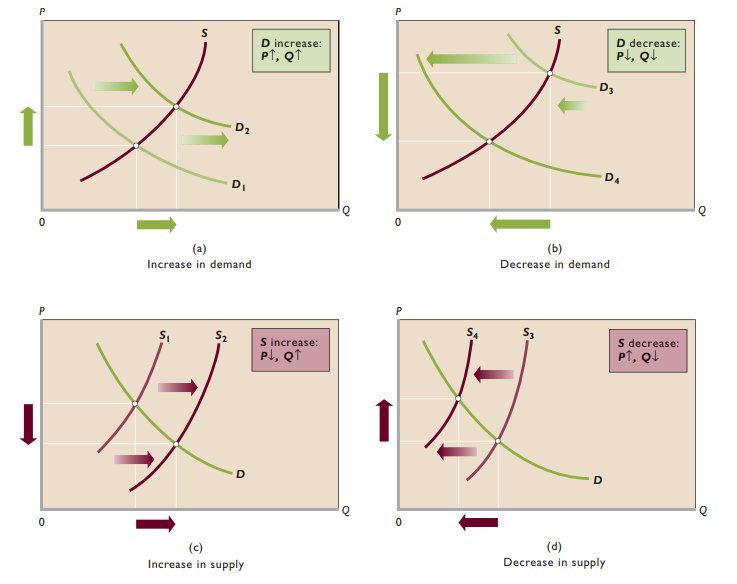
Changes in supply + demand
- Increase in demand → Increase in equilibrium price + equilibrium quantity
- Increase in supply → Decrease in equilibrium price + increase in equilibrium quantity
- Supply increase, demand decrease → Equilibrium price decrease, equilibrium quantity indeterminate
- Supply decrease, demand increase → Equilibrium price increase, equilibrium quantity indeterminate
- Supply increase, demand increase → Equilibrium price indeterminate, equilibrium quantity increase
- Supply decrease, demand decrease → Equilibrium price indeterminate, equilibrium quantity decrease
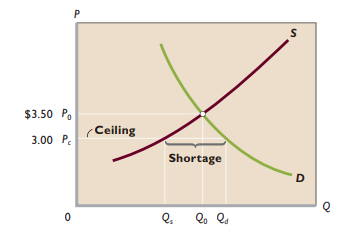
Price ceiling - Maximum legal price a seller can charge for a good or service
- Must be below equilibrium price to be binding
- Shortage
- Rationing problem - Gov’t must establish formal system of rationing in order to solve inequitable distribution of gasoline
- Black markets - Goods illegally bought and sold at prices above the legal limits
- Rent controls - Maximum rents established by law
Price floor - Minimum legal price a seller can charge for a good or service
- Must be above equilibrium price to be binding
- Surplus
- Gov’t can solve surplus by either restricting supply or purchasing surplus output
- Distorts resource allocation
