7.3 notes
Sampling Distributions
- Sampling distribution: a distribution of many samples from a population
- The center of the sampling distribution is at the center of the population
- There’s a formula to find the standard deviation of the sampling distribution of sample proportions (p̂s), which works as long as P>10n
- The sampling distribution is approximately normal if np > 10 and n(1-p) > 10
- If this is true, we can use the two equations above to calculate z-scores
Proportions vs. Means
Proportions are generally associated with categorical variables
Means are generally associated with quantitative variables

Generally, if an SRS of size n is drawn from a normal population, then the sampling distribution of x̄ will be approximately normal
Central Limit Theorem
- Generally, if an SRS of size n is drawn from any population with parameters µ and σ
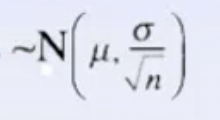
- When n is large, the sampling distribution of x̄ is

- The generally accepted value for “large” is n≥30
- When n is large, the sampling distribution of x̄ is

