AP STATS: Unit 3 Review
Sampling Methods
Population: all individuals
SRS:
random
good
Convenience Sample:
NOT random
expertment choose
Voluntary Response:
People choose
Stratified Random Samples:
“Some of All"
*Some members from all groups
Cluster Random Samples:
“all of some”
*all members from only some groups
Systematic Random Samples:
choose a random starting point
use regular intervals after
Potential Problems with Sampling
Undercoverage: when some members of a population can not be included or are left out
EX. landline calls
Nonresponse bias: when a person or part of a sample chooses not to respond
Response bias: a pattern of inaccurate results
EX. lying, wording questions, etc.
Least Squares Regression Lines, Predictions, & Residuals
Predictions
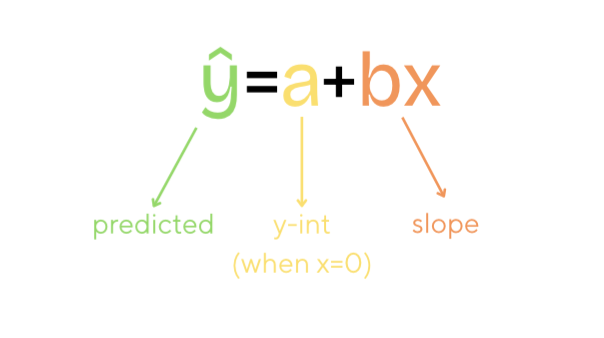
*be careful of extrapolation
Residuals
Resid + Actual - Predicted
y - ŷ
“The actual context was resid above/below the predicted for x=#.”
Slope
“For each additional x in context, we predict y in context increases/decreases by slope.”
Calculator Function: Residual Plot
put x-values in L1
put y-values in L2
in L3: type your equation with L1 for x (for example: if equation is y = 1.6x + 5, type in 1.6*L1 +5)
in L4: type L2 - L3
Go to Statplot menu - adjust your scatterplot settings so that XList: L1 and YList: L4
Hit Graph and then Zoom 9
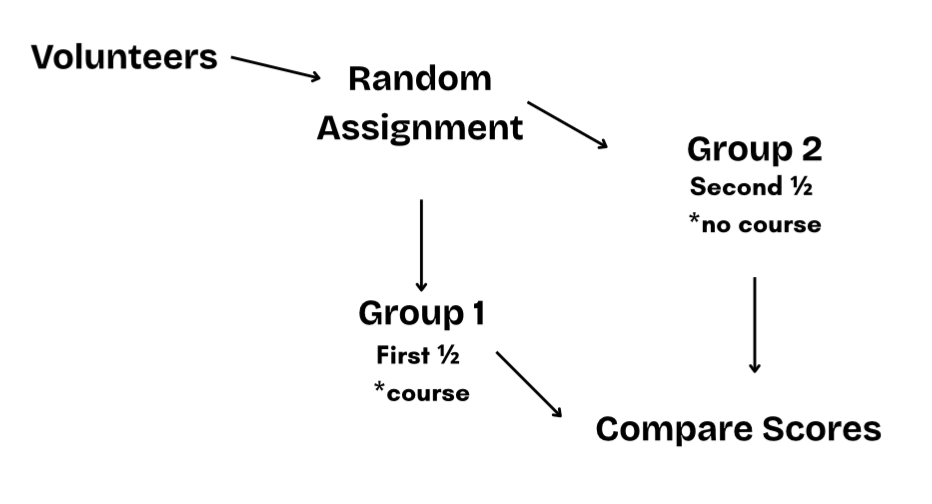
SAT PREP: Observational Studies & Experiments
Observational Study (NO treatment) vs. Experiments (treatment)
Explanatory Variable (x): helps predict the response
Response Variable (y): the outcome being measured
Confounding Variable: variables that affect the response that have nothing to do with what you’re testing.
Experimental Units: who/what is being tested
EX. design an experiment
s and r2
Standard deviation of residuals - s
Interpretation: “the actual (y in context) is typically (on avg.) about (s) unit away from the value predicted by the LSRL.”
Coefficient of determination - r²
Interpretation: "About (r²)% of the variability in (y in context) is accounted for by the LSRL.”
(r)2 = r2
EX. r = .936, r2 = (.936)2
Outliers and the LSRL
Outliers: out of pattern (large residuals)
High leverage: very large or very small x-values
Influential: if removed, big changes to slope, y-intercept, r
LT #1: Outliers and the LSRL
horizontal outliers → tilt the line
Vertical outliers → shift line up or down
a good LSRL has low s + high r2 (close to 1)