3a. Economic growth
Economic growth
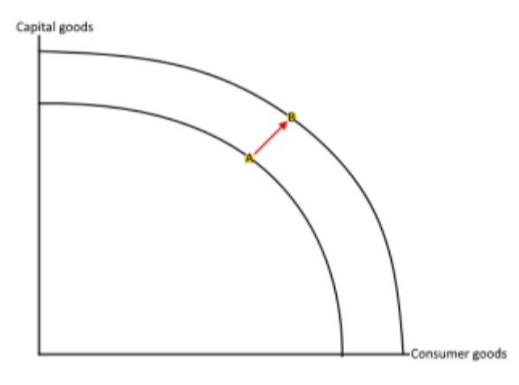
- Economic growth is the long term expansion of an economi’s productive potential
- One way to demonstrate it is to use a PPF
- Short term growth is measured by the % change in national output
- Long term growth is illustrated by an increase in an economi’s aggregate supply
The target for economic growth is for it to be “high and sustainable”
In the UK estimated growth is normally around 2-3% per year
Any more than this could lead to problems such as bottlenecks or environmental degradation
Sustainable growth
Sustainable growth can be defined as growth in the productive potential of the economy today which does not lead to a fall in the productive potential of an economy for future generations.
To achieve growth for production non renewable resources such as oil, coal, and copper are likely to be used up.
National output and national income
There is no difference between these two terms as a country’s income relates to all the goods and services that are produced in a country
Value and volume
- The value represents the amount of money spent – E.g. £100m worth of iPhones
- Volume represents the total quantity produced – E.g. 600 cars
GDP and GNI
Gross Domestic Product (GDP) is the total number of goods and services produced in an economy in a given year
Gross National Income (GNI) is the total income received by a country from its residents and businesses all over the world
Purchasing Power Parities (PPP)
- When making comparisons between countries that use different currencies it is necessary to convert values, such as national income (GDP), to a common currency.
- The purchasing power of a currency refers to the quantity of the currency needed to purchase a given unit of a good, or common basket of goods and services. Purchasing power is clearly determined by the relative cost of living and inflation rates in different countries. Purchasing power parity means equalising the purchasing power of two currencies by taking into account these cost of living and inflation differences.
- For example, if we convert GDP in Japan to US dollars using market exchange rates, relative purchasing power is not taken into account, and the validity of the comparison is weakened. By adjusting rates to take into account local purchasing power differences, known as PPP adjusted exchange rates, international comparisons are more valid.
Economic growth and subjective happiness
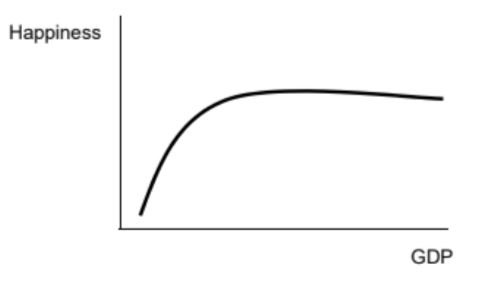
The Easterlin Paradox
At low levels of GDP increases in incomes increase happiness as people can meet their basic needs. However, beyond this happiness stagnates or even declines as being able to afford more goods and services does not increase happiness.
Happiness Index
The happiness index is a global comparison of countries. It considers:
- High wages
- Good access to benefits and support when needed
- High life expectancy
- Freedom to make life choices
- Generosity
- Perceptions of corruption
Causes of an increase in economic growth
Economic Growth occurs through an increase in the quantity or quality of the factors of production.
- Investment
- Immigration
- Education and training
- Healthcare
- Participation rate
- Technology
- Productivity
- Population
More factors of production will increase the potential growth of the economy but there also needs to be enough AD to create actual growth
GDP as a measure of living standards
GDP gives an indication of the average UK income
Therefore, if GDP per capita increases, households have more disposable income and better standards of living
Limitations of GDP as a measure of living standards
- Regional inequalities – particularly relevant to the UK
- Changes to working conditions not considered
- No allowance for the depreciation of capital
- Does not account for changes in life expectancy
- Does not include voluntary or unpaid work
- Does not account for the increase in the quality of products and services
Benefits of using GDP as a measure
- Used universally and is fairly simple to understand
- Useful for comparing between countries
- Useful for comparing different times
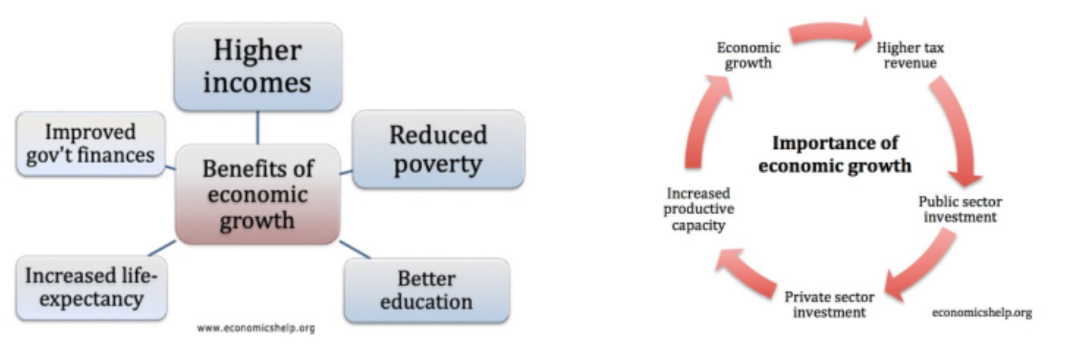
Benefits of economic growth
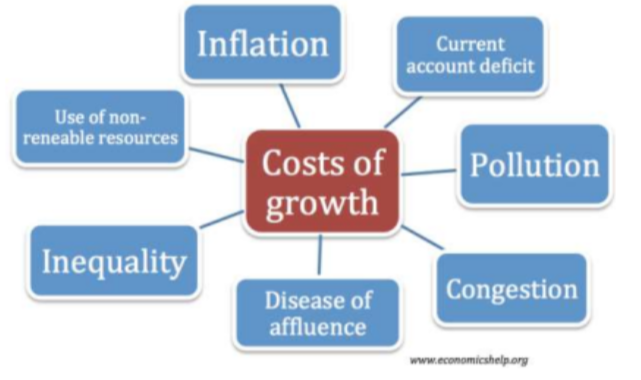
Costs of economic growth
The multiplier
It is argued that this process increases jobs in the economy. Every job directly created by firms would indirectly create other jobs in the economy.
This process can be shown using the circular flow of income and the injections and withdrawals from it
It is also known as the national income multiplier, the Keynesian multiplier, or the real multiplier
- If an initial £100m is spent and the overall value of spending leads to a final increase in national income of £1000m the value of the multiplier is 10.
- If it was £500m the value of the multiplier would be 5
- The multiplier works in reverse also. A reduction in spending would lead to a larger reduction overall because of higher unemployment and its effects consequently
Calculating the multiplier
The marginal propensity to consume
- The level of increased consumption divided by the increase in income that caused it
- MPC = ∆C / ∆Y
The marginal propensity to save
- The level of increased saving divided by the increase in income that caused it
- MPS = ∆S / ∆Y
The marginal propensity to Tax
- The increase in tax revenues divided by the increase in income that caused it
- MPR = ∆T / ∆Y
The marginal propensity to Import
- The level of increased imports divided by the increase in income that caused them
- MPM = ∆M / ∆Y
The marginal propensity to withdraw
- The increase in withdrawals from the circular flow of income (T+M+S) divided by the increase in income that caused them
- MPW = ∆W / ∆Y
To calculate the value of the multiplier
You can use any of the three formulas below. They will all produce the same answer -
1/MPW or 1/ (1 - MPC) or 1/ MPT + MPS + MPM
Criticisms of the multiplier
- It is difficult to measure the exact size of the multiplier
- Changes can happen in an economy that changes the size of the multiplier very quickly
- The effect of spending is not immediate
- Economists disagree with the size of the multiplier and therefore the size of the impact injections would have