Plan a Data Visualization
Step 1: Explore the Data for Patterns
ask manager or data owner for access to the current sale records and website analytics reports
info includes how:
customers behave on company existing website
basic information about who visited
who bought from the company
how much they bought
Step 2: Plan your Visuals
refine data and present the results of your analysis.
create data visual that explains findings quickly and effectively to your target audience
since audience is sales oriented, you would use:
show sales numbers overtime
connect sales to location
show the relationship between sales and website use
show which customers fuel growth
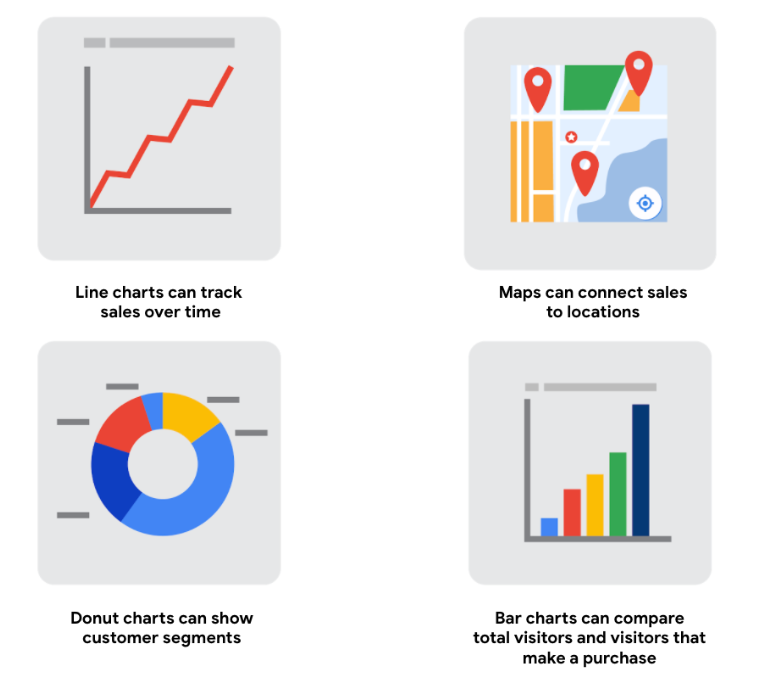
Step 3: Create your Visuals
decide what kind of information and insights you want to display
creating the right visualization to share with stakeholders is a process
Examples:
Build you Data Visualization Toolkit
use the visualization tools in your spreadsheet to create simple visualizations such as line and bar charts
can use more advanced tools such as Tableau that allow you to integrate data into dashboard-style visualizations
if working with programming language R , can use visualizations tools in RStudios
“Data visualizations are pictures. They are a wonderful way to take very basic ideas around data and data points and make them come alive”