Marketing and Supply Chain Notes Unit 3
Marketing and Supply Chain Notes
Unit 3
Pricing concepts for establishing value
Chapter 14
Marketing mix
Product
Price
Place
Promotion
Defining Price
The overall sacrifice a consumer will be willing to make to acquire a specific product or service.
How do we establish the price?
The five Cs of Pricing
Competition
Costs
Company objectives
Customers
Channel members
Company objectives
If the company is profit-oriented, they need to consider the value to the customer and make choices from these three objectives.
Maximizing profits
Target profit pricing
Target Return Pricing
Target profit pricing
Firms usually implement when they have a particular profit goal as their overriding concern
Use price to stimulate a certain level of sales at a certain profit per unit
Firms that want to attain market leadership set prices at less profitable levels to gain market share!
Sales orientation
Focus on increasing sales
More concerned with overall market share
Does not always imply setting low prices (premium pricing)
Sales orientation
Many adopt to establish a position in the market by getting the most price-sensitive consumers to change brands
Premium pricing
The firm prices a product about the prices set for completing products to capture those customers who always shop for the best or for whom price does not matter
How to sell the higher-priced wine
Introduce a third, higher-priced wine.
Competitor orientation
Companies feel they should measure themselves primarily against their competition.
Competitive parity: setting prices similar to those of major competitors
Status quo pricing: changes prices to meet those of the competition
Value is not part of this pricing strategy
Customer orientation
Customer orientation: pricing is set based on how it can add value to its products or services
Focus on customer expectations by matching prices to customer expectations
Consumers have an expectation of a rental car costing a lot of money. They don’t realize they can rent a car for under $10 an hour. Because Zipcar is a new product, they need to set customers' expectations. To help consumers relate to the price, they compare it to a purchase very familiar to the consumer.
If you are going to talk about price, you need to consider the demand for your product.
Demand Curve
Why the demand curve important?
Knowing the relationship
Knowing the demand curve enables you to see relationship between price and demand
Prestige products
Prestige products are those that consumers purchase for status rather than functionality
Prestige products - demand curve
Not all are downward sloping
Prestigious products or services have upward loping curves
How does the price elasticity of demand play into the formula?
Price elasticity of demand: measures how changes in a price affect the quantity of product demand.
Elastic (price sensitive)
Inelastic (price insensitive)
Consumers are less sensitive to price increases for necessities
Elasticy of demand
Price elasticity of demand: % changes in quantity demanded % change in price
Factors that influence elasticity of demand
Income: change due to change in consumer’s income
Substitution: the ability to substitute other products for the focal brand
Cross-price: is the percentage change in the quantity of Product A demanded compared with the percentage change in pice in Product B
Income effect
Substitution Effect
Pete, college student on a budget
Old spice deodorant user
At the store he notices that old spice is more expensive
Decides to give another brand a chance and save money
Cross-Price Elasticity Effect
Kendra, self-supporting college student
Buys a new printer on sale for a great price
She learns it requires special ink cartridges that cost more than the printer.
Three cost concepts
Variable costs
Vary with production volume
Fixed costs
Unaffected by production volume
Total cost
Sum of variable and fixed costs
How do we break even?
Break even point:
The point at which the number of units sold generates just enough revenue to equal the total costs; at this point, profits are zero.
Break even analysis
The fourth C is competition
Forms of competition
Monopoly
One firm controls the market
Oligopoly
A handful of firms control the market
Monopolistic comp.
Many firms selling differentiated products at different prices
Pure competition
Many firms selling commodities where price is set by
Channel members pricing
Manufacturers, wholesalers, and retailers can have different perpecives on pricing strategies
Manufacturing must protect against grey market transactions (selling goods around the system)
Everyday low pricing vs. high/low pricing
Create value in different ways
EDLP saves search costs of finding lowest overall prices
High/low provides the thrill of the chage for the lowest price
New product pricing strategies
Market penetration
Set the initial price low to help enter the market
Price skimming
Customers are willing to pay a higher price to be the first to have the product
Legal aspects and ethics of pricing
Deceptive or illegal price advertising
Predatory pricing
Price discrimination
Price fixing
Deceptive or illegal price advertising
Deceptive reference price
Loss leader pricing
Bait and switch
Predatory pricing
Price set low with the intent to drive competitors out of business
Illegal
Difficult to prove
Price discrimination
Not always illegal
Different rules in the B2B and B2C markets
Federal law does not apply to sales ot end consumers
Price Fixing
Horizontal price fixing
Vertical price fixing
Chapter 17
Retailing and Omnichannel Marketing
Can you ever see yourself becoming an online shopper only?
Amazon’s impact on retail
Key benefits:
Incredibly convenient shopping experience for customers, with a wide variety of products available at the click of a button
Introduction of new tools and channels, such as Amazon Prime and Alexa, enhancing customer engagement and convenience
Gaining steam as a brick-and-mortar retailer, with physical stores like Amazon Go and Whole Foods expanding its customer base.
Challenges
Intense competition with other e-commerce giants, leading to price wars and reduced profit margins
Concerns over data privacy and security with the increased use of digital shopping tools and platforms
Impact on small local businesses due to the dominance of Amazon in both online and physical retail sectors.
What is retailing?
Retailing adds value to products and services for personal or family
Retailing encompasses a wide array of business activities that enhance the value of products and services. These activities are crucial as they directly cater to the needs and desires of consumers by providing them with a variety of choices for personal or family consumption. Retailers play a pivotal role in the distribution chain, bridging the gap between manufacturers and consumers.
Retailing is how we reach end-consumers
It is the end of the supply chain, and they sell directly to consumers
Supply Chain Managment Basics (reminder)
Manufactures
Distributors
Wholesalers
Retailers
Consumers
Factors for establishing a relationship with retailers
Choosing retailing partners
Identifying types of retailers
Developing a retail strategy
Managing an omnichannel strategy
Consumers are asking for other benefits that challenge traditional retail channel structures
Traditional fashion shows, six months later, have clothes on the shelves to buy.
Burberry is offering to see fashion shows online and buy now with two weeks' delivery.
Is it difficult for a manufacturer to locate retailers for their products?
The level of difficulty a manufacturer experiences in getting retailers to purchase its product
Determined by:
The degree to which the channel is vertically integrated
The degree to which the manufacturer has a strong brand
The relative power of the manufacturer and retailer
Strong brand
Cocacola
Google
Macdonalds
Amazon
Apple
Fedex
Starbucks
Channel
Nike
Warner brothers
In the past, manufacturers controlled supply chains. Now, large, strong retailers such as Amazon do.
So, where are we going to sell our products, and where are our competitors going to sell theirs?
Manufacturers need to know where their target market customers expect to find their products and those of their competitors
Customer expectations
Large firms
Less likely to use supply chain intermediaries
Can gain more control, be more efficient, and save money
Marketing Channels
Product characteristics
Can drive supply chain structures and create levels of intensity of distributions
Distribution intensity
Intensive
Exclusive
Selective
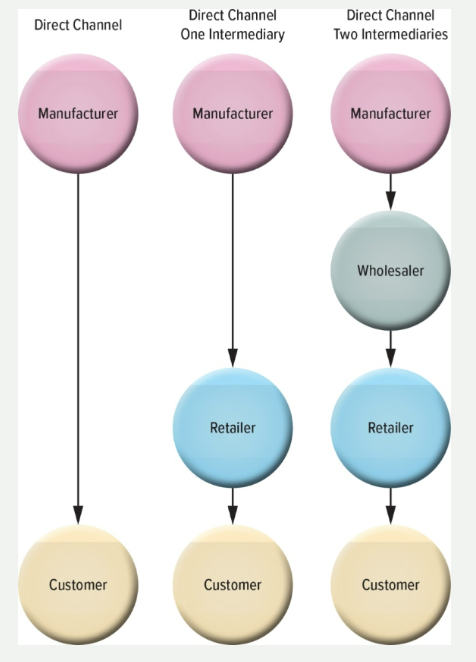
Levels of distribution intensity
Insensitive:
achieve mass market selling
Convenience goods
Number of intermediaries: Many
Selective:
Work with selected intermediaries
Shopping and some specialty goods
Number of intermediaries: several
Exclusive:
Work with a single intermediary
Speicalty goods and industrial equipment
Number of intermediaries: one
Type of retailers
Food
Supermarket
Supercenter
Convenience
Warehouse club
General merchandise
Full-line discount
Specialty
Category specialist
Department
Drug
Off-price
Extreme value
Service
Auto rental
Health spa
Vision center
Bank
Food retailers
Supermarket
Limited nonfood
Differentiates different types of foods
Supercneter
Includes discount store
Walmart, meijer, k-mart, target
Warehouse club
Limited assortment
Little service includes: costco, sams, BJ’s
Convenience store
Limited variety
Good location
Online grocery relatiers
Convenience
Amazon, walmart, e-commerce fullfilment companies (instacart/doordash)
General merchandise retailers
Department stores
Broad cariety and deep assortment
Full-line discount
Broad variety at low prices
Specialty
Limite dmerhcnadies with service in small store
Drug stores
Spaicaly for pharmecutidal health
Category specialist
Big-box or catergoy killers with narrow but deep assortment
Off-price
Inconsistent assortment of brand-name merchandise at low prices
Serive retailers
Firms that primarily sell services rather than merchandise are a large and growing part of the retail industry
Several trends suggest considerable future growth in services retailing
Aging population - healthcare services
Younger people are spending more time and money on health and fitness
Busy homeowners - spend more money to have their homes cleaned, lawns mowed and even meals prepared
Using the marketing mix
We add presentation and personnel when discussing retail
Product:
Providing the right mix of merchandise and service that satisfies the needs of the target market
Price:
Price defines the value of both the merchandise and the service provided
Promotion:
Retailers use a wide variety of promotions both within their retail environment and through mass media
Place:
Convenience is a key ingredient to success
Presentation:
Retailers invest a lot of time and money in ensuring that merchandise is appropriately presented in their stores and online (atmospherics)
Personnel:
Well-trained sales personnel can influence the sale at the point of purchase by educating consumers about product attributes, pointing out the advantages of one time over the other, and encouraging multiple purchases, whether in the store, on the phone, or on the internet.
Benefits of the internet and omnichannel retailing
Deeper and broader selection
Personalization
Expanded market presence
Consumers desire a seamless experience when interacting with omnichannel retailers
Integrated CRM (Customer Relationship Management)
Brand image
Pricing
Supply chain
Chapter 10
Marketing Research and Analytics
How does Netflix conduct its market research?
Netflix Market Research
Sidinct profiles
When users watch particular content (day of the week, season, time of day, etc)
Whether they started watching after a season on the sire, and how long the search lasted?
Which devices (smart TV, phone, computer, etc) consumers preferred to use to watch which shows
When they paused, stopped or rewatched
Where they were when watching (home, airport, work, etc)
Etc
Marketing Research
Consists of a set of techniques and principles for systematically collecting, recording, analyzing, and interpreting data that can aid decision makers involved in marketing goods, services or ideas
Why marketing research?
Marketing research can provide valuable information that will help to make segmentation, targeting, positioning, product, place, price and promotion decisions
Questions to consider before starting research?
Will the research be useful?
Is top management committed to the project and willing to accept the results of the research?
Should the project be large or small?
Five Steps for the Marketing Research Process
Defining the objectives and research needs
Designing the research
Collecting the data
Analyzing the data and developing insights
Developing and implementing an action plan
Market Research is the secret ingredient for business success
Step 1: Definging the objectives and research needs
What information is needed to answer specific research questions?
How should that information be obtained?
Step 2: Designing the research
Let's take McDonalds
Do people always tell the whole truth in surveys?
Should we observe customers in the store interacting with employees and consuming the product?
Step 3: collecting the data
Secondary data:
Collected prior to the start of the research project
External as well as internal data sources
Primary data:
Collected to address specific research needs
Focus groups, in-depth interviews, surveys
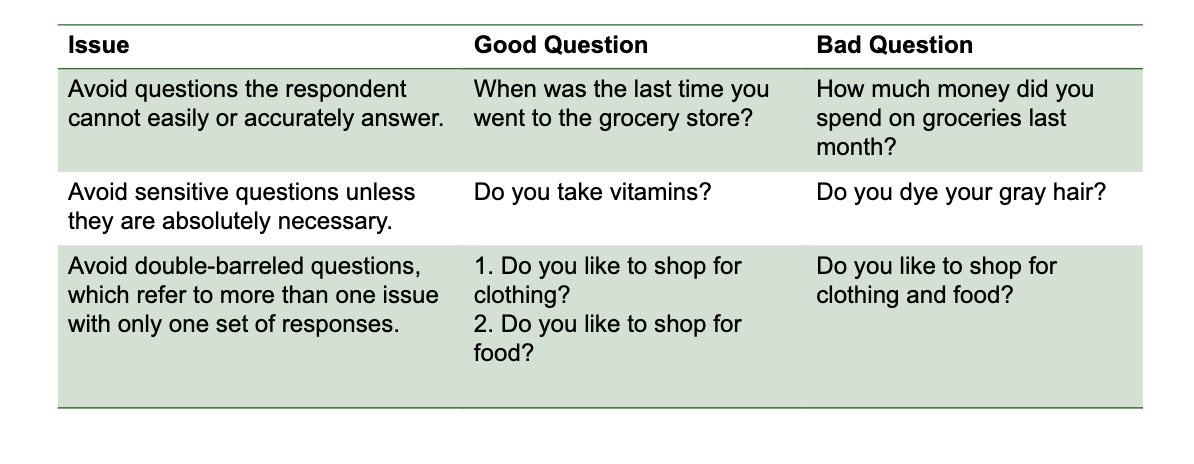
What to avoid when designing a questionnaire
Focus groups
Big data
Increase in amount of data
Ease of collecting and storing data
Computing ability to manipulate data
Access to software to convert data into decision-making insights
Data mining uses a variety of statistical analysis tools to uncover previously unknown patterns in the data or relationships among variables
The five V’s of Data
Volume: amount of data
Variety: diversity of data
Velocity: speed of data regeneration
Veracity: accuracy of data
Value: worth of data
Social media
Valuable source of data
Virtual communities
Sentiment mining
Advantages and disadvantages of secondary and primary data
Secondary research
Examples: census data, sales invoices, internet information, books, journal articles, syndicated data
Advantages
Saves time
Free or inexpensive
Disadavatnages
May not be relevant
May not be timely
Sources may not be original and therefore usefulness is an issue
Methodologies for collecting data may not be appropriate
Data sources may be biased
Primary research
Examples: observed consumer behavior, focus groups, surveys, experiments
Advantages:
Specific
Offers behavioral insights
Disadvantages
Costly
Time consuming
Requires more sophisticated training and experience to design studies and collect data
Step 4: Analyzing the data and developing insights
Converting data into information to explain, predict, and/or evaluate a particular situation
Step 5: Developing and implementing an Action Plan
Executive summary
Body - findings and methodology
Conclusions
Limitations
Supplements including tables, figures, and appendices
The ethics of using customer information
Sting ethical orientation
Adhere to ethical practices
Supply chain management
Chapter 4: Sales forecasting and inventory management
What is sales forecasting?
Sales forecasting is the process of gathering and analyzing information to estimate future sales
A sales forecast is an effort to estimate future sales to customers
It is a key input to supply chain management because it is the first step in planning supply chain operations
Supply chain managers are key participants and users of sales forecasts
This is because supply chain managers are tasked with developing plans to ensure that enough assets are allocated to match sales
Some of these assets include:
Labor
Trucks
Warehouse space
Production capacity
Reasons to forecast sales
Forecasts determine the level of production needed to support sales
Too much production leads to excess inventory
Too little production leads to stockouts and lost sales
Both outcomes lead to higher costs
Sharing a sales forecast data is beneficial, as one firm in the supply chain is dependent on the sales forecast provided by another firm in the supply chain
Two basic forecasting methods
Qualitative
Are based on a judgment of one or more knowledgeable forecasters
They are generally used when historical sales data are scarce or judged useless
Quantitative
Based on projections of historical sales data
They are best used whenever past sales are expected to be a good indicator of future sales
Qualitative forecasting methods: consensus panel
Formed by a group of experts who jointly decide on a sales forecast
Experts communicate with each other in the search for a consensus
One potential problem with this method is that the consensus may drift towards the experts with the strongest personalities, who are not necessarily the ones with the best estimate.
Alternatively, the experts may arrive at the estimate by averaging individual estimates
Qualitative forecasting methods: Delphi Method
A variation of the consensus panel where experts work independently and anonymously to arrive at a consensus
This avoids the consensus being is biased towards the experts with stronger personalities
A facilitator prepares a questionnaire and sends it to the experts
Each expert then answers the questions without consulting the other experts
After receiving all questionnaires, the facilitator prepares a summary report and sends it to the experts
After reading the summary report, experts have an opportunity to revise their answers
The revied answers typically begin to converge because all experts read the same summary report
This process is repeated until anserts no longer converge, usually after a consensus is reached
This method works in a wide range of topics
Qualitative forecasting methods: sales force estimate
Sales force estimates draw forecasts from the expert judgement of salespersons
Quantitative forecasting methods: moving average
A moving average (MA) is a simple and use to use forecasting method
It ises the average sales of a pre-specified number of past periods as a forecast of the next period in the future
For example, if a firm wants to predict october sales using a MA of the past three months, then it needs actual sales data for July, August and September
A key decision to make when forecasting with the MA method is to select hte number of periods to use in the moving average
The larger number if periods, the less the moving average reflects recent changes in sales
The optimum number of periods to select is the one that produces the smallest forecast error
The moving average method has an important shortcoming
Without modification, it does not consider either trend of seasonality in the data
Trend means that the average actual sales may be increasing or decreasing over time
Seasonality reflects predictable variation in demand due to an external factor
Quantitative forecasting methods: Exponential Smoothing
Very popular
Easy to use and requires little data
Through the use of a smoothing parameter, the ES method enables the forecaster to consider a longer sales history than the MA method, which is limited to the number of moving periods included in the compution of the moving average
On the other hand, the ES method is not recommended for long-term foresasts
It is best used to forecast one to three periods in the future
In addition, forecast eros may be large if the variability in the sales history is significant
Quantitative forecasting methods: Exponential Smoothing WITH TREND CORRECTION
Also known as second-order exponential smoothing
When sales trend up or down, the forecast needs to be correspondingly adjusted up or down
This is done by adding or subtracting a quality known as trend value
ONCE A TREND VALUE IS COMPUTED IT IS ADDED OR SUBTRACTED FROM THE NEXT PERIODS INITIAL FORECAST
Quantitative forecasting methods: Exponential Smoothing WITH SEASONALITY INDEX
Sales data may also exhibit seasonaltiy
When adjusted with a seasonality index sales figures from different seasons become comparable
If sales in a high season are typically 20% higher than average the seasonality index is 1.2
Diviidng the high season sales figure by 1.2 provides a seasonally adjusted figure to compare to other months' sales
Integrating Qualitative and Quantitative Forecasts: S&OP
Sales and operation planning is an integrative process that encourages firm to integrate multiple functions in the organization to share information in order to develop more accurate forecasts in toder to align resources to a single demand plan
S&OP focuses on three primary components
People
Process
Technology
S&OP allows firms to share forecasts and plans in a collaborative environment, which are then shared with suppliers and customers
Follows 5 critical steps that firms can follow that utilizes both qualitative and quantitative data in order to develop a consensus plan for the firm to follow
Integrating Qualitative and Quantitative Forecasts: CPFR
Collaborative planning, forecasting and replenishment
Cohesive bundle or business processes whereby supply chain trading partners ahsare information, syncronized forecasts, risk, costs and benefits with the intent of improving supply chain performances through joint planning and decision makin g
Was pilot project between walmart, warner lambert, SAP, man
Measuring forecasting error
Every forecast contains a level of error
Still, firms are better off with a forecast than without it
With the forecast, firms can quantify an expectation of future sales and then use that information to plan supply chain operations
There are three main purposes for measuring forecast error
To assess the level of confidence managers should have in a particular forcast
The smaller the error, the greater the confidence in the forecast
Second, measuring the forecast error is key to improve forecasts
Third, when forecasting sales for a large number of items, the forecast error works as a flag directing management to focus on the item with the largest forecast errors
Forecast errors are also impacted by two factors worth mentioning
Time horizon
The farther the future is the period being forecasted, the larger the error that should be expected
LEVEL OF AGGREGATION
The more detailed the harder it is to forecast accuracy
Forecast error is relatively larger when forecasting at greater level of detail
Three different measures of forecast error
Mean Absolute Deviation (MAD)
Mean Absolute Percent Error (MAPE)
Mean Square Error (MSE)
Mean Absolute Deveation (MAD)
SIMPLY a measure of the absolute average error for all time periods considered
Means are computed using the absolute values of the errors
Signifies that the value of each error is considered without its sign, which may be positive or negative
This is to avoid a problem whereby the errors of opposing signs cancel each other
Mean Absolute Percent Error (MAPE)
A percentage
Comparable across multiple products
The accuracy of the forecast for one product may be compared to the accuracy of the forecast for other products
Mean Square Error (MSE)
MAD and MAPE treat all errors equalluy
MSE has a measure that treats many small errors more favorably than a few large ones
Larger errors are more difficult to deal with when planning supply chain operations
The MSE attributes more weight to larger errors by squaring the error for each period