Economic Tools
Economics: The social science that studies choices that individuals, businesses, and governments make as they cope with scarcity
Scarcity: The inability to get everything we wany, Unlimited wants and limited recourses
Incentive: A reward or a penalty that encourages action
Ex: Prices
Economy: The social mechanism that coordinates choices and allocates scarce recourses to their alternative uses
Market Economy: Uses markets and prices to coordinate choices and allocate resources
Centrally Planned economy: Government regulators allocate most of the resources
Questions:
Why do prices exist?
Because of Scarcity
Why can't we avoid making choices?
We don't have enough time to do all the things we want to do, which forces us to prioritize our options and make decisions based on our available resources.
Economics is both a social science and a toolkit for advising on policy decisions
Economists try to understand and predict economic effects by using the scientific method
Economic model: A description of some economic phenomenon that includes only features assumed necessary to answer a question about some observed facts. They are mathematical and graph based
Natural experiment: An event that arises in the ordinary course of economic life when two situations differ by the one thing that we want to test
Correlation: A tendency for the values of two variables to move together
Laboratory experiment: Puts people in a decision-making situation and varies the influence of one factor at a time to discover how they respond to changed incentives
Economists use natural experiments, statistical investigations, and laboratory experiments to test the predictions of their models
Normative disagreements: Disagreements that can't be settled by facts. They arise from opinions and beliefs
Ex: We should burn less coal
Positive disagreements: Disagreements that can be settled by facts
Ex: Burning less coal slows the rise in the temperature of the planet
Economists try to avoid normative disagreements
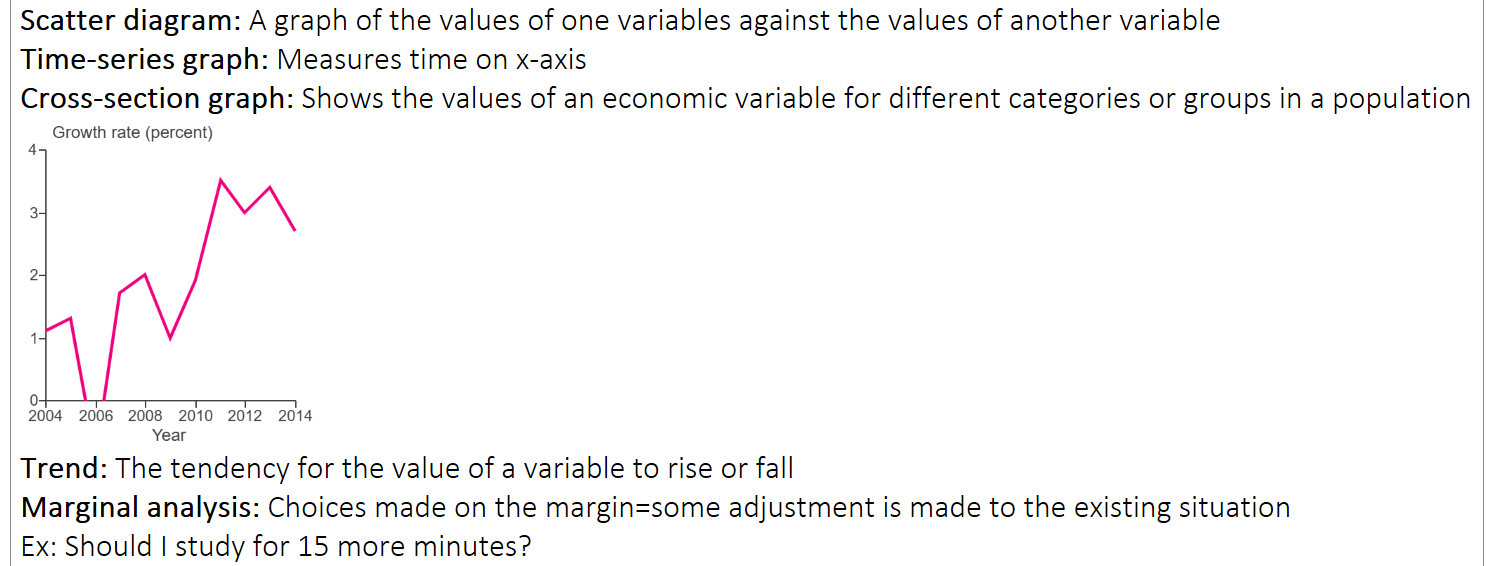
Scatter diagram: A graph of the values of one variables against the values of another variable
Time-series graph: Measures time on x-axis
Cross-section graph: Shows the values of an economic variable for different categories or groups in a population
Trend: The tendency for the value of a variable to rise or fall
Marginal analysis: Choices made on the margin=some adjustment is made to the existing situation
Ex: Should I study for 15 more minutes?