Statistics in Psychological Research
Key Learning Goals
Measures of Central Tendency and Spread
Describe three measures of central tendency: mean, median, mode.
Describe two measures of spread: range, variance, standard deviation.
Correlation
Distinguish between positive and negative correlations.
Discuss correlation in relation to prediction and causation.
Statistical Significance
Clarify the meaning of statistical significance.
2.4 Statistics in Psychological Research
Statistics are divided into:
Descriptive Statistics: Summarises and presents data. Includes tables, charts, graphs.
Inferential Statistics: Makes predictions or inferences about a population based on a sample.
Together, they provide a holistic view of data.
2.4.1 Descriptive Statistics
Purpose: Helps researchers describe and summarize data meaningfully.
Unlike inferential statistics, descriptive statistics do not allow conclusions beyond analyzed data.
Measures of Central Tendency
Central tendency assesses the central position within a data set.
Three Main Measures:
Mode:
Most frequently occurring value in a dataset (e.g., bimodal if two modes exist).
Median:
Middle value when data is ordered. Useful in datasets with outliers.
Example: For 2, 2, 5, 5, 10, the median is 5.
Mean:
Average of the data set. Sum of values divided by the number of observations.
Sensitive to outliers, making median preferable when outliers are present.
Measures of Spread
Definition: Describes the variability within a dataset, often used with central tendency measures.
Key Measures:
Range: Difference between the highest and lowest values.
Example: For the dataset 20, 24, 30, 54: Range = 54 - 20 = 34.
Variance: Average of squared differences from the mean. Helps assess data dispersion.
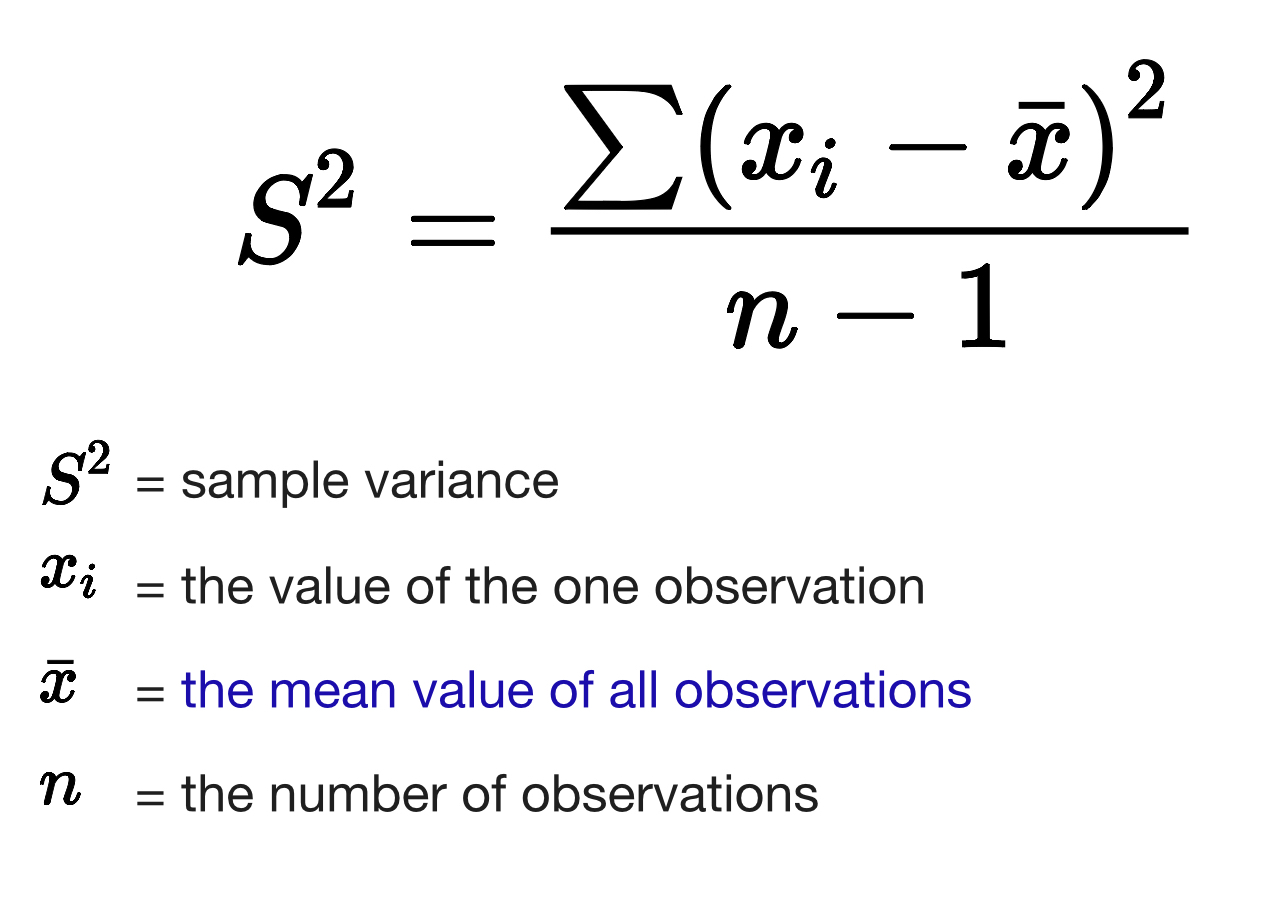
Standard Deviation: Square root of variance; indicates how spread out the values are relative to the mean.
Correlation
Definition: Analyzes the relationship between two variables.
Types of Correlation:
Positive Correlation: As one variable increases, the other also increases.
Example: Height and weight.
Negative Correlation: As one variable increases, the other decreases.
Example: Cigarette consumption and life expectancy.
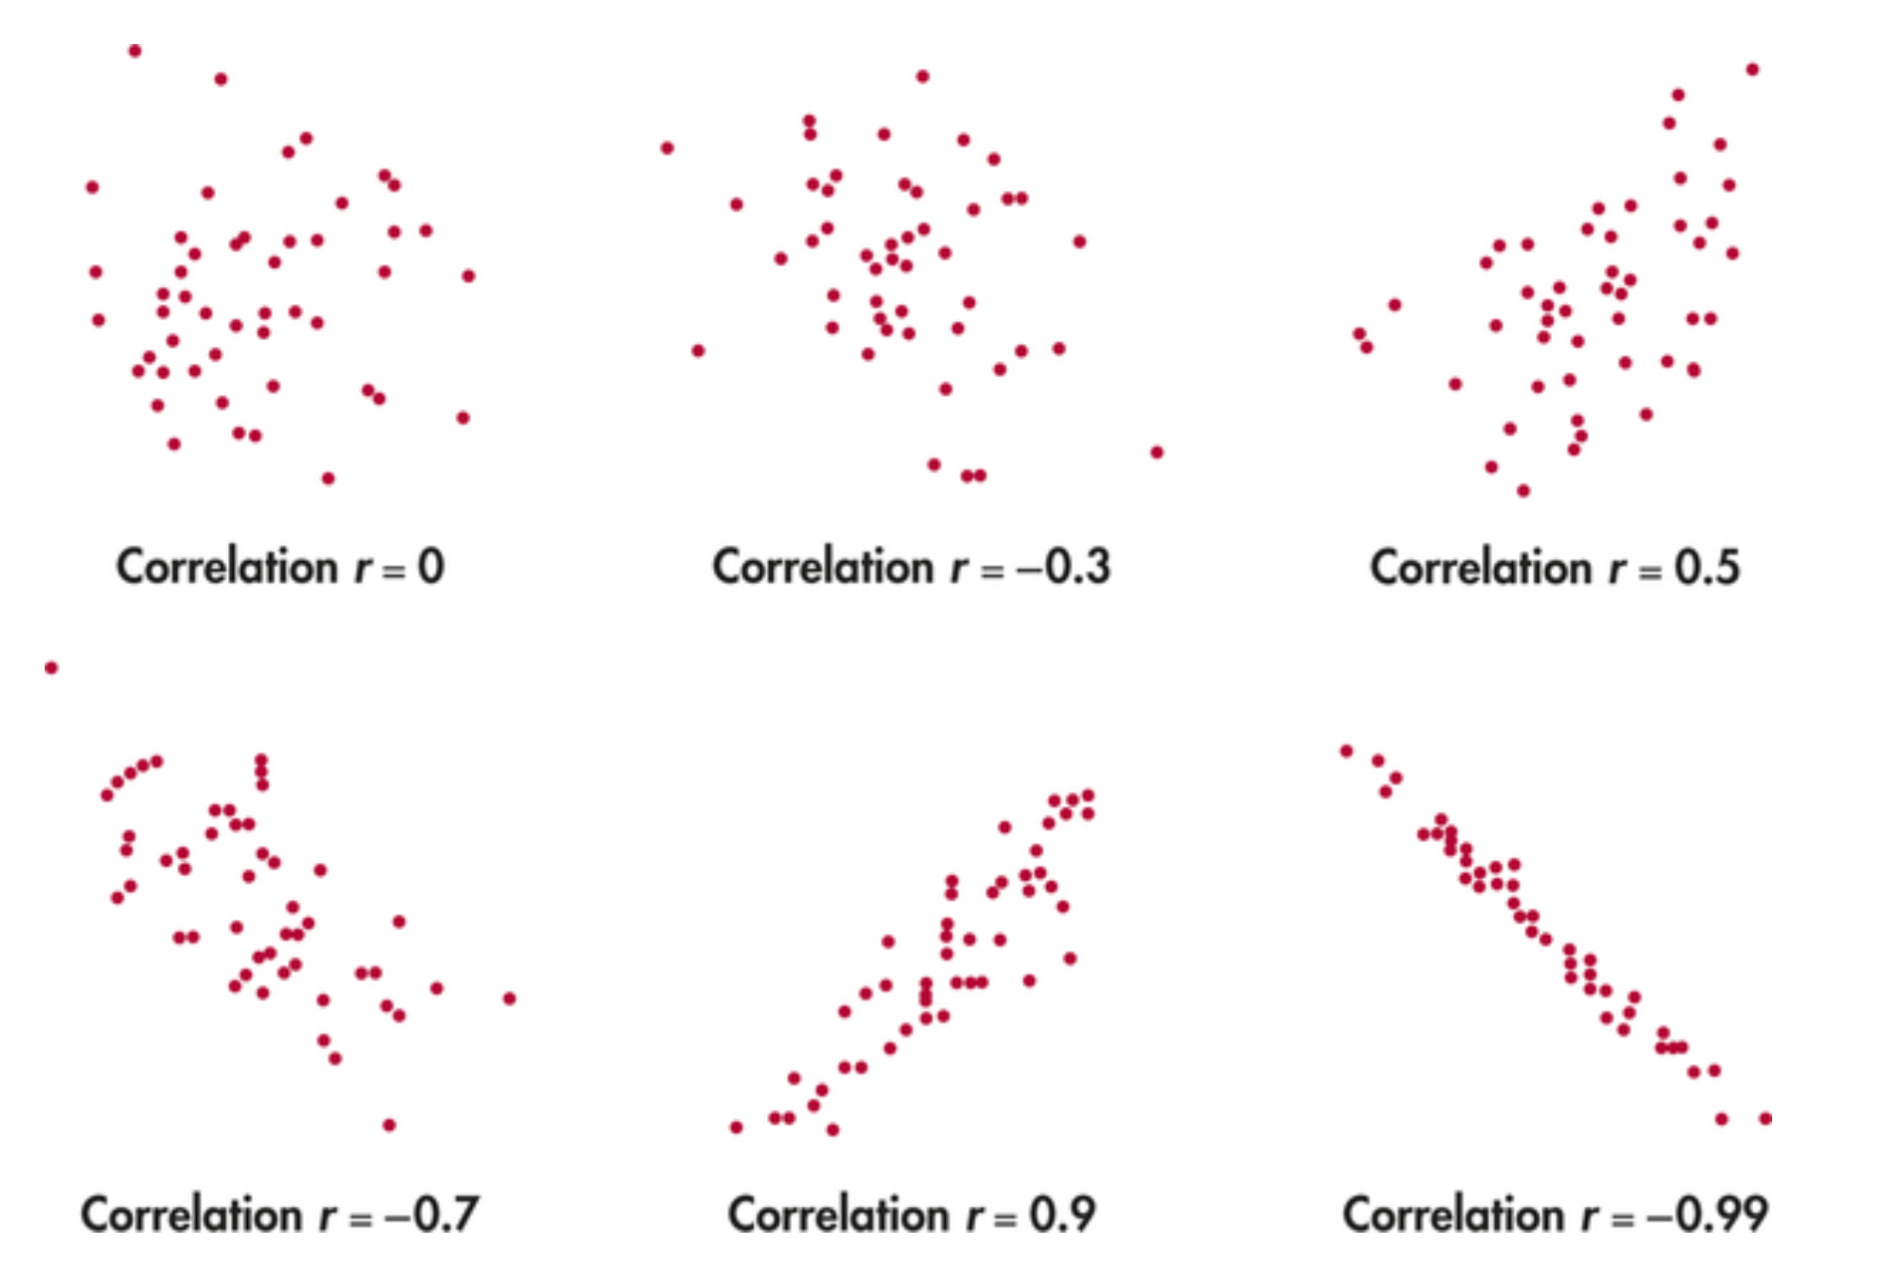
Strength of Correlation
Measured through correlation coefficients (r) ranging from -1.0 to +1.0.
+1.0 = perfect positive correlation, 0.0 = no correlation, -1.0 = perfect negative correlation.
Ranges of Correlation Coefficients:
Perfect Positive: +1.00
Strong Positive: +0.60 to +0.90
Moderate: +0.30 to +0.60
Weak: +0.10 to +0.30 or -0.10 to -0.30
No correlation: -0.10 to +0.10
Correlation and Prediction
Stronger correlations enhance predictive capabilities of one variable based on another.
Significant high correlations indicate better prediction; lower correlations indicate poor predictive power.
Correlation and Causation
A high correlation does not imply causation.
Example Misunderstanding: Correlation observed between children’s foot size and vocabulary does not mean one causes the other; both may be influenced by age.
Reality Checks
Misconception: A strong correlation implies causation.
Reality: Correlation does not imply causation; a third variable might influence both.
Misconception: Statistically significant findings guarantee accuracy.
Reality: Significance means low probability of being due to chance, but it does not ensure the conclusion is correct.
2.4.2 Inferential Statistics
Purpose: Helps assess whether data supports hypotheses, draws conclusions from samples to populations.
Generalizes findings from a representative sample to the larger population.
Statistically significant results indicate low likelihood of chance.
Example: In drug efficacy research, a sample is used to infer results about the broader population.