AP Human Geography Unit 2 Exam Review
Population Density
Arithmetic Density: Total number of people in an area (MOST COMMONLY USED)
Population divided by land area (What most people mean when they talk about population density)
Says little about population distribution
Does not take into consideration internal clustering of people in a country
Simply an average of people overall in an area
Does not take into account whether the land is habitable or not
May indicate that places are far less crowded than they are
Country can lower its arithmetic density by limiting the size of its population
Physiological Density: Number of people supported by a unit area of arable land or land suitable for agriculture
More reflective of population pressure on arable land
Provides insights into relationship between the size of population & availability of resources in a region
Useful to determine carrying capacity – number of people the area can sustain or support
Depends on available space, but available technology, wealth, climate & ability to bring in resources from other areas for support
Infrastructure can increase carrying capacity
Agricultural Density: number of farmers per unit of arable land
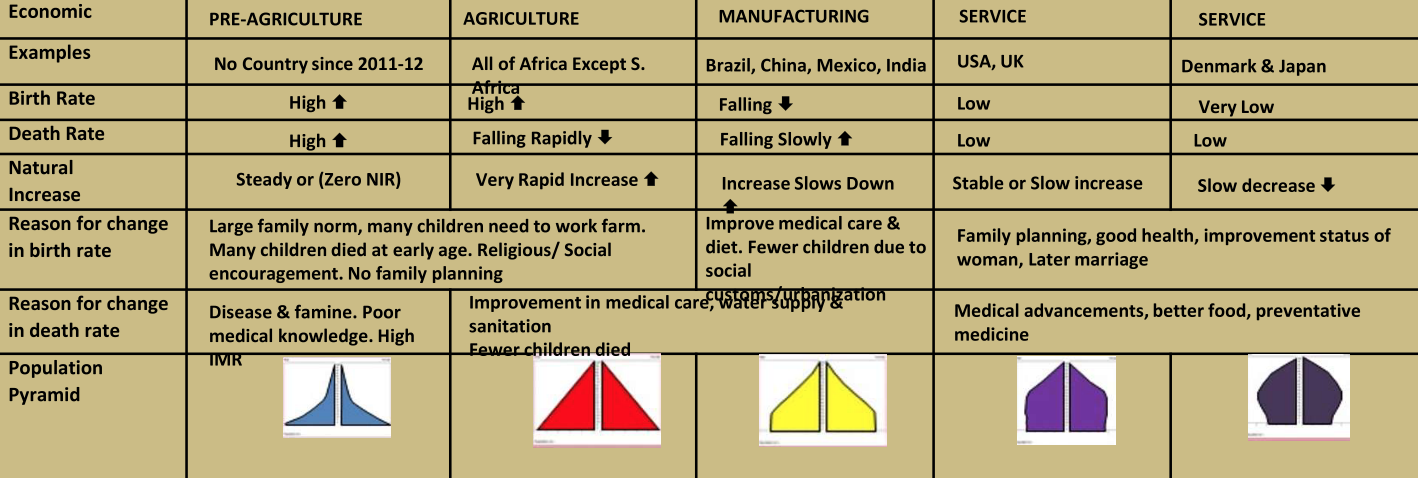
Low density, in developed countries or MDC, suggest the presence of larger farms or more mechanized farming technology
Very high density, in developing countries or LDC, means many farmers are on each piece of farmland
Population Composition

Population Dynamics
Countries population changes as a result of 4 conditions:
Births, Deaths, emigration & immigration
Factors that determine a population’s growth & decline:
Mortality Rate or (Crude Death Rate (CDR): number of deaths per year per 1000 people in population)
Highest is in Sub-Saharan Africa strongly influence by AIDS
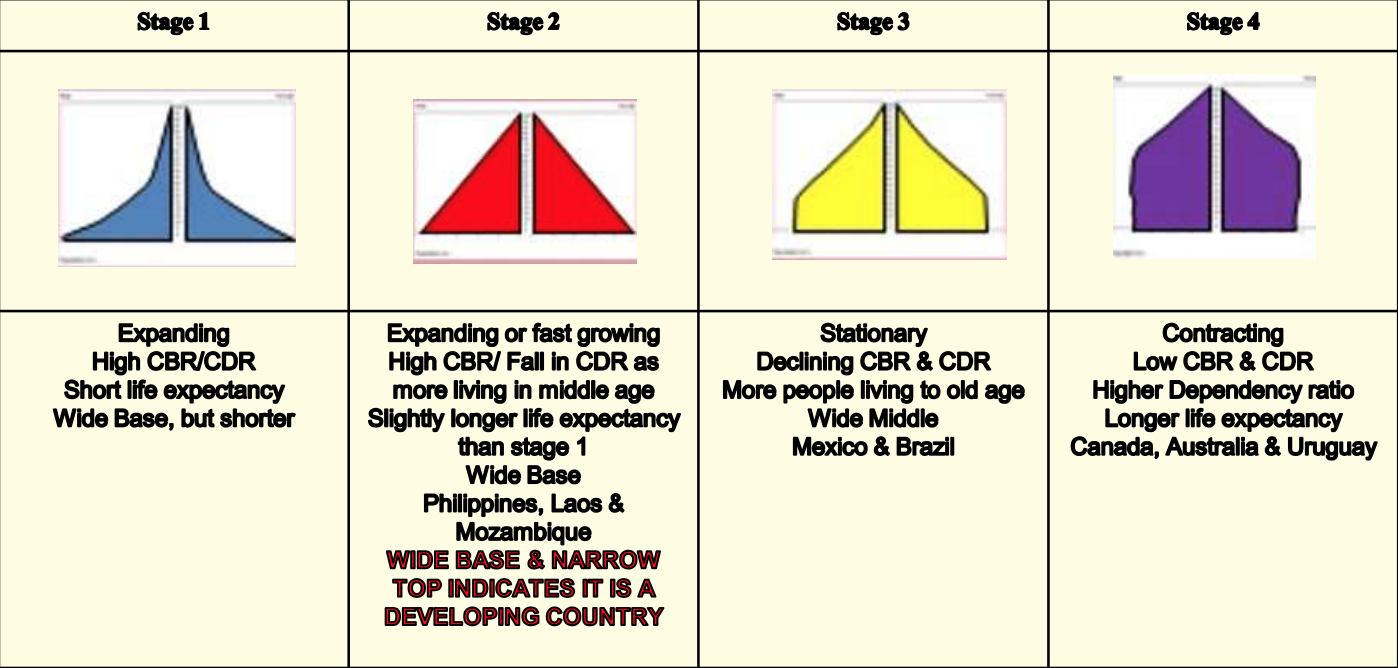
Fertility Rate or (Crude Birth Rate (CBR): number of births per year per 1000 people in population)
Countries with high CBR & CDR has a board base population pyramid
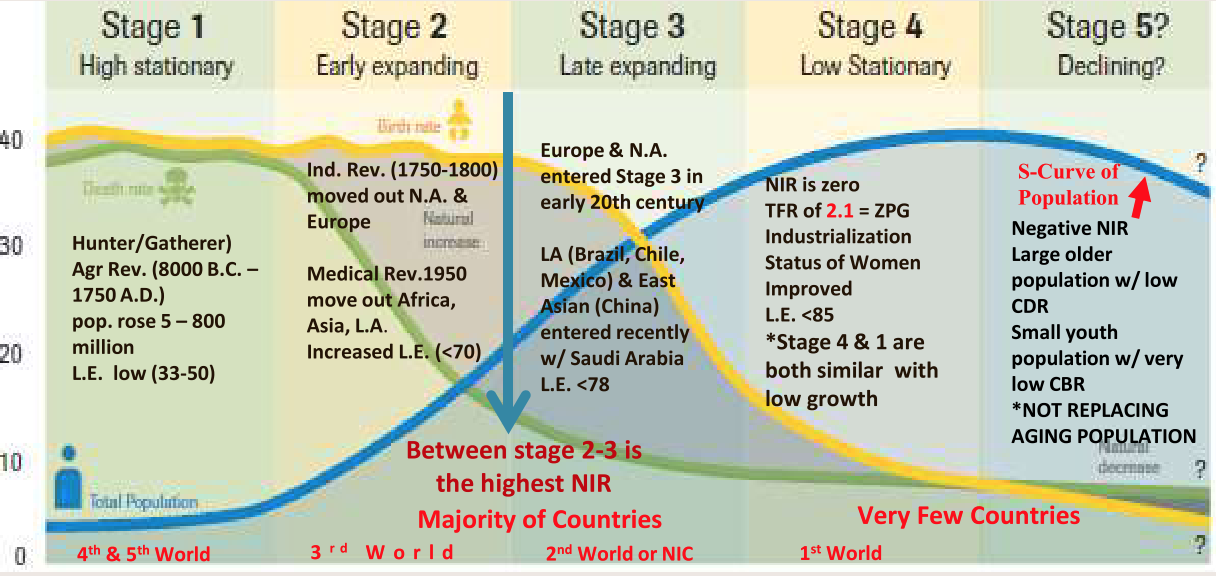
European & U.S. decline in CBR was the result of the effects:
Industrialization, urbanization, modernization, birth control & woman’s education, as well, entrance into the workforce
At present rate of birth & deaths in the world , we are adding about 85 million people every year
Total Fertility Rate (TFR): average number of children born per woman in a society
# of births needed to keep a population at a stable level without immigration, requires a TFR of 2.1
Life expectancy: number of years the average person will live.
Europe LE is 80, in LDC, such as, Sub-Sahara Africa LE is less than 50
Infant Mortality Rate (IMR): the number of children who die before their first birthday
Since declining the most important factor increasing life expectancy
Lowest is in Japan
Highest is central Africa or Sub-Saharan Africa
Migration Rate: the percentage gain or loss of population due to migration
Geographers use to explain population growth & decline
Rate of natural increase (NIR)
NIR exceeds 2.0% in most countries of sub-Saharan Africa
Highest NIR are found in countries that are in stage 2 of the DTM
Population-doubling time
World’s NIR is currently 1.2% at which rate the world's population is projected to double in about 54 years
World population double is increasing (meaning taking longer to double)
Other factors that led to population growth
Better food production & nutrition
Advance in public sanitation
Improvement in healthcare
Cultural Factors | Political Factors | Economic Factors | |
|---|---|---|---|
Fertility Rate | Marriage Status of a woman in society | Access to health care, birth control (contraceptives) and abortion | Industrialization, education, type employment |
Mortality Rate | Role of woman in society | Sanitation & medical services | Industrialization, education, type employment |
Migration Rate | Religious freedom Ethnic diversity | Governments policies | labor standards, unemployment situation & overall health of economy |
Epidemiological Transition Model (ETM)
Stage | Description | Effects on Population |
|---|---|---|
1. Pestilence & Famine | parasitic of infectious diseases, accidents, animal attacks or human conflict causing most deaths | High Death Rate / Low Life Expectancy |
2. Receding Pandemics | number of pandemics declining as a result of improved sanitation, nutrition, and medicine | Decreasing Death Rate / Increasing Life Expectancy |
3. Degenerative & Human Created Diseases | infectious and parasitic diseases continuing to decrease, but diseases associated with aging, such as heart disease and types of cancer-increase as people live longer | Stabilizing Death Rate / Increasing Life Expectancy |
4. Delayed Degenerated Diseases | age-related diseases being put off as medicine delays the onset of these diseases through advanced procedures | Death Rate at lowest / Life Expectancy Peaking |
5. Reemerging of Infectious & Parasitic Diseases | infectious and parasitic diseases increasing as some bacteria and parasites become resistant to antibiotics and vaccines | Life Expectancy Decreasing |
Malthusian Theory
In 1798, predicted that the earth's population would eventually outgrow the food supply
Food supply increases arithmetically (1,2,3,4), while population increases geometrically (1,2,4,8)
Conclusion: Geometrically growing population would outgrow an area’s food supply, thus causing people to die off or leading people into poverty.
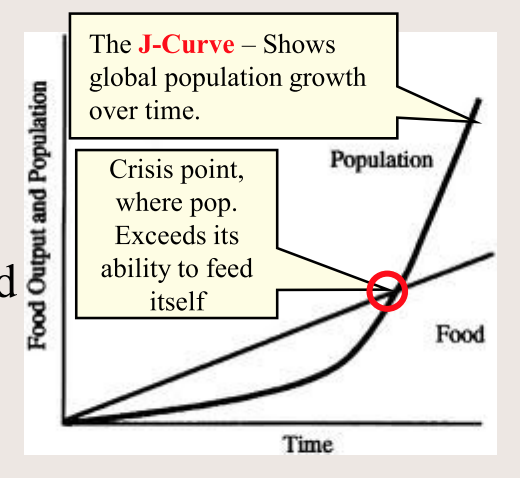 J-Curve shows how population grows slowly and then skyrockets
Neo Malthusians (Agree with Malthus) or Ehrlich Theory
Believed population will outstrip resources, widespread famine by 2050.
Created the S-Curve (logistic model) to show how at higher population densities
Limited resources lead to competition & eventual end to population growth
Did not foresee Green Revolution & drop in fertility rates
Neo Malthusians advocated for population control programs to enough resources for current & future populations
Critics of Malthus
Esther Boserup Theory criticize his theory that pop growth causes problems
Explained how population increase necessitates increased inputs of labor & technology to compensate for reductions farming
Cornucopian Theory
Suggests human invention & innovation will help expand food supply
Marxists Critics of Malthus
Frederic Engels criticized Malthus as being “capitalist”
If the worlds resources were shared evenly among all, then there would be plenty & poverty/hunger could be avoided
Malthus Theory vs Reality
In the last half-century:
Human population has grown at its most rapid rate ever
Population grown more than 22x from the year 1000 to 2000.
In 1000, 275,000,000 people & in 2000, 6,145,006,989 people on Earth
World food production has grown consistently faster
Population Policies
Types of population policies include those that promote or discourage population growth:
Population Policies are laws enacted by the government to influence the size & structure of a country’s population
Pro-natalist- An attitude or government policy that encourages childbearing or increase fertility rate
Help keep economy vibrate
Instituted in France, Sweden, Poland & Japan
Paid time off for mothers (Maternity Leave)
Tax breaks
Cash incentives
Free childcare
Discount for government services
Free college tuition
Restriction on birth control & abortion
Anti-natalist– Gov’t control the number of children they have
Policies discourage growth with the use of contraceptives/ abortions/ disincentives
China’s approach to reduce population
1970 – gov’t encouraged "Later, longer, fewer" policy
Later births, longer space between births, and fewer births
1979 - One Child Policy - couples were only allowed one child
Only in certain situations couples were allowed more than one child
Policy WAS successful
Birth rate has fallen, population growth has slowed
400 million possible births prevented
Some rural areas & ethic groups (such as Han Chinese) allowed 2nd child
Policy WAS NOT successful
Policy not popular in rural areas, more children needed for farming
Men are family carrier, so girls were aborted or terminated
Causing a gender unbalance with 30 million more men than women
China now facing an ageing population that costs the government & family more money
Projected shortage of working-age people to care for the rising elderly population, resulting in an increase in the cost of living for older people
India’s Population Policies
Gov’t spends several hundred million dollars annually on various family-planning programs
Including the distribution of birth-control devices & abortions
India’s most controversial family-planning program was the establishment of sterilization camps
In 1970’s, government of India used forced sterilization of males as a method to reduce the population
Opposition to the sterilization camps because the thought that eventually sterilization would be forced
Immigration Policies
Policies Encouraging Migration
Guest worker policies
Family reunification policies
Other policies the include allowing refugees
Countries with aging population attempt to stimulate economic growth to lessen the effects of rising medical and retirement cost by promoting immigration
Policies Discouraging Migration
Immigration laws
Quotas
Women and Demographic Change
TFR is dropping worldwide & one of the factors that has the biggest effect on it is the role of women in society
Changing social values and access:
Education & Employment
Woman obtain more schooling, expand their job opportunity
Longer they stay in school, fewer children they will have.
Or having children later in life
Healthcare
Better health care led to a lower infant mortality rate
Higher life expectancy
Family Planning/ Contraception
Couples having children later in life
Resulting in less children
Fewer unintended pregnancies
Ravenstein detailed gender & family-status patterns in his migration laws:
Adult Males are more mobile, migrate farther, have more economic opportunity & income than females
Migration shift:
High percentage of females in the workforce of developed countries attracts a high percentage of female immigrants
Since the 1990s, largest group of unauthorized immigrants from Mexico to the U.S. are female
Some developed countries have allowed wives to join husbands who have already immigrated
Not present in developing countries, male immigrants still outnumber female ones
Aging Populations
Increase in the ageing population aging:
Better food
Advance in public sanitation
Improvement in heath care
Causing a decrease in CBR & CDR with increase life expectancy
110 years ago, it was 34
Today nearly 70
“Graying” population places a burden gov’t of develop countries to meet the needs of their elderly population
Must receive adequate income & medical care
Fastest growing population is now over the age 80
Highest L.E. in Japan
Lowest L.E. in Sub-Saharan Africa
Dependency ratio is the number of dependents (people aged 0-14 & over age 65) compared with the working population (age 15-64)
No countries has a dependency ratio higher than 100
Meaning more nonworking age people than working aged people
Traditionally, LDCs have higher dependency ratio because of high birth & death rates
Democratic Republic of the Congo, has a ratio of 97 as of 2017, above the world average of 54.
Lately, some MDCs have been trending with high aging populations
Japan is currently up to 68, mostly older.
Consequences: Aging populations are likely to support cuts to education, increased pensions & support of crime legislation
Causes of Migration
Push/Pull Factors
Economic Factors
Push: Lack economic opportunities (Less jobs)
Pull: available economic opportunities (more jobs)
Most important pull factor for migrants to N. America today
Roughly 42 million (2015), about 1 million additional people arriving annually
#1 reason why people from the developing world move to the developed world
Social Factors
Push: Discrimination & persecution because ethnicity, race, gender or religion
Pull: Cultural Safety
Push/Pull Factors
Political Factors:
Push: Face persecution, arrest & discrimination
War in Syria, over 5 million to flee the country according to the UNHCR (UN’s High Commissioner for Refugees)
Oppression causes people to leave their country (Unfortunately people are persecuted throughout the world)
Some are persecuted for…
Their religion (Christians in Sudan)
Speaking out against their government (journalists jailed in Myanmar)
The ethnicity or race (black people in South Africa under apartheid)
Pull: Support political view or better political climate or giving asylum
Environmental Factors
Push: hazardous regions, adverse physical conditions, such as natural disasters or most common - water condition (Lack of w/ drought or to much w/ flooding)
Natural disasters & /or environmental reasons can cause people to move
Ex: Population of New Orleans dropped by over a quarter of a million people since Hurricane Katrina in 2005
Pull: physically attractive regions – Florida the “Sunshine State”
Ex: "Snowbird" (individuals who reside in the north during the summer & move south in the winter).
Intervening opportunities/obstacles
Environmental obstacles: physical features like deserts, oceans, mountains, or logistical problems like traveling long distances
Political obstacles: could be proper documentation (Visas or Passports), or getting past man-made obstacles like an exclusion wall
Cultural obstacles: Citizens the country people are migrating into are afraid their unique culture will be lost.
Immigrants sometimes get blamed for unemployment, high welfare rates, or crime
Demographics leaving an overpopulated country
Also, reason cannot enter a country
Some have quotas on how many people of certain countries are allowed to come in
Number is met no more people cannot migrate there
Economic
Many developing countries have corrupt systems that make applying for visas or passports very expensive & difficult to receive
Coming into a country can be expensive & deter people from entering
Sometimes migrants traveling to a specific country find intervening opportunities then moving to a destination they did not intend to originally
Ex: Syrians set out to migrate to Germany, but ended up in Serbia
Found a supportive government & warm welcome from the Serbians
Ravenstein's Laws of Migration
Majority of migrants do not move far away from their homes.
Every migration generates counter-migration or a return.
Migrants who choose to move far go to cities with more opportunity for jobs.
People from rural areas are more likely to migrate than people from urban areas.
Young adults are more likely than families to migrate internationally.
Majority of migrants are adults.
Cities tend to grow by migration and not by natural increase rate.
Men are more likely to travel long distances.
Those men are more likely to travel by themselves and not with their family.
Most people migrate for better economic activities.
Geographer Wilbur Zelinsky's model of migration predicted migration characteristics vary with the demographic transition.
Migration Transition (As Applied to the Demographic Transition Model)
Stage 1 | Stage 2 | Stage 3 & 4 |
|---|---|---|
High daily or seasonal mobility in search of food (Hunter & gatherers) Very unlikely to migrate internationally | High international emigration and interregional migration from rural to urban areas. International migration reaches its peak | Likely to migrate internally and intraregional migration from cities to suburbs |
Forced and Voluntary Migration
Forced migrations are where human migration flows in which the movers have no choice but to relocate
Best example of forced migration is Slavery
During the 17th & 18th centuries, hundreds of thousands of Africans were forcibly brought to the Americas in the Triangle Trade
Smallest # of slaves involved in the Atlantic Slave Trade was sent to British North America
Forced migrations produce different types of migrants according to the UNHCR:
Refugees are forced to migrate because of a threat to their life and cannot return for fear of persecution.
Ex: People who have fled Syria, due to the ongoing civil war
Internally displaced persons (IDP) is a refugee within his or her own country
Similar to refugees, but they have not migrated internationally
In 2012, Colombia had around 5 million IDPs, because of the rampant drug cartels throughout the country
Asylum seekers find shelter & protection in one state for refugees from another state
Cuban immigrants who actually make it to the U.S. shores are allow to stay, this is known as the “Wet foot, Dry foot policy”
Hoping to be recognized as refugees
Ex: Migrant caravan that was traveling to the U.S. in 2018 from Central America
Claiming they fled due to persecution in their home countries
Under U.S. immigration policies refugees receive special priority over economic migrants
Causes of Forced Migration:
Natural or manmade disaster
Human trafficking
War and civil war
Fleeing persecution
Slavery
Development Projects
Examples to Correspond:
Hurricane Katrina
International Sex Trade
Civil War in Rwanda
Afghans fleeing the Taliban
Atlantic Slave Trade
Three Gorges Dam construction in China
Effects of Migration
Effect on Countries of Origin
Positive Effects:
Reduce overcrowding
Receive remittances or money sent from receiving country
Reduce unemployment
Negative Effects:
As work-age people leave (young workers), the population that is left are elderly & children
Economically creates a dependency ratio problem
Culturally undercuts traditional family structure
Lose highly skilled workers heading to develop countries of opportunity (Brain drain)
Effect on Receiving Countries
Positive Effects:
Help with worker shortage & willingness to take low pay
Gain highly skilled workers or educated is known as a Brain Drain
stimulate the economy (new workers pay taxes and buy goods)
Contribution new ideas /innovations/ cultural diversity
Negative Effects:
Migrants send remittance or money back to their home countries
Migrant exploitation
Stains on public services
Cultural conflicts